Refer to Important disclosures in the last page of this report
StockDataTarget price (Rp) Rp42,500
Prior TP (Rp) Rp43,800
Shareprice (Rp) Rp43,950
Upside/downside (%) (3.3)
Sharesoutstanding (m) 7,630
Marketcap. (US$ m) 22,028
Unilever Indonesia Holding 85.0%
Estimate Change; Vs. Consensus 2018F 2019F PT Indo Premier Sekuritas [email protected] +62 21 5793 1169
Lackluster 3Q18 result
Sluggish top line growth, falling below expectation.
Outstanding bottom line on the back of sale of spreads business.
Margin pressure still persists.
Maintain Hold on UNVR with lower TP of Rp42,500.
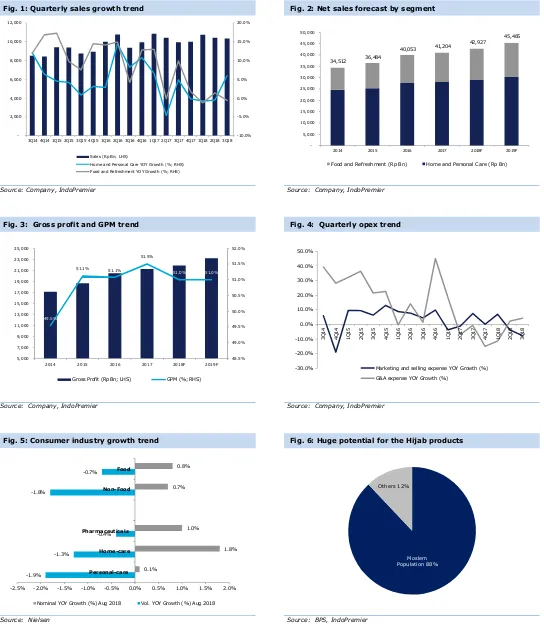
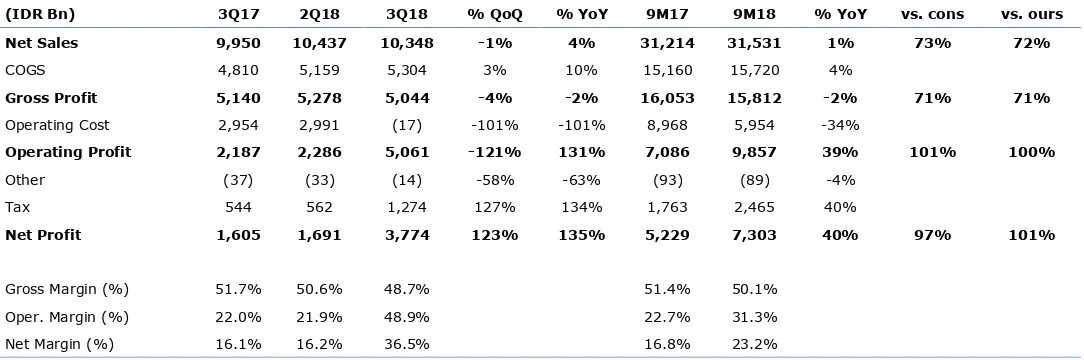
Sluggish top line growth, below expectation.
UNVR recorded net sales of
Rp10.3tn in 3Q18 (+4% yoy; -1% qoq) and Rp31.5tn cumulatively in 9M18 (+1%
yoy), forming 73% of consensus and 72% of ours. Home and personal care (HPC)
segment contributed a significant growth at +6% yoy in 3Q18, while food and
refreshment (FR) declined -0.6% yoy during the same period. On the contrary,
the company’s bottom line grew significantly recording Rp3.8tn in 3Q18 (+135%
yoy; +123% qoq) and Rp7.3tn in 9M18 (+40% yoy), forming 97% of consensus
and 101% of ours. This improvement in net profit can be contributed to the sale
of their spreads segment, which was realized in 3Q18. We remain cautious on
UNVR following the company’s muted growth and declining margin.
Sale of spread business boosted bottom line.
At the end of 2017, Unilever
decided to sell their Spreads segment to KKR, including brands such as Blue Band,
ProActiv and Country Crock. This transaction was only realized in 3Q18, which
was recorded at Rp2.7tn as other income. As a result of this sale, the company’s
operating income and net profit jumped to Rp9.9tn (+39% yoy) and Rp7.3tn
(+40% yoy) respectively in 9M18. However, this is only a one-off gain and will
not be sustainable for the company going forward. If we take out the gain from
the spreads segment sales, operating profit actually declined by -1% yoy in 9M18.
Margin Pressure still persists.
With the further strengthening of the USD and
rising oil price, the company’s margins are put under more pressure. Gross
margin in 3Q18, dropped considerably by 190bps yoy in 3Q18 to only 48.7% (vs.
2Q18: 50.6%; 3Q17: 51.7%), the lowest since 3Q14. Looking into the segments
more closely, both HPC and FR gross margin dropped to 51.1% (320bps yoy;
-140bps qoq) and 43.1% (-270bps yoy; 380bps qoq) respectively in 3Q18. On a
more positive note, marketing and selling expenses continues to drop in 3Q18 by
-7.7% yoy (-4% qoq), slightly dampening the drop in margin.
Valuation.
We slightly trimmed down our revenue forecast by 2.0%/1.5%
following the company’s lackluster growth in 9M18. However, we raise our net
profit forecast by 27% for FY18F taking into account the one-off gain from their
spread segment. Despite our cautious stance, we are still seeing an upside
potential from their personal-care segment, in particular the Hijab products. We
rollover our valuation to FY19F, maintaining our HOLD on the company with a
lower TP of Rp42,500 (based on target P/E of 43x). We transfer coverage from
Putri Tobing to Elbert Setiadharma.
Unilever Indonesia
(
UNVR.IJ
)
30 October 2018
Source : UNVR, IndoPremier Share Price Closing as of : 29-October-2018
2
Refer to Important disclosures in the last page of this report
Fig. 1: Quarterly sales growth trend Fig. 2: Net sales forecast by segment
Source: Company, IndoPremier Source: Company, IndoPremier
Fig. 3: Gross profit and GPM trend Fig. 4: Quarterly opex trend
Source: Company, IndoPremier Source: Company, IndoPremier
Fig. 5: Consumer industry growth trend Fig. 6: Huge potential for the Hijab products
Source: Nielsen Source: BPS, IndoPremier
-10.0%
3Q14 4Q14 1Q15 2Q15 3Q15 4Q15 1Q16 2Q16 3Q16 4Q16 1Q17 2Q17 3Q17 4Q17 1Q18 2Q18 3Q18 Sales (Rp Bn; LHS)
Home and Personal Care YOY Growth (%; RHS) Food and Refreshment YOY Growth (%; RHS)
34,512 36,484
2014 2015 2016 2017 2018F 2019F
Food and Refreshment (Rp Bn) Home and Personal Care (Rp Bn)
49.5%
2014 2015 2016 2017 2018F 2019F
Gross Profit (Rp Bn; LHS) GPM (%; RHS)
-30.0%
Marketing and selling expense YOY Growth (%) G&A expense YOY Growth (%)
-1.9%
Nominal YOY Growth (%) Aug 2018 Vol. YOY Growth (%) Aug 2018
Moslem Population 88%
3
Refer to Important disclosures in the last page of this report
Fig. 7: Earnings Revision
Source: Company, IndoPremier
Fig. 8: Results Summary
(IDR Bn) 3Q17 2Q18 3Q18 % QoQ % YoY 9M17 9M18 % YoY vs. cons vs. ours
4
Refer to Important disclosures in the last page of this report
Year To 31 Dec (RpBn) 2016A 2017A 2018F 2019F 2020F
Income Statement
Net Revenue 40,054 41,205 42,927 45,465 48,600
Cost of Sales (19,595) (19,985) (21,045) (22,274) (23,867)
Gross Profit 20,459 21,220 21,882 23,191 24,733
SG&A Expenses (11,752) (11,715) (12,239) (12,971) (13,993)
Operating Profit 8,707 9,505 9,643 10,220 10,740
Cash & Equivalent 374 405 2,567 392 591
Receivable 3,810 4,855 3,902 4,133 4,418
Inventory 2,318 2,394 2,338 2,475 2,652
Other Current Assets 86 288 293 300 308
Total Current Assets 6,588 7,942 9,101 7,300 7,970
Fixed Assets - Net 9,529 10,422 11,233 11,968 12,329
Goodwill 472 453 431 410 389
Non Current Assets 156 90 90 90 90
Total Assets 16,746 18,906 20,855 19,768 20,777
ST Loans 2,393 3,450 3,000 2,800 2,500
Payable 4,642 4,527 0 5,303 5,683
Other Payables 3,843 4,555 4,036 4,272 4,577
Current Portion of LT Loans 0 0 0 0 0
Total Current Liab. 10,878 12,532 12,047 12,375 12,760
Long Term Loans 0 0 0 0 0
Other LT Liab. 1,163 1,201 1,201 1,201 1,201
Total Liabilities 12,041 13,733 13,248 13,576 13,961
Equity 172 172 172 172 172
Retained Earnings 4,532 5,001 7,435 6,020 6,644
Minority Interest 0 0 0 0 0
Total SHE + Minority Int. 4,704 5,173 7,607 6,192 6,817
Total Liabilities & Equity 16,746 18,906 20,855 19,768 20,777
5
Refer to Important disclosures in the last page of this report
Year to 31 Dec 2016A 2017A 2018F 2019F 2020F
Cash Flow
Net Income (Excl.Extraordinary&Min.Int) 6,391 7,005 9,228 7,536 7,935
Depr. & Amortization 498 496 689 764 839
Changes in Working Capital 189 (887) 1,117 56 88
Others 587 (227) 313 (15) 220
Cash Flow From Operating 7,665 6,387 11,347 8,343 9,082
Capital Expenditure (1,548) (1,304) (1,479) (1,479) (1,179)
Others 7 4 10 10 10
Cash Flow From Investing (1,541) (1,300) (1,469) (1,469) (1,169)
Loans 693 1,057 (450) (200) (300)
Equity 0 0 0 0 0
Dividends (5,843) (6,494) (6,794) (8,951) (7,310)
Others 245 (90) (161) (145) (133)
Cash Flow From Financing (4,905) (5,527) (7,406) (9,296) (7,743)
Changes in Cash 1,219 (440) 2,473 (2,422) 171
FinancialRatios
Gross Margin (%) 51.1 51.5 51.0 51.0 50.9
Operating Margin (%) 21.7 23.1 22.5 22.5 22.1
Pre-Tax Margin (%) 21.4 22.7 28.7 22.2 21.8
Net Margin (%) 16.0 17.0 21.5 16.6 16.3
ROA (%) 39.4 39.3 46.4 37.1 39.1
ROE (%) 134.1 141.8 144.4 109.2 122.0
ROIC (%) 93.9 89.2 96.1 77.0 86.8
Acct. Receivables TO (days) 33.8 38.4 37.2 32.3 32.1
Acct. Receivables - Other TO (days) 0.0 0.0 0.0 0.0 0.0
Inventory TO (days) 8.5 8.5 8.9 9.3 9.3
Payable TO (days) 88.3 83.7 82.7 84.5 84.0
Acct. Payables - Other TO (days) 0.0 0.0 0.0 0.0 0.0
Debt to Equity (%) 50.9 66.7 39.4 45.2 36.7
Interest Coverage Ratio (x) 0.0 0.0 0.0 0.0 0.0
Net Gearing (%) 42.9 58.9 5.7 38.9 28.0
Head Office
PT INDO PREMIER SEKURITAS
Wisma GKBI 7/F Suite 718
Jl. Jend. Sudirman No.28
Jakarta 10210 - Indonesia
p +62.21.5793.1168
f +62.21.5793.1167
INVESTMENT RATINGS
BUY : Expected total return of 10% or more within a 12-month period HOLD : Expected total return between -10% and 10% within a 12-month period SELL : Expected total return of -10% or worse within a 12-month period
ANALYSTS CERTIFICATION.
The views expressed in this research report accurately reflect the analysts personal views about any and all of the subject securities or issuers; and no part of the research analyst's compensation was, is, or will be, directly or indirectly, related to the specific recommendations or views expressed in the report.
DISCLAIMERS