UJI VALIDITAS DAN RELIABILIAS VARIABEL MUTU PELAYANAN
Case Processing Summary
N %
Cases
Valid 96 100.0
Excludeda 0 .0
Total 96 100.0
a. Listwise deletion based on all variables in the
procedure.
Reliability Statistics
Cronbach's
Alpha
N of Items
.897 6
Item Statistics
Mean Std. Deviation N
X1_1 3.65 .894 96
X1_2 3.64 .822 96
X1_3 3.71 .710 96
X1_4 3.77 .900 96
X1_5 3.63 .909 96
Item-Total Statistics
Scale Mean if
Item Deleted
Scale Variance
if Item Deleted
Corrected
Item-Total
Correlation
Cronbach's
Alpha if Item
Deleted
X1_1 18.45 12.776 .752 .874
X1_2 18.46 13.493 .697 .882
X1_3 18.39 14.134 .702 .884
X1_4 18.32 12.768 .747 .875
X1_5 18.47 13.304 .641 .891
UJI VALIDITAS DAN RELIABILITAS VARIABEL PROSEDUR PELAYANAN
Case Processing Summary
N %
Cases
Valid 96 100.0
Excludeda 0 .0
Total 96 100.0
a. Listwise deletion based on all variables in the
procedure.
Reliability Statistics
Cronbach's
Alpha
N of Items
.941 8
Item Statistics
Mean Std. Deviation N
X2_1 3.73 .900 96
X2_2 3.78 .897 96
X2_3 3.92 1.073 96
X2_4 3.89 1.065 96
X2_5 3.86 1.111 96
X2_6 3.63 .886 96
X2_7 3.82 .846 96
Item-Total Statistics
Scale Mean if
Item Deleted
Scale Variance
if Item Deleted
Corrected
Item-Total
Correlation
Cronbach's
Alpha if Item
Deleted
X2_1 26.82 33.621 .727 .937
X2_2 26.77 33.021 .795 .932
X2_3 26.64 30.508 .874 .926
X2_4 26.67 30.456 .887 .925
X2_5 26.69 30.280 .859 .928
X2_6 26.93 34.005 .700 .938
X2_7 26.73 33.652 .779 .934
UJI VALIDITAS DAN RELIABILITAS VARIABEL KEPUASAN MASYARAKAT
Case Processing Summary
N %
Cases
Valid 96 100.0
Excludeda 0 .0
Total 96 100.0
a. Listwise deletion based on all variables in the
procedure.
Reliability Statistics
Cronbach's
Alpha
N of Items
.854 3
Item Statistics
Mean Std. Deviation N
Y_1 3.65 .794 96
Y_2 3.70 .742 96
Item-Total Statistics
Scale Mean if
Item Deleted
Scale Variance
if Item Deleted
Corrected
Item-Total
Correlation
Cronbach's
Alpha if Item
Deleted
Y_1 7.49 2.316 .641 .872
Y_2 7.44 2.207 .790 .743
One-Sample Kolmogorov-Smirnov Test
Unstandardized
Residual
N 96
Normal Parametersa,b
Mean 0E-7
Std. Deviation 1.08988773
Most Extreme Differences
Absolute .122
Positive .039
Negative -.122
Kolmogorov-Smirnov Z 1.199
Asymp. Sig. (2-tailed) .113
a. Test distribution is Normal.
Descriptive Statistics
Mean Std. Deviation N
Kepuasan Masyarakat (Y) 11.14 2.121 96
Mutu Pelayanan (X1) 22.09 4.287 96
Prosedur Pelayanan (X2) 30.55 6.482 96
Model Collinearity Statistics
Tolerance VIF
1
(Constant)
Mutu Pelayanan (X1) .503 1.990
Prosedur Pelayanan (X2) .503 1.990
Descriptive Statistics
Mean Std. Deviation N
Kepuasan Masyarakat (Y) 11.14 2.121 96
Mutu Pelayanan (X1) 22.09 4.287 96
Model Summaryb
Model R R Square Adjusted R
Square
Std. Error of the
Estimate
Durbin-Watson
1 .858a .736 .730 1.102 1.619
a. Predictors: (Constant), Prosedur Pelayanan (X2), Mutu Pelayanan (X1)
Descriptive Statistics
Mean Std. Deviation N
Kepuasan Masyarakat (Y) 11.14 2.121 96
Mutu Pelayanan (X1) 22.09 4.287 96
Prosedur Pelayanan (X2) 30.55 6.482 96
Variables Entered/Removeda
Model Variables Entered Variables
Removed
Method
1 Prosedur Pelayanan (X2), Mutu
Pelayanan (X1)b . Enter
a. Dependent Variable: Kepuasan Masyarakat (Y)
b. All requested variables entered.
Model Summaryb
Model R R Square Adjusted R
Square
Std. Error of the
Estimate
1 .858a .736 .730 1.102
a. Predictors: (Constant), Prosedur Pelayanan (X2), Mutu Pelayanan
(X1)
ANOVAa
Model Sum of Squares df Mean Square F Sig.
1
Regression 314.393 2 157.197 129.551 .000b
Residual 112.846 93 1.213
Total 427.240 95
a. Dependent Variable: Kepuasan Masyarakat (Y)
b. Predictors: (Constant), Prosedur Pelayanan (X2), Mutu Pelayanan (X1)
Coefficientsa
Model Unstandardized
Coefficients
Standardized
Coefficients
t Sig.
B Std. Error Beta
1
(Constant) 1.433 .618 2.321 .022
Mutu Pelayanan (X1) .221 .037 .448 5.953 .000
Prosedur Pelayanan (X2) .157 .025 .481 6.403 .000
Cuplikan Tabel Distribusi t
0
No
10%
5%
2,5%
1
3.078
6.314
12.706
2
1.886
2.920
4.303
3
1.638
2.353
3.182
4
1.533
2.132
2.776
5
1.476
2.015
2.571
6
1.440
1.943
2.447
7
1.415
1.895
2.365
8
1.397
1.860
2.306
9
1.383
1.833
2.262
10
1.372
1.812
2.228
11
1.363
1.796
2.201
12
1.356
1.782
2.179
13
1.350
1.771
2.160
14
1.345
1.761
2.145
15
1.341
1.753
2.131
16
1.337
1.746
2.120
17
1.333
1.740
2.110
18
1.330
1.734
2.101
19
1.328
1.729
2.093
20
1.325
1.725
2.086
21
1.323
1.721
2.080
22
1.321
1.717
2.074
23
1.319
1.714
2.069
24
1.318
1.711
2.064
25
1.316
1.708
2.060
26
1.315
1.706
2.056
27
1.314
1.703
2.052
28
1.313
1.701
2.048
29
1.311
1.699
2.045
30
1.310
1.697
2.042
31
1.309
1.696
2.040
32
1.309
1.694
2.037
33
1.308
1.692
2.035
34
1.307
1.691
2.032
35
1.306
1.690
2.030
37
1.305
1.687
2.026
38
1.304
1.686
2.024
39
1.304
1.685
2.023
40
1.303
1.684
2.021
41
1.303
1.683
2.020
42
1.302
1.682
2.018
43
1.302
1.681
2.017
44
1.301
1.680
2.015
45
1.301
1.679
2.014
46
1.300
1.679
2.013
47
1.300
1.678
2.012
48
1.299
1.677
2.011
49
1.299
1.677
2.010
50
1.299
1.676
2.009
51
1.298
1.675
2.008
52
1.298
1.675
2.007
53
1.298
1.674
2.006
54
1.297
1.674
2.005
55
1.297
1.673
2.004
56
1.297
1.673
2.003
57
1.297
1.672
2.002
58
1.296
1.672
2.002
59
1.296
1.671
2.001
60
1.296
1.671
2.000
61
1.296
1.670
2.000
62
1.295
1.670
1.999
63
1.295
1.669
1.998
64
1.295
1.669
1.998
65
1.295
1.669
1.997
66
1.295
1.668
1.997
67
1.294
1.668
1.996
68
1.294
1.668
1.995
69
1.294
1.667
1.995
70
1.294
1.667
1.994
71
1.294
1.667
1.994
72
1.293
1.666
1.993
73
1.293
1.666
1.993
74
1.293
1.666
1.993
75
1.293
1.665
1.992
76
1.293
1.665
1.992
77
1.293
1.665
1.991
78
1.292
1.665
1.991
79
1.292
1.664
1.990
80
1.292
1.664
1.990
81
1.292
1.664
1.990
82
1.292
1.664
1.989
83
1.292
1.663
1.989
85
1.292
1.663
1.988
86
1.291
1.663
1.988
87
1.291
1.663
1.988
88
1.291
1.662
1.987
89
1.291
1.662
1.987
90
1.291
1.662
1.987
91
1.291
1.662
1.986
92
1.291
1.662
1.986
93
1.291
1.661
1.986
94
1.291
1.661
1.986
95
1.291
1.661
1.985
96
1.290
1.661
1.985
97
1.290
1.661
1.985
98
1.290
1.661
1.984
99
1.290
1.660
1.984
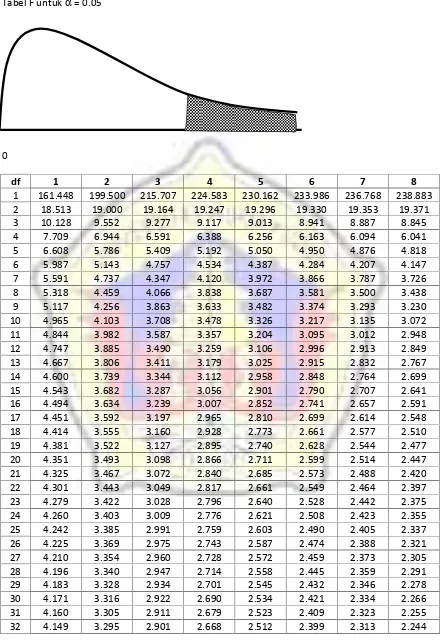
Tabel F untuk
= 0.05
0
df
1
2
3
4
5
6
7
8
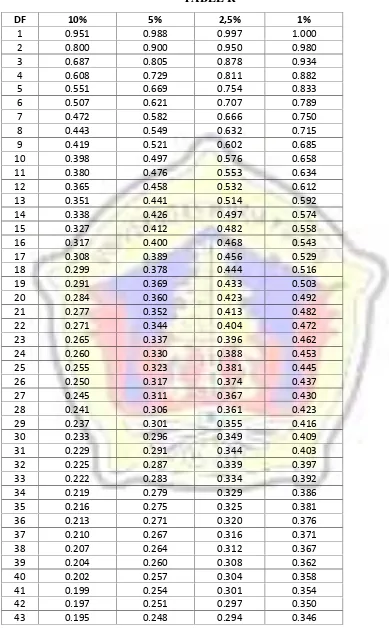
TABEL R
DF
10%
5%
2,5%
1%
1
0.951
0.988
0.997
1.000
2
0.800
0.900
0.950
0.980
3
0.687
0.805
0.878
0.934
4
0.608
0.729
0.811
0.882
5
0.551
0.669
0.754
0.833
6
0.507
0.621
0.707
0.789
7
0.472
0.582
0.666
0.750
8
0.443
0.549
0.632
0.715
9
0.419
0.521
0.602
0.685
10
0.398
0.497
0.576
0.658
11
0.380
0.476
0.553
0.634
12
0.365
0.458
0.532
0.612
13
0.351
0.441
0.514
0.592
14
0.338
0.426
0.497
0.574
15
0.327
0.412
0.482
0.558
16
0.317
0.400
0.468
0.543
17
0.308
0.389
0.456
0.529
18
0.299
0.378
0.444
0.516
19
0.291
0.369
0.433
0.503
20
0.284
0.360
0.423
0.492
21
0.277
0.352
0.413
0.482
22
0.271
0.344
0.404
0.472
23
0.265
0.337
0.396
0.462
24
0.260
0.330
0.388
0.453
25
0.255
0.323
0.381
0.445
26
0.250
0.317
0.374
0.437
27
0.245
0.311
0.367
0.430
28
0.241
0.306
0.361
0.423
29
0.237
0.301
0.355
0.416
30
0.233
0.296
0.349
0.409
31
0.229
0.291
0.344
0.403
32
0.225
0.287
0.339
0.397
33
0.222
0.283
0.334
0.392
34
0.219
0.279
0.329
0.386
35
0.216
0.275
0.325
0.381
36
0.213
0.271
0.320
0.376
37
0.210
0.267
0.316
0.371
38
0.207
0.264
0.312
0.367
39
0.204
0.260
0.308
0.362
40
0.202
0.257
0.304
0.358
41
0.199
0.254
0.301
0.354
42
0.197
0.251
0.297
0.350
44
0.192
0.246
0.291
0.342
45
0.190
0.243
0.288
0.338
46
0.188
0.240
0.285
0.335
47
0.186
0.238
0.282
0.331
48
0.184
0.235
0.279
0.328
49
0.182
0.233
0.276
0.325
50
0.181
0.231
0.273
0.322
51
0.179
0.228
0.271
0.319
52
0.177
0.226
0.268
0.316
53
0.175
0.224
0.266
0.313
54
0.174
0.222
0.263
0.310
55
0.172
0.220
0.261
0.307
56
0.171
0.218
0.259
0.305
57
0.169
0.216
0.256
0.302
58
0.168
0.214
0.254
0.300
59
0.166
0.213
0.252
0.297
60
0.165
0.211
0.250
0.295
61
0.164
0.209
0.248
0.293
62
0.162
0.207
0.246
0.290
63
0.161
0.206
0.244
0.288
64
0.160
0.204
0.242
0.286
65
0.159
0.203
0.240
0.284
66
0.157
0.201
0.239
0.282
67
0.156
0.200
0.237
0.280
68
0.155
0.198
0.235
0.278
69
0.154
0.197
0.234
0.276
70
0.153
0.195
0.232
0.274
71
0.152
0.194
0.230
0.272
72
0.151
0.193
0.229
0.270
73
0.150
0.191
0.227
0.268
74
0.149
0.190
0.226
0.266
75
0.148
0.189
0.224
0.265
76
0.147
0.188
0.223
0.263
77
0.146
0.186
0.221
0.261
78
0.145
0.185
0.220
0.260
79
0.144
0.184
0.219
0.258
80
0.143
0.183
0.217
0.257
81
0.142
0.182
0.216
0.255
82
0.141
0.181
0.215
0.253
83
0.140
0.180
0.213
0.252
84
0.140
0.179
0.212
0.251
85
0.139
0.178
0.211
0.249
86
0.138
0.176
0.210
0.248
87
0.137
0.175
0.208
0.246
88
0.136
0.174
0.207
0.245
90
0.135
0.173
0.205
0.242
91
0.134
0.172
0.204
0.241
92
0.133
0.171
0.203
0.240
93
0.133
0.170
0.202
0.238
94
0.132
0.169
0.201
0.237
95
0.131
0.168
0.200
0.236
96
0.131
0.167
0.199
0.235
97
0.130
0.166
0.198
0.234
98
0.129
0.165
0.197
0.232
99
0.129
0.165
0.196
0.231
Frekuensi Identitas Responden
Statistics
jenis kelamin Usia Pekerjaan Pendidikan
N
Valid 96 96 96 96
Missing 0 0 0 0
Frequency Table
jenis kelamin
Frequency Percent Valid Percent Cumulative
Percent
Valid
perempuan 40 41.7 41.7 41.7
Laki-laki 56 58.3 58.3 100.0
Total 96 100.0 100.0
Usia
Frequency Percent Valid Percent Cumulative
Percent
Valid
20-25 tahun 20 20.8 20.8 20.8
26-30 tahun 32 33.3 33.3 54.2
31-40 tahun 18 18.8 18.8 72.9
di atas 40 tahun 26 27.1 27.1 100.0
Pekerjaan
Frequency Percent Valid Percent Cumulative
Percent
Valid
Lain-Lain 24 25.0 25.0 25.0
Karyawan Swasta 33 34.4 34.4 59.4
Wiraswasta/Pedagang 21 21.9 21.9 81.3
Pegawai Negeri 18 18.8 18.8 100.0
Total 96 100.0 100.0
Pendidikan
Frequency Percent Valid Percent Cumulative
Percent
Valid
SMP 17 17.7 17.7 17.7
SMU 31 32.3 32.3 50.0
Diploma-III 11 11.5 11.5 61.5
S1 37 38.5 38.5 100.0
Frekuensi Mutu Pelayanan
Statistics
N Mean Median Mode Sum
Valid Missing
X1_1 96 0 3.65 4.00 4 350
X1_2 96 0 3.64 4.00 4 349
X1_3 96 0 3.71 4.00 4 356
X1_4 96 0 3.77 4.00 4 362
X1_5 96 0 3.63 4.00 4 348
X1_6 96 0 3.71 4.00 4 356
Mutu Pelayanan (X1) 96 0 22.09 23.00 24 2121
Frequency Table
X1_1
Frequency Percent Valid Percent Cumulative
Percent
Valid
1 1 1.0 1.0 1.0
2 12 12.5 12.5 13.5
3 19 19.8 19.8 33.3
4 52 54.2 54.2 87.5
5 12 12.5 12.5 100.0
X1_2
Frequency Percent Valid Percent Cumulative
Percent
Valid
1 1 1.0 1.0 1.0
2 9 9.4 9.4 10.4
3 23 24.0 24.0 34.4
4 54 56.3 56.3 90.6
5 9 9.4 9.4 100.0
Total 96 100.0 100.0
X1_3
Frequency Percent Valid Percent Cumulative
Percent
Valid
1 1 1.0 1.0 1.0
2 2 2.1 2.1 3.1
3 30 31.3 31.3 34.4
4 54 56.3 56.3 90.6
5 9 9.4 9.4 100.0
X1_4
Frequency Percent Valid Percent Cumulative
Percent
Valid
1 3 3.1 3.1 3.1
2 2 2.1 2.1 5.2
3 28 29.2 29.2 34.4
4 44 45.8 45.8 80.2
5 19 19.8 19.8 100.0
Total 96 100.0 100.0
X1_5
Frequency Percent Valid Percent Cumulative
Percent
Valid
1 2 2.1 2.1 2.1
2 11 11.5 11.5 13.5
3 19 19.8 19.8 33.3
4 53 55.2 55.2 88.5
5 11 11.5 11.5 100.0
X1_6
Frequency Percent Valid Percent Cumulative
Percent
Valid
1 2 2.1 2.1 2.1
2 11 11.5 11.5 13.5
3 22 22.9 22.9 36.5
4 39 40.6 40.6 77.1
5 22 22.9 22.9 100.0
Total 96 100.0 100.0
Mutu Pelayanan (X1)
Frequency Percent Valid Percent Cumulative
Percent
Valid
10 1 1.0 1.0 1.0
12 1 1.0 1.0 2.1
14 5 5.2 5.2 7.3
15 1 1.0 1.0 8.3
16 2 2.1 2.1 10.4
17 4 4.2 4.2 14.6
18 10 10.4 10.4 25.0
19 1 1.0 1.0 26.0
20 8 8.3 8.3 34.4
22 6 6.3 6.3 47.9
23 5 5.2 5.2 53.1
24 15 15.6 15.6 68.8
25 2 2.1 2.1 70.8
26 11 11.5 11.5 82.3
27 13 13.5 13.5 95.8
28 2 2.1 2.1 97.9
29 2 2.1 2.1 100.0
Frekuensi Prosedur Pelayanan
Statistics
N Mean Median Mode Sum
Valid Missing
X2_1 96 0 3.73 4.00 4 358
X2_2 96 0 3.78 4.00 4 363
X2_3 96 0 3.92 4.00 5 376
X2_4 96 0 3.89 4.00 4 373
X2_5 96 0 3.86 4.00 4 371
X2_6 96 0 3.63 4.00 4 348
X2_7 96 0 3.82 4.00 4 367
X2_8 96 0 3.93 4.00 4 377
Prosedur Pelayanan (X2) 96 0 30.55 32.00 34 2933
Frequency Table
X2_1
Frequency Percent Valid Percent Cumulative
Percent
Valid
1 1 1.0 1.0 1.0
2 9 9.4 9.4 10.4
3 22 22.9 22.9 33.3
4 47 49.0 49.0 82.3
5 17 17.7 17.7 100.0
X2_2
Frequency Percent Valid Percent Cumulative
Percent
Valid
1 1 1.0 1.0 1.0
2 6 6.3 6.3 7.3
3 27 28.1 28.1 35.4
4 41 42.7 42.7 78.1
5 21 21.9 21.9 100.0
Total 96 100.0 100.0
X2_3
Frequency Percent Valid Percent Cumulative
Percent
Valid
1 4 4.2 4.2 4.2
2 5 5.2 5.2 9.4
3 20 20.8 20.8 30.2
4 33 34.4 34.4 64.6
5 34 35.4 35.4 100.0
X2_4
Frequency Percent Valid Percent Cumulative
Percent
Valid
1 4 4.2 4.2 4.2
2 7 7.3 7.3 11.5
3 15 15.6 15.6 27.1
4 40 41.7 41.7 68.8
5 30 31.3 31.3 100.0
Total 96 100.0 100.0
X2_5
Frequency Percent Valid Percent Cumulative
Percent
Valid
1 7 7.3 7.3 7.3
2 3 3.1 3.1 10.4
3 15 15.6 15.6 26.0
4 42 43.8 43.8 69.8
5 29 30.2 30.2 100.0
X2_6
Frequency Percent Valid Percent Cumulative
Percent
Valid
1 1 1.0 1.0 1.0
2 11 11.5 11.5 12.5
3 23 24.0 24.0 36.5
4 49 51.0 51.0 87.5
5 12 12.5 12.5 100.0
Total 96 100.0 100.0
X2_7
Frequency Percent Valid Percent Cumulative
Percent
Valid
1 1 1.0 1.0 1.0
2 4 4.2 4.2 5.2
3 26 27.1 27.1 32.3
4 45 46.9 46.9 79.2
5 20 20.8 20.8 100.0
X2_8
Frequency Percent Valid Percent Cumulative
Percent
Valid
1 3 3.1 3.1 3.1
2 2 2.1 2.1 5.2
3 18 18.8 18.8 24.0
4 49 51.0 51.0 75.0
5 24 25.0 25.0 100.0
Total 96 100.0 100.0
Prosedur Pelayanan (X2)
Frequency Percent Valid Percent Cumulative
Percent
Valid
15 3 3.1 3.1 3.1
16 1 1.0 1.0 4.2
18 2 2.1 2.1 6.3
19 2 2.1 2.1 8.3
20 3 3.1 3.1 11.5
21 1 1.0 1.0 12.5
22 2 2.1 2.1 14.6
23 2 2.1 2.1 16.7
24 3 3.1 3.1 19.8
26 4 4.2 4.2 25.0
27 1 1.0 1.0 26.0
28 6 6.3 6.3 32.3
29 3 3.1 3.1 35.4
30 5 5.2 5.2 40.6
31 8 8.3 8.3 49.0
32 4 4.2 4.2 53.1
33 4 4.2 4.2 57.3
34 10 10.4 10.4 67.7
35 5 5.2 5.2 72.9
36 7 7.3 7.3 80.2
37 9 9.4 9.4 89.6
38 4 4.2 4.2 93.8
39 6 6.3 6.3 100.0
Frekuensi Kepuasan Masyarakat
Statistics
Y_1 Y_2 Y_3 Kepuasan
Masyarakat (Y)
N
Valid 96 96 96 96
Missing 0 0 0 0
Mean 3.65 3.70 3.79 11.14
Median 4.00 4.00 4.00 12.00
Mode 4 4 4 12
Sum 350 355 364 1069
Frequency Table
Y_1
Frequency Percent Valid Percent Cumulative
Percent
Valid
1 3 3.1 3.1 3.1
2 7 7.3 7.3 10.4
3 14 14.6 14.6 25.0
4 69 71.9 71.9 96.9
5 3 3.1 3.1 100.0
Y_2
Frequency Percent Valid Percent Cumulative
Percent
Valid
1 1 1.0 1.0 1.0
2 7 7.3 7.3 8.3
3 18 18.8 18.8 27.1
4 64 66.7 66.7 93.8
5 6 6.3 6.3 100.0
Total 96 100.0 100.0
Y_3
Frequency Percent Valid Percent Cumulative
Percent
Valid
1 1 1.0 1.0 1.0
2 5 5.2 5.2 6.3
3 27 28.1 28.1 34.4
4 43 44.8 44.8 79.2
5 20 20.8 20.8 100.0
Kepuasan Masyarakat (Y)
Frequency Percent Valid Percent Cumulative
Percent
Valid
4 1 1.0 1.0 1.0
6 4 4.2 4.2 5.2
7 3 3.1 3.1 8.3
8 6 6.3 6.3 14.6
9 2 2.1 2.1 16.7
10 11 11.5 11.5 28.1
11 13 13.5 13.5 41.7
12 35 36.5 36.5 78.1
13 13 13.5 13.5 91.7
14 8 8.3 8.3 100.0