39
This chapter is going to discuss approach of the study, type of the study, population and sample, data collecting procedure, research instrument, instrument validity, index of difficulty, and data analysis procedure.
A. Approach and Type of the Study
a. Approach of the Study
The approach of the study is quantitative approach which quantitative approach is the systematic scientific investigation of quantitative properties and phenomena and their relationships. According to Donald Ary and Chris Sorensen stated Quantitave research is a generic term for inquiry employing operational definitions to generate numeric data to answer predetermined hypothesis or questions.55
b. Type of the Study
The study used content analysis. Content analysis is a research method applied to written or visual materials for the purpose of identifying specified characteristics of the material. The study wants to describe the type of error in grammatical errors in using direct in direct speech.
According to Ary Donald, Content analysis is widely used in education. The following are some of the purposes of content analysis in educational research: 1. To identify bias, prejudice, or propaganda in textbooks.
2. To analyze types of errors in students’ writings.
55
3. To describe prevailing practices.
4. To discover the level of difficulty of material in textbooks or other publications.
5. To discover the relative importance of, or interest in, certain topics.
Content analyses may be done in an emergent designframework, or they may be done in a quantitative research framework with variables that are specified a priori and numbers that are generated to enable the researcher to draw conclusions about these specified variables.56
B. Population and Sample
1. Population
Population is the larger of groups to which a researcher wishes to generalize it includes all members of a defined class of people, events, or object.57
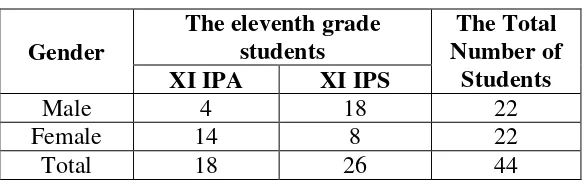
The population of the study would be the entire eleventh grade of MA Darul Ulum Palangka Raya. The writer would take all the population because the subject of this study was the eleventh grade of MA Darul Ulum Palangka Raya. It would make completely in this research. The total numbers of the students were 45 students; it is divided into two classes, as shown in the following table.
56
Ibid. p. 457-458
57
Table 3.1 population research. Then, if the subjects are more than 100, it can be taken 10-15% or 20-25% of total population.58 answer the problems of the study. To collected data, the writer was uses some techniques. The procedures of collecting the data are as follows:
a. Preparing the instruments
b. Giving the test items to the students
c. Determining the allocation of time that is 2 x 40 minutes.
58
d. Collecting and scoring the student’s job. e. Analyzing errors.
D. Research Instrument
In collected the data, the writer had chosen two instruments, they were writing test and documentation. Both of them had for the students. Those were: 1. Test
Arikunto states that the test is some questions or exercises which are used to measure the mastery which is owned by individual or group.59 The writer hopes by using this instrument, the writer wants easy to get the data of the grammatical errors in using direct in direct speech. In this study, it wants used written test. In this case, the writer orders the students to change direct in direct speech in Indonesia
Language to direct in direct speech in English Language. The test would be constructed
in 30 items. It is consisted of two tenses. There are simple present tense and simple past
tense. Each tense consists of 15 items. In this case, the test is to get the main data. It is
to know the students’ errors in using direct n direct speech. Then, analyse them from the
students’ scores that they got by using error analysis. According toGrolund, In this study the writer wants used content validation. Content validation typically takes place during test development. It is primarily a matter of preparing detailed test specification and then constructing a test that meets these specifications.60 2. Documentation
Documentation is every written material or film. Documentation technique used to find out and look for the documents related to the study. This technique
59
Suharsimi Arikunto, Prosedur Penelitian Suatu Pendekatan Praktek, Edisi V, Jakarta: Rineka Cipta, 2002, p 139.
60
wants use as supported technique in order to get the data of the study such as the number and names of the students of second grade of MA Darul Ulum Palangka Raya.
E. Data Analysis Procedures
Based on Ellis “statement above, the writer had analyzed the data as follows61 :
1. Collecting the data. 2. Identification of Errors
After the data collected, the writer identifies the errors in the students’ answer sheets if there are any differences between answer and the target language. The writer collects all grammatical errors, and then groups them into the types of grammatical errors related to the rules past tense.
3. Description of Error Analysis
The writer can describe and classifies into types of the grammatical errors categories based on Heidy Dulay’s grammatical errors.
4. Explanation of Errors
The writer revised the error in the grammatical errors in using sentences of past tense by using reconstruction and determining the causes of the errors according to dulay, Burt, and krashen as follows;
a. Interlingual errors b. Intralingual errors. 5. Evaluation of Errors
61
Related to the grammatical errors made by the students, the factors of causing the errors can be interpreted. The causes of errors can be analyzed based on the errors which are classified in each type of grammatical errors before.
6. In analyses the errors frequency to get the percentage of errors, the writer uses formula as follows :
Where : P : percentage F : Frequency
N : The total of errors 100% : constant Multiplier
To analyses the data of the research finding, the writer will use descriptive statistic. There were some procedures which take to analyses the data of errors, they are :
a. Scoring
In this case the writer scored the students answer. So that the writer was used the formulation, as follows :
Where : S : score
B : Number of correct item N : total number of test item
b. Arrange the students score in the table.
c. Scoring the average scores of the test, it used the formulation as follows : P = F x 100%
where :
m = mean (average)
∑ = sum of the scores
F = frequency of the score X = scores
N = number of subject
d. Calculating the percentage of frequency it uses the formulation, as follows :
Where : P : percentage F : Frequency
N : The total of errors 100% : constant Multiplier 62
62
Sudijono, pengantar statistik pendidikan, jakarta : raja grafindo persada. 2005. P.43