CORRECTION OF ATMOSPHERIC HAZE IN RESOURCESAT-1 LISS-4 MX DATA FOR
URBAN ANALYSIS: AN IMPROVED DARK OBJECT SUBTRACTION APPROACH
Sk. Mustak
Research Scholar (Ph.D.), School of Studies in Geography Pt. Ravishankar Shukla University, Raipur, Chhattisgarh, India,
KEY WORDS: Atmospheric Haze, Multispectral, Dark Object, Urban Analysis.
ABSTRACT:
The correction of atmospheric effects is very essential because visible bands of shorter wavelength are highly affected by atmospheric scattering especially of Rayleigh scattering. The objectives of the paper is to find out the haze values present in the all spectral bands and to correct the haze values for urban analysis. In this paper, Improved Dark Object Subtraction method of P. Chavez (1988) is applied for the correction of atmospheric haze in the Resoucesat-1 LISS-4 multispectral satellite image. Dark object Subtraction is a very simple image-based method of atmospheric haze which assumes that there are at least a few pixels within an image which should be black (% reflectance) and such black reflectance termed as dark object which are clear water body and shadows whose DN values zero (0) or Close to zero in the image. Simple Dark Object Subtraction method is a first order atmospheric correction but Improved Dark Object Subtraction method which tends to correct the Haze in terms of atmospheric scattering and path radiance based on the power law of relative scattering effect of atmosphere. The haze values extracted using Simple Dark Object Subtraction method for Green band (Band2), Red band (Band3) and NIR band (band4) are 40, 34 and 18 but the haze values extracted using Improved Dark Object Subtraction method are 40, 18.02 and 11.80 for aforesaid bands. Here it is concluded that the haze values extracted by Improved Dark Object Subtraction method provides more realistic results than Simple Dark Object Subtraction method.
1 INTRODUCTION
The remotely sensed data is widely used in natural resource management and planning. The correction of atmospheric effects is very essential because visible bands of shorter wavelength are highly affected by atmospheric scattering especially of Rayleigh scattering which is caused by suspended gases, water vapour and aerosols. The atmospheric effects mostly found in the polluted urban area in the great extent, in this regards Raipur City is not exceptional. In this paper, Improved Dark Object Subtraction method of P. Chavez (1988) is applied for the correction of atmospheric haze in the high resolution (GSD 5.8 m) Resoucesat-1 LISS-4 multispectral satellite for Urban Land use mapping and Change Detection analysis. Dark object Subtraction is a very simple image-based method of atmospheric haze which assumes that there are at least a few pixels within an image which should be black (% reflectance) and such black reflectance termed as dark object which are clear water body and shadows whose DN values zero (0) or Close to zero in the image. Simple Dark Object Subtraction method is a first order atmospheric correction which is better than no-correction at all. In this method, constant haze value (DN) of each individual spectral bands are selected using minimum DN value in the histogram from the entire scene is attributed to the effect of the atmosphere and is subtracted from each spectral bands. But Improved Dark Object Subtraction method which tends to correct the Haze in terms of atmospheric scattering and path radiance based on the power law of relative scattering effect of atmosphere. In this method, Starting haze Value is selected from constant haze value of shorter wavelength band and then calculated the predicted haze values for next another spectral band based on the principles of power low
function of relative scattering effects of atmosphere. Finally, all predicted haze values should be adjusted with sensor calibration gain and offset parameters to get the realistic result. Here it is concluded that the haze values extracted by Improved Dark Object Subtraction method provides more realistic results than Simple Dark Object Subtraction method. If the Simple Dark Object Subtraction method is applied for the correction of atmospheric haze effects from the image then there shall be chances of overcorrection of pixel values. Therefore, haze values extracted by Improved Dark Object Subtraction method are subtracted from each spectral band using condition programme in modeler tool of Erdas imagine image processing software.
2 OBJECTIVES
The study is based on following objectives-
1. To find out the haze values present in the all spectral bands of the image.
2. To correct the haze values from the image using Improve Dark Object Subtraction method to get quality result.
3 STUDY AREA
occupies the north-western part of Raipur district and located in average rainfall of 1400 mm. The atmospheric conditions during satellite data acquisition was very clear. The city is a fast developing important industrial centre and well connected with various major cities of India by road, rail and air transporting systems. The Raipur city is situated along the Mumbai-Nagpur-Hawrah mainline.
4 DATABASE
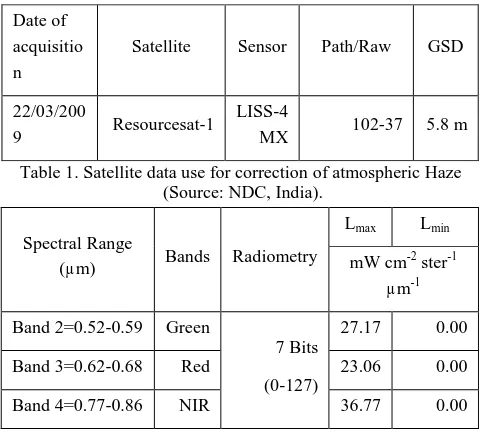
The study is based on primary data as Resourcesat-1 LISS-4 multispectral high resolution satellite image which is collected from the National Data Centre (NDC), National Remote Sensing Centre (NRSC), Indian Space Research Organization (ISRO), Balanagar, Hyderabad, Andra Pradesh, India. The climatic data is collected from Indira Gandhi Agricultural University, Raipur, Chhattisgarh, India. The study of climatic data is used to find out the climatic conditions during satellite data acquisition and is suggested that the study area was very clear atmospheric conditions during satellite data acquisition. The details of satellite data are given in Table 1&2 and Figure 1.
Table 1. Satellite data use for correction of atmospheric Haze (Source: NDC, India).
Table 2. Radiometric details of Satellite data use for correction of atmospheric Haze (Source: NDC, India).
5 METHODOLOGY
Dark object Subtraction is a very simple image-based method of atmospheric correction which assumes that there are at least a few pixels within an image which should be black (% reflectance) and such black reflectance termed as dark object which are clear water body and shadows whose DN values zero (0) or Close to zero in the image (Chavez, 1988). This method is widely used for
classification and change detection application (Spanner et al., 1990). Simple Dark Object Subtraction (SDOS) method is a first order atmospheric correction which is better than no-correction at all (Chavez, 1988). In this method, constant haze value (DN) of each individual spectral bands are selected using minimum DN value in the histogram from the entire scene is thus attributed to the effect of the atmosphere and is subtracted from each spectral bands (Chavez, 1989). Improved Dark Object Subtraction (IDOS) method which tends to correct the Haze in terms of atmospheric scattering and path radiance based on the power law of relative scattering effect of atmosphere (Lillesand and Kiefer, 2000). The Improved Dark Object Subtraction (IDOS) method is the improvement over the Simple Dark Object Subtraction (SDOS) method to minimize the chances of overcorrection of pixel value (DN) in the scene. used to select the Starting Haze Value as 40 (Table 3).
Table 3. Selection of Haze Values using Histogram Method.
5.2. Relative Scattering Model (RSM)
This model is based on two important relative scattering models as Rayleigh (particle size less than wavelength) and Mie Scattering (particle size same as wavelength) models (Slater et.al., 1983). These two models are based on power law as for Rayleigh scattering effects of atmosphere which acts with the wavelength in imaging systems as inversely proportional to the fourth power of wavelength (λ-4) which means that shorter wavelength of the
spectrum are scatter much more than longer wavelengths. This type of scattering is caused by gas molecules which are much smaller than the wavelength of light. The Mie Scattering effects of atmosphere which acts with the wavelength in imaging systems as inversely proportional to the wavelength which vary from λ-0
to λ-4
, and λ-1 for moderate atmosphere and λ-0 for completely cloud cover. But the relative scattering that usually occurs in a real atmosphere is clearly seems to follow more of a λ-2 toλ-0.4 relationship and not a Rayleigh or Mie (Curcio, 1961; Slater et al., 1983). Using this information, the relative scattering that occurs
in a hazy atmosphere can be approximated as λ-0.7 to λ-0.5
atmospheres, one possible set of relative scattering models are(Chavez, 1988):
Table 4. Principle of Relative Scattering Models of Atmospheric effects (Source: Chavez, 1988).
Table 5. Principle of Relative Scattering Models as percent (%) contributed for each spectral band.
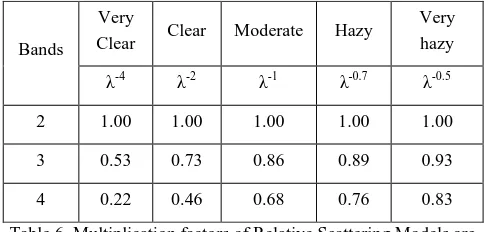
The principles of Relative Scattering Model are used to Predict Haze Values (PHV) for each spectral band based on Starting Haze Value in the specific atmospheric condition. The study area was belonging to very clear atmospheric conditions during satellite data acquisition and hence the correction of atmospheric haze based on the principle of very Clear relative scattering models. The computation of Predicted Haze Values for different spectral bands has been calculated from Starting Haze Value (SHV) of selected band based on the Normalized value of relative scattering models as termed as multiplicative factors showing in following Table 6.
Table 6. Multiplication factors of Relative Scattering Models are used to Predict Haze Values for other
bands and Band 2 is selected as SHV is 40.
The Predicted Haze Value for different spectral bands is computed based on following formula as:
Predicted Haze Values (DN) =IPHV1 of band
i* Multiplicative Factors of next bands. (1)
Where,
1
Initial Predicted Haze Value (IPHV) is calculated by subtracting the SHV from Offset Value, the gain and offset value showing in Table 7.
In this paper, the Starting Haze Value is 40 for band 2 and the Initial Predicted Haze Value is 40 (SHV- 0) for this band but the Predicted Haze Values for next spectral bands such as for band 3 is 21.20 (40*0.53) and band 4 is 8.80 (40*0.22) showing in Table 8.
The haze values computed using relative scattering models are not the correct haze values to remove the haze effects from the image. To compute the correct or Final Predicted Haze Values (FPHV), the different gain (Lmax) and offset (Lmin) values in the imaging
systems has to be adjusted with Predicted Haze Values by means of the addition of offset value and multiplication of normalized gain values. The calculation of normalized gain values along with the offset values are showing in Table 7.
Atmospheric Conditions Relative Scattering Model (RSM)
Very clear λ-4
Clear λ-2
Moderate λ-1
Hazy λ-0.7
Very hazy λ-0.5
Bands λaverage Very Clear Clear Moderate Hazy Very hazy
λ-4
% λ-2 % λ-1 % λ-0.7 % λ-0.5 %
2 0.555 10.54 56.82 3.25 43.28 1.80 34.68 1.51 31.99 1.34 29.98
3 0.650 5.60 30.19 2.37 31.55 1.54 29.67 1.35 28.60 1.24 27.74
4 0.815 2.27 12.24 1.51 20.11 1.23 23.70 1.15 24.37 1.11 24.83
Total - 18.55 100 7.51 100 5.19 100 4.72 100 4.47 100
Bands
Very
Clear Clear Moderate Hazy
Very hazy
λ-4 λ-2 λ-1 λ-0.7 λ-0.5
2 1.00 1.00 1.00 1.00 1.00
3 0.53 0.73 0.86 0.89 0.93
Table 7. Gain, Offset, and Gain Normalization factors.
The calculation of Final Predicted Haze Values (FPHV) is done using following formula:
Final Predicted Haze Value (DN) =NORi*Predicted Haze Value+Offset (2)
The Final Predicted Haze Values (FPHV) along with the haze values of individual bands and Predicted Haze Value (PHV) are showing in table-8. The Final Predicted Haze Values (FPHV) is subtracted from each spectral bands and then whole haze corrected bands of satellite image are stacked to prepare a False Color Composite Image (Figure 2.) in Erdas Imagine modeler. The whole work of atmospheric correction is done in Erdas Imagine 9.2 version.
6 RESULTS
The Haze Values (HV) selected by histogram method for Green band (Band2) , Red band (Band3) and NIR band (band4) are 40, 34, 18 which is used for the corrections of haze effects using Simple Dark Object Subtraction method (SDOS). But the Predicted Haze Values (PHV) for Green band (Band2), Red band (Band3) and NIR band (band4) are 40, 21.20 and 8.80 and Final Predicted Haze Value (FPHV) for these bands are 40, 18.02 and 11.80 which is used for the corrections of haze effects using Improved Dark Object Subtraction Method (IDOS) showing in table 8 & figure 2.
Table 8. Final Predict Haze Values of Very Clear Relative Scattering Model.
There are quite dramatic changes among the Haze Values used in Simple Dark Object Subtraction method and Predicted Haze Values and Final Predicted Haze Values used in Improved Dark Object Subtraction Method. Therefore, the result of Simple Dark Object Subtraction method and Improved Dark Object
Subtraction method are quite difference and the unrealistic haze correction should be occurred if Simple Dark Object Subtraction method is used without considering the principle of relative scattering of atmosphere.
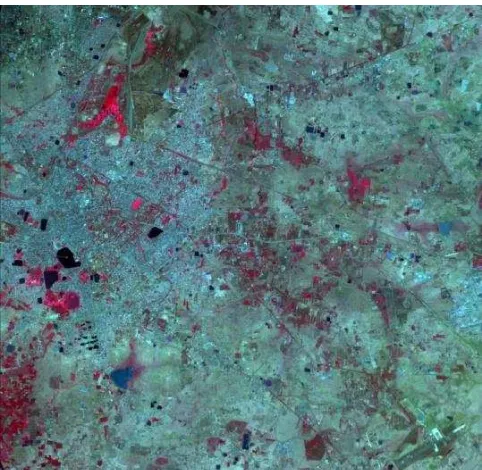
Figure 1. Original Uncorrected Resourcesat-1 LISS-4 multispectral satellites image, acquired on 22th March 2009.
Figure 1. Atmospheric Corrected FCC Resourcesat-1 LISS-4 satellite Image multispectral
Band
s Gain Offset Gain Normalization ( NORi)
2 27.17 0.00 1.00
3 23.06 0.00 0.85
4 36.77 0.00 1.35
Bands
SDOS Improved Dark Object Subtraction Method
Haze Values
Predicted Haze Values
Final Predicted Haze Values
2 40 40.00 40.00
3 34 21.20 18.02
7 CONCLUSION
Improved Dark Object Subtraction method is used to compute predicted haze values which are wavelength dependent and highly correlated to each other and generates realistic results with proper gain and offset normalization. The correction of atmospheric haze is applied to original data in DN counts of the imaging systems. Because normalizing the predicted haze Values for gain and offset allows the corrections to be applied without having to convert
entire image’s DNs into radiance values (Chavez, 1988).
Although it has some demerits as the haze value subtracted from the entire scene which is practically fails to provide realistic result in some sorts, besides this is very simple image based semi-empirical method which is very easy to calculate and application for user without prior details knowledge about field based imaging system.
REFERENCES
Reference from journals:
Chavez, P.S. Jr., 1988. An Improved Dark Object Subtraction Technique for Atmospheric Scattering Correction of Multispectral Data, Remote Sensing of Environment, 24, pp.459-479.
Chavez, P.S. Jr., 1989. Radiometric calibration of Landsat Thematic Mapper multispectral images, Photogrammetric Engineering and Remote Sensing, 55, pp.1285-1294.
Chavez, P.S. Jr., 1996. Image-Based Atmospheric Corrections-Revisited and Improved, Photogrammetric Engineering and Remote Sensing, 62(9), pp.1025-1036.
Chen, Xuexia, 2004. A Simple and effective radiometric correction method to improve landscape change detection across sensors and across time, Remote Sensing of Environment, 98 (2005), pp.63-79.
Curcio, J.A., 1961. Evaluation of atmospheric aerosol particle size distribution from scattering measurement in the visible and Infrared, J. Opt. Soc. Am. 51, pp.548-551.
Gong, Shaoqi et al. 2007. Comparison of atmospheric correction algorithms for TM image in inland waters, International journal of Remote Sensing, 29(8), pp.2199-2210.
Lu, D. et al. 2002. Assessment of atmospheric correction methods for Landsat TM data applicable to Amazon Basin LBA research, International journal of Image Processing, 23(13), pp.2651-2671.
Norjamaki, I. and T. Tokla, 2007. Comparison of Atmospheric Correction Methods in Mapping Timber Volume with Multi-temporal Landsat Images in Kainuu, Finland, Photogrammetric Engineering and Remote Sensing, 73(2), pp.155-163.
Saha, A.K. et al. 2005. Land Cover Classification Using IRS LISS III Image and DEM in a Rugged Terrain: A Case Study of Himalayas, Geocarto International, 20(2), pp.33-40.
Song, Conghe et al. 2000. Classification and Change Detection Using Landsat TM Data: When and How to Correct Atmospheric Effects?, Remote Sensing of Environment, 75, pp.230-244.
Spanner, M. A. et al. 1990. Remote sensing of temperate coniferous forest leaf area index-The influence of canopy closure, understory vegetation and background reflectance, International Journal of Remote Sensing, II, pp.95-111.
Tyagi, Priti and Udhav Bhosle, 2011. Atmospheric Correction of Remotely Sensed Images in Spatial and Transform domain, International journal of Image Processing, 5(5), pp.564-579.
Reference from books:
Lillesand M. Thomas and Ralph W. Kiefer, 2000. Remote Sensing and Image Interpretation, John Wiley & Sons Inc.
Reference from others literature:
Du Yong et al. 2001. Radiometric Normalization of Multi-temporal High Resolution Satellite images with Quality Control for Land Cover Change Detection, Canada Centre for Remote Sensing, Natural Resources Canada 588 Booth Street, Ottawa, ONK1A 0Y7.
Slater, P.N. et al. 1983. Photographic systems for remote sensing, American Society of Photogrammetry Second Edition of Manual of Remote Sensing, 1(6), pp.231-291.
ACKNOWLEDGEMENTS