METHODOLOGY FOR ORIENTATION AND FUSION OF PHOTOGRAMMETRIC AND
LIDARDATAS FOR MULTITEMPORAL STUDIES
C. Colomo-Jiménez a, J. L. Pérez-García a, T. Fernández-del Castillo a, J. M. Gómez-López a, A. T. Mozas-Calvache a
a Dept. Ingeniería Cartográfica, Geodésica y Fotogrametría, University of Jaén, 23071 Jaén, Spain – [email protected], (jlperez, tfernan, jglopez, antmozas)@ujaen.es
Commission VII, WG VII/6
KEY WORDS: Photogrammetry, LiDAR, data fusion, multitemporal analyses
ABSTRACT:
Nowadays, data fusion is one of the trends in geomatics sciences, due to the necessity of merging data from different kind of sensors and periods of time. Also, to extrract the maximum information from data and useful multitemporal analysis, an exact geoconnection of all datasets in a common and stable reference system is essential. The results of the application of a methodology for an integrated orientation into a common reference system using data obtained by LiDAR systems, digital and historical photogrammetric flights dataset, used for proper analysis in multitemporal studies, are presented in this paper. In order to analyse the results of the presented methodology, several photogrammetric datasets have been used. This data corresponds with digital and analogic data. The most current flight (2010) combines data obtained with digital photogrammetric camera and LiDAR sensor which will be used as reference model for all subsequent photogrammetry flights. The philosophy of the methodology consists of orientating all photogrammetric flights to the DEM obtained by LiDAR data. All the models obtained from every photogrammetric block are comparable in terms of the geometric resolution of each one. For that reason, altimetric stable points are extracted automatically from the LiDAR points cloud to use these points such as altimetric control point in the different flights that must be oriented. Using LiDAR control points, we demonstrate the improvement in the results between initial orientation and final results. Also it is possible to improve the planimetric correspondence between different photogrammetric blocks using only altimetric control points iteratively.
1. INTRODUCTION
Geomatics techniques are important tools in the multitemporal analysis applied to environmental, urban and general territorial issues. These kinds of techniques allow us modelling regions in order to study accurately the deformation monitoring or dynamics of unstable areas analyses. For that, the use of remote sensing techniques have been increased in environmental studies (Qing et al 2012; Walstra, et al., 2004) and natural risk studies (Metternich et al., 2005). Also, public administrations have worked hard in order to compile and publish geomatic open data using Spatial Data Infrastructures, which improve the knowledge of our environment using multifonts data.
Despite of the growing open available data and the diverse acquisition systems, the combination between data from different origins is a challenge nowadays. Some factors such as cover, data quality, reference systems, update rate or characteristics of capture systems, are factorswhich must be considered to get a correct data fusion.
Integration could happen in 4 main components of geospatial data: Spatial, (data integration of different scale and spatial resolution), thematic (data integration with other thematic resolution or detail in the legend), origin (photogrammetric images, satellite imagery, LiDAR data) and temporal (data integration of different temporal resolution or sampling interval). The integration of these data will allow respectively the multi-scale, thematic-temporal statistical and evolutionary approach very useful in the case of risk analysis processes (Fernandez et al., 2012).
Digital Photogrammetric and LiDAR data havea great interest in environmental studies. If we want multitemporal studies, we need
historical images. Data fusion allows merge LiDAR and images data properties. Phorogrammetric data have a great semantic information and Break lines are well defined (Ackermann, 1999), nevertheless, 3D information obtained is calculated and it is affected by orientation parameters and matching software. On the other hand, LiDAR is a direct acquisition system, whose greatest benefit is a high capture information rate in small periods (Schenk y Csatho, 2002). However, LiDAR data have less redundancy and may be blur break lines. By combining LiDAR and photogrammetry, it is observed that the negative aspects of one technology is counteracted by the other positive aspects, so that the integration of both systems is beneficial in field studies (Baltsavias, 1999).
Several lines of research have been exposed in order to merge LiDAR and image sensors in a common reference system. In 2004 a paper for no metric CCD camera orientation using LiDAR data extracted manually was published (Delara et al., 2004). On the other hand, lines extraction from LiDAR is considered as an alternative way to introduce LiDAR in absolute orientation (Habib et al., 2004; Habib et al., 2006).
Photogrammetry data have been used to monitoring landslide using current and historic images, and calculating differential DEMs (Cardenal et al., 2008; Prokesova et al., 2010; Fabris et al., 2011). In other projects, Interest points are used in order to improve the cinematic movement knowledge.
2. MATERIALS
2.1. Study Area
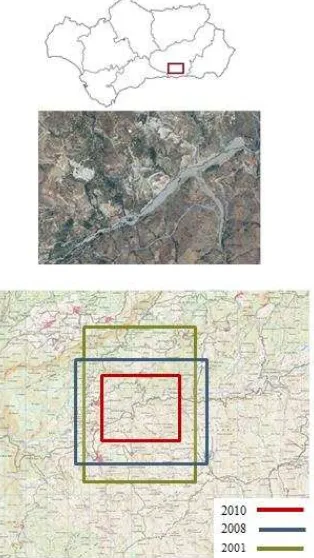
The study area selected for the analysis is placed in “Las Alpujarras” region, a highland area in the south of Spain. This area has been chosen because it is a really active area in landslide process, with many movements of slope, falls and rockslides or debris flows. This is a suitable area to test this type of change detection studies, being an area where there are significant changes in the ground surface.
Figure 1: Study Area
2.2. Data set
In order to make the study, two digital flights are available. The 2010 digital flight combines digital camera data (Z/I DMC), with a Leica ALS50-II LiDAR sensor and GPS/IMU system. LiDAR cloud point data has a 0.8 points/m2, they will be considered as reference data to the photogrammetric orientation.
The 2008 digital flight has been captured with a Z/I DMC digital camera and has external orientation parameters with IMU system but does not have the accuracy of the parameters. Also, an analogic flight from 2001 in grey scale has been used to check the methodology in historical flights.
Campaign Bands Format GSD LiDAR
2010 RGB-NIR Digital 20 cm. YES 2008 RGB-NIR Digital 20 cm. NO
2001 B/N Film 30 cm. NO
Table 1: Camera characteristics.
3. METHODOLOGY
The objective of the proposed methodology is the orientation of photogrammetric flights from a LiDAR point cloud extracting altimetric control point automatically and incorporating these points in the aerotriangulation adjustment. The aim of the
methodology is the fusion of multisensory and multitemporal data to incorporate in evolution studies without using terrain control points.
Figure 2: General Process
The figure 2 shows how the data control of the process is obtained from own analysis data, using LiDAR data as reference system in the data set due to the higher spatial resolution than image data.
3.1. Pre-Orientation
The first phase of the methodology is the pre-orientation of the flights with the target to merge LiDAR data and photogrammetric data in the same reference system. It has special importance in historical flights due to the change in reference system in Spain.
The typical solution is the measurement of terrain points. However, the philosophy of the methodology exposed is the reduction of control point number in the process, for that, we choose photogrammetric open data in the pre-orientation phase. Using historical public orthoimage the pre-orientation process is simplified, and the accuracy is sufficient for the pre-adjust process. This pre-orientation stage is not required in modern flight with GPS and inertial data because the pre-orientation is made by those values.
3.2. Mixed Orientation
In order to correct the errors found in the relative orientation of the images, we introduce the concept of external mixed orientation (Fernández et al., 2012, 2013). External mixed orientation considers the flights parameters and their precision value combined tie points in the images.
constraining the orientation and position with the accuracy system.
3.3. Altimetric control point extraction
For extraction of altimetric points of control, it aims to generate an altitudes raster from LiDAR data with equal resolution to the mean of the point cloud.Using the image of altitudes is justified for analysis by standard procedures of digital image analysis making use of filters to images of altitudes.
When the Z raster (MDE) is calculated, the point of interest extraction to be used as control points areprocessed to use as Z control points.
The main feature for the extraction of these points is that they must be altimetry stable points in a relatively large area. That points must be Z stable and constant slope in any direction. To extract Z stable points it is required to apply a gradient variation filter (gradient of gradient) in the z images from LiDAR. The gradient filter aims to determine discontinuities in the image of altitudes, so that abrupt changes in the slope and altitude are obtained.
Figure 3: Automatic Control Point Extraction
3.4. Altimetric Control Point Orientation
The third step is the incorporation of altimetric LiDAR data into photogrammetric flights in order to absolute orientation. The extraction of altimetric data is done from non-classified LiDAR data converted into raster image. The LiDAR image is processed with the gradient variation filter. Using Gradient Variation filter, we extract point with constant Z in large areas. Stable Z points are considered that points which do not have Z coordinate variation in any direction.
The next step is the semi-automatic altimetric LiDAR point measurement in the image dataset. First, the system lists all the images where the Z point appear. Secondly, the system choose the reference image, which is the image where the photo-coordinate of the point is nearest of photo-center. Third, the photocoordinates are measured in other images by matching.
When all control points are measured in all images the orientation parameters are computed using adjustment of blunder. In this adjustment, the control points are considered as altimetric, for that, planimetric coordinates are free in the process, which is constrained only by Z LiDAR coordinates.
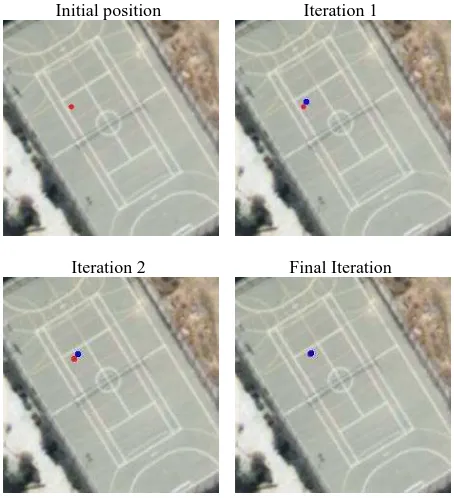
3.5. Iterative altimetric control point orientation
The opportunity to demonstrate the XYZ orientation of the flight campaigns using only Z control points is studied in this article.
This process is considered a reorientation, because both systems (photogrammetric and LiDAR) must be close, and we try to improve the correspondence between both system to have better results in multitemporal analyses.
Figure 4: Iterative Process
In the adjustment of bundles the altimetric control points change their planimetric position respect initial coordinates. If we want to adjust the planimetry of the flight using only altimetric points we must consider an iterative process. When the adjustment of the image position is made, the original control point coordinates are introduced again, and all measurements in the images are repeated with the new photocoordinates positions and the adjustment of bundles is recalculated. In this way a readjust of the planimetric position for each point is calculated which will be considered as right position when calculating position and original position does not have variation, or the change was smaller than GSD image.
Initial position Iteration 1
Iteration 2 Final Iteration
In this way, if the adjustement of bundles is repeated using altimetric LiDAR control points, an improvement between both reference systems is confirmed.
4. RESULTS
4.1. Orientation Control Quality
To check the results in the orientation process of the current methodology, different tests have been applied for each step of the process. The first testing is the comparison between each orientation phase DSM and the LiDAR reference DSM. With this process, a differential DEM is calculated where the Z gap between both systems are shown for each XY position. It allows to detect systematics errors in absolute orientation between both systems. The second testing consists of the measurement of GPS check points in the terrain after each orientation step. It allows check punctual discrepancies and evolution of its discrepancies both altimetry and planimetry.
4.1.1. DEM Control Quality: Differential DEMs between
LiDAR and photogrammetric data are shown for each campaign and step of the process.
4.1.1.1. 2010 Flight: Analysing Figure 6, in the first image of
the process, some Green areas are shown. These areas suggest that the images are not well oriented. Introducing tie point, these orientation errors are deleted, and introducing LiDAR data in the process, the correspondence is improved.
Pre Orientation Methodology
Direct O. Tie Point C. LiDAR O. Iter. LiDAR
Figure 6: 2010 Orientation Evolution
These results could be studied using statistical results that show an improvement in the mean error reducing the initial error in the end of the process to 9% of the initial
Mean [m.] Std. Desv [m.] Direct Orientation 0.082 0.481 Tie Point Orientation 0.123 0.455 LiDAR Orientation -0.021 0.435 Iterated LiDAR orientation -0.007 0.437
Table 2: 2010 Statical Evolution
The evolution of the error behaviour could be shown in the figure 7, which represent the DEM error histogram between LiDAR DEM and photogrammetric 2010 flight.
Figure 7: 2010 error histogram
4.1.1.2. 2008 Flight: In direct orientation, there is different
trends respect the reference DEM, exists areas which are above the reference, and other which are below, with a sharp variation. This phenomenon indicates that exist relative orientation problems between images, which are solved introducing tie points.
Introducing Z LiDAR control points, the coordinates matching between both epoch improve highly. That allow us detect change areas in green colour.
Pre Orientation Methodology
Direct O. Tie Point C.
LiDAR O. Iter. LiDAR
Figure 8: 2008 Orientation Evolution
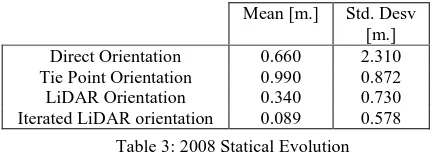
These results could be studied using statical results that show an improvement in the mean error reducing the initial error in the end of the process to 13% of the initial.
Mean [m.] Std. Desv [m.] Direct Orientation 0.660 2.310 Tie Point Orientation 0.990 0.872 LiDAR Orientation 0.340 0.730 Iterated LiDAR orientation 0.089 0.578
Table 3: 2008 Statical Evolution
Figure 9: 2008 error histogram
4.1.1.3. 2001 Flight: In this case, after use the reference system
from ED50 to ETRS89, a lack of XY correspondence between reference system and oriented images is observed. This phenomenon is appreciable in the error change of trend in slope changes.
Introducing Z LiDAR control points, we can see how the historical flights is reoriented both planimetry and altimetry such as could be checked in the evolution shown in the figure10, after introduce LiDAR points, and the iteration process.
Pre Orientation Methodology
LiDAR O. Iter. LiDAR
Figure 10: 2001 Orientation Evolution
These results could be studied using statical results that show an improvement in the mean error reducing the initial error in the end of the process to 50% of the initial.
Mean [m.] Std. Desv [m.] Tie Point Orientation 1.001 0.997
LiDAR Orientation 0.976 0.938 Iterated LiDAR orientation 0.497 0.891
Table 4: 2001 Statical Evolution
The evolution of the error behaviour could be shown in the figure 11, which represent the DEM error histogram between LiDAR DEM and photogrammetric 2001 flight., and could be checked how the center of the error distribution evolves to the non error position.
Figure 11: 2001 error histogram
4.1.2.Check Points Analyse: GPS Check points study are
measured in stereo after each orientation step in order to analyse the orientation behaviour in planimetry and altimetry. The results are shown in a combination maps with indicates with a colour map to indicate z error and arrow map to indicate XY differences.
4.1.2.1. 2010 Flight: The Figure 12 show the evolution of the
error orientation in different phases of the process in the 2010 data set.
Tie point Ori. LiDAR Ori. Iterated LiDAR Ori.
Figure 12: 2010 Check Points Analyse
Studying discrepancies in planimetric coordinates, the point errors evolves from 0.537 m in the tie point orientation phase to 0.502 m. at the end of the proposed methodology. On the other hand, the altimetric error evolves from 0.032 meters to 0.023 m.
XYZ Error [m.]
Tie Point LiDAR Iterated LiDAR
Mean 0.794 0.793 0.616
Des. Std 0.398 0.333 0.246
Table 5: 2010 Check Points error values
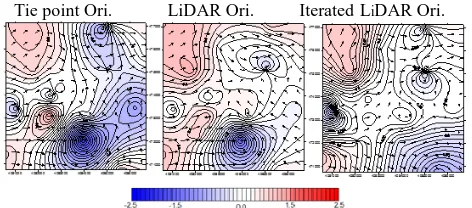
4.1.2.2. 2008 Flight: The Figure 13 show the evolution of the
error orientation in different phases of the process in the 2008 data set.
Tie point Ori. LiDAR Ori. Iterated LiDAR Ori.
Figure 13. 2008 Check Points Analyse
0.471 m. at the end of the proposed methodology. On the other hand, the altimetric error evolves from 0.032 meters to 0.471 m.
XYZ Error [m.]
Tie Point LiDAR Iterated LiDAR
Mean 2.040 1.177 0.716
Des. Std 0.960 0.523 0.388
Table 6: 2008 Check Points error values
4.1.2.3. 2001 Flight: The Figure 14 show the evolution of the
error orientation in different phases of the process in the 2001 data set.
Tie point Ori. LiDAR Ori. Iterated LiDAR Ori.
Figure 14: 2001 Check Points Analyse
Studying discrepancies in planimetric coordinates, the point errors evolves from 1.387 m in the tie point orientation phase to 0.636 m. at the end of the proposed methodology. On the other hand, the altimetric error evolves from 0.636 meters to 0.151 m.
XYZ Error [m.]
Tie Point LiDAR Iterated LiDAR
Mean 2.048 1.414 0.821
Des. Std 1.387 0.494 0.166
Table 7: 2001 Check Points error values
4.2. Multitemporal Study
Using general well oriented and merged DEMs, landslide areas could be detected in the temporal series. A landslide example have been taken to study the behaviour of a huge natural landslide.
Figure 15. Landslide studied
With these referenced data we can analyse the landslides produced on the slope, both numerically and graphically. And we can study the evolution in the time.
4.2.1. Numerical analysis: Using the merged DEMs, a
multitemporal analysis could be made in order to study absolute movements of materials in the area, both erosion and accumulation, so that the difference of these two values show the total material lost for each period.
Absolute Mass Movement (m3) Period Erosion Accumulation Loss
2001-2008 -85784 46182 -39602
2008-2010 -18389 7124 -11265
Table 8: Numerial analysis
4.2.2. Analysis by DEM: The second study is the analysis
from the models, which gives an overview of the behaviour of the slope.
Figure 16: Landslide Evolution
Watching the images of both study epochs, in the 2001-2008 period exists an area which has a loss material trend in the top of the slope, which is combined with other area which has an opposite trend. This behaviour shows us that the slope is activated with a plane near to the top of the slope and it generates the movements in block of a huge mass of material.
On the other hand, in the 2008-2010 period, it could be observed that the base slope has an appreciable loss of material, due to fluvial processes between slope and river contact area.
5. CONCLUSIONS
The work has shown the compatibility to use altimetry control points extracted from LiDAR point cloud in the process of absolute photogrammetric orientation. Also, positive results have been obtained in current flights with inertial and GPS systems. However, the most significant results are the satisfactory absolute orientation in historical flights without aerotriangulation parameters, which increase the possibilities in the use of the proposed methodology between LiDAR and photoghrammetric historical flights in order to use in multitemporal analyses which need historical information. The main contribution of the methodology is the semi-automatic measurement of control points extracted own data set. With this, the control points are removed in the field, reducing working time and allowing a better match between the various study campaigns.
moving to the origin error axis. Also, analyzing GPS check points, this trend confirms that photogrammetric flights readjust their XY position using only Z control.
Also we must consider that compared DEMs are from different origins. While LiDAR data is a direct data, photogrametry DEM requires some steps which may introduce associated errors, such as relative orientation or matching. In addition, the resolution of theses photogrammetric DEMs are smaller than LiDAR resolution, for that, photogrammetric DEMs are more smoothed, and that induce to errors in the comparison process. It is also important to consider that differences between reference LiDAR data and photogrammetric flights grow when we consider historical flights and increase with the difference in (the) time, due to the worst image quality and less data resolution.
As final conclusion, all tests show better results using the current methodology and all orientation results within required accuracies for this kind of job and scales. It can be concluded that the methodology is viable to orientate and merge photogrammetric data with LiDAR data without using external control points in order to do multitemporal studies.
REFERENCES
Ackermann, F. (1999). Airborne laser scanning present status. ISPRS Journal of Photogrammetry and Remote Sensing 54 (1), 64– 67.
Baltsavias, E. (1999). A comparison between photogrammetry and laser scanning. ISPRS Journal of Photogrammetry & Remote Sensing, 54(1) , 83–94.
Cardenal, F. J., Mata, E., Perez-García, J. L., Delgado, J., Hernández, M. A., González, A., y otros. (2008). Close range digital photogrammetry techniques applied to landslides monitoring. The International Archives of the Photogrammetry, Remote Sensing And Spatial Information Sciences. Vol. XXXVII, Part B8, 235-240.
Cardenal, J., Delgado, J., Mata, E., González-Diez, A., & Olague, I. (2006). Use of historical flight for landslide monitoring. 7th International Symposium on Spatial Accuracy Assessment in Natural Resources and Env. Sciences, (págs. 129-138). Lisbonne, Portugal.
Chacón, J., Irigaray, c., Fernández, T., & El Hamdouni, R. (2006). Engineering geology maps: Landslides and GIS. Bulletin of Eng. Geol. and the Environment. (2006) 65:341-411 DeGraff, J.V. and Romesburg, H.C. (1980). Regional landslide-susceptibility assessment for wildland management: a matrix approach. Coates D.R. &Vitek.J.D.editors , 401-414.
Delara, R., Mitishita, E., & Habib, A. (2004). Bundle adjustment of images from non-metric ccd camera using lidar data as control points. XXth ISPRS Congress,Commission 3, WG I, (pág. 470). Istanbul, TurkeY.
Fabris, M., Baldi, P., Anzidei, M., Pesci, A., Bortoluzzi, G., & Aliani, S. (2010). High resolution topographic model of panarea island by fusion of photogrammetric, LiDAR and bathymetric digital terrain models. The Photogrammetric Record, 25(132), 382–401.
Fernández, T., Pérez García, J. L., Colomo, C., Mata, E., Delgado, J., Cardenal, F. C., y otros. (2012). Digital Photogramemetry and LiDAR techniques to study the evolution
of a landslide. 8th International Conference on Geo-information for Disaster Management.
Habib, A., Ghanma, M., & Mitishita, E. (2005a). Photogrammetric Georeferencing Using LIDAR Linear and Areal Features. Korean Journal of Geomatics, Vol. 5, N°. 1 , 7-19.
Habib, A., Ghanma, M., Morgan, M., & Al-Ruzouq, R. (2005b). Photogrammetric and LIDAR data registration using linear features. Journal of Photogrammetric Engineering & Remote Sensing, 71(6) , 699–707.
Habib, A., Pullivelli, A., Mitishita, E., & Ghanma, M. (2006). Stability analysis of low-cost digital cameras for aerial mapping using different geo-referencing techniques. Journal of Photogrammetric Record, 21(113), 29-43.
McIntosh, K., & Krupnik, A. (2002). Integration of laser-derived DSMs and matched image edges for generating an accurate surface. SPRS Journal of Photogrammetry & Remote sensing 56, 167-176.
Metternicht, G., Hurni, L., & Gogu, R. (2005). Remote sensing of landslides: An analysis of the potential contribution to geo-spatial systems for hazard assessment in mountainous environments. Remote Sensing of Environment, 98, 284–303.
Prokešová, R., Kardoš, M., & Medvedová, A. (2010). Landslide dynamics from high-resolution aerial photographs: A case study from the Western Carpathians, Slovakia. Geomorphology, Elsevier, 115, 90–101.
Schenk, T., Seo, S., & Csatho, B. (2001). Accuracy Study of airborne laser scanning data with photogrammetry. International Archives of Photogrammetry and Remote Sensing, vol. 34 (part 3/W4), 113.
Walstra, J., Chandler, J. H., Dixon, N., & Dijkstra, T. A. (2004). Time for change-quantifying landslide evolution using historical aerial photographs and modern photogrammetric methods. nternational Archives of Photogrammetry, Remote Sensing and Spatial Information Sciences, Vol.34 (Part XXX), Commission 4 , 475-481.