A. Operational Definition
To avoid confusion on understanding the content of this paper, operational
definitions of variables in this study are presented as follow:
1. Interdisciplinary thinking skill is score of students in answering:
b) questions of natural science (Biology, Physics, and Chemistry) which
become the disciplinary grounding of interdisciplinary thinking skill in excretory system;
c) questions containing perfected integrated knowledge (advancement through integration) in excretory system; and
d) questions which demand students' critical awareness in excretory system.
2. Connected teaching is teaching by connecting material of Biology that is excretory system concept with materials of Chemistry and Physics which are
related with the excretory system concept. Material of Chemistry concerning
principals of deposition and dissolution, Dalton Laws, and concept of buffer
solution. Meanwhile, material of Physics which will be connected is about the
concept of hydrostatic pressure.
3. Instructional framework which has base of dimensions of learning in this
research is the organize of teaching which has grounding on five dimensions
of learning by Marzano, they are 1) attitude and perceptions, 2) acquiring and
integrating knowledge, 3) extending and refining knowledge, dimension 4)
using knowledge meaningfully, 5) Productive habits of mind.
B. Data Source
All participants were eleventh grade students enrolled in a senior high school
located on Jalan A.H. Nasution No. 27 Bandung, West Java, Indonesia. The
population in this study was XI Grade Senior High School students of SMAN 24
the eleventh grade, there are XI-IPA 1 and XI-IPA 2 as regular class. Those
participants were assigned purposively (Sugiyono, 2002: 61) by researcher, to
assure they were better than others in academic achievement. Purposive sampling
technique is the sampling that is used by researcher has the spesific objective in
the research. Participants were not given any compensation for their involvement
in this research.
Table 3.1 Pretest-Posttest Nonrandomized and Nonequivalent Control Group Design
Experiment Pretest √ Posttest
Control Pretest - Posttest
(Source: Suryabrata, 1983) Information:
√: The application of connected teaching with instructional framework which has base of dimensions of learning (consist of: Attitude and perception, acquire and integrate knowledge, extend and refine knowledge, and using knowledge meaningfully)
-: only use connected teaching
C. Research Design
This research was conducted using Quasy Experiment. Suryabrata (1983:36) explained that quasy experiment has the aim to gain information which becomes prediction for information gained by true experiment in the condition of
impossible to control and/or manipulate all relevant variables.
The application of connected teaching with instructional framework which has
base of dimensions of learning is applied in experiment class. Meanwhile, control
class is not given treatment as in experiment class. Measuring interdisciplinary
thinking skill of student is done through pretest and posttest. While the research
design that was incorporated in this research is Pretest-Posttest Nonrandomized
Making instrument Writing proposal
Judgemen instrumen Managing permitions Syllabus curicullum KTSP
and curicullum 2013
Choosing Title
Preparation Concept of excretory system
Execution
Pretest
Dimension of Learning and
connected teaching (team teaching)
Control class Experiment Class
Connected Teaching (teamteaching)
Pretest
Interview
Data Analysis
Discussion and conclusion Questionnaire Conducting Posttest
Material presentation Connectedly Teaching by using framework of
dimensions of learning and material presentation connectedly
Observation
D. Instrumentation
Below are presented the steps to develop each instrument administered in this
study.
1. Judgment
The unstrument were first reviewed and judged by a group of experts. The
experts are college master and doctor of either pedagogy of biology and
physiological science. In total there were three experts (two of them are author’s
advisor). The instruments were reviewed for its construct and content validity.
After the instruments were approved by the fisrt advisor, they were then
administered in the pilot testing.
2. Try Out
After judgment session the instrument were administered in a pilot testing
session to test its’ criterion validity. The tryout was done to a sample of the kinds of individuals that will be required to respond in the final data collection. Since
the participant of this research was high school students. A total of 47 high school
students, the instrument were being tested to a sample of students who already
learned the excretory system topic.
3. Factor Analysis
After pilot testing, the quantitative instruments were analyzed using a test item
analysis. The essay item achievement test and questionnaire analysis was
cinducted using the ANATES uraian version 4.0.7 9 and IBM SPSS V.20, the analysis itself encompassed these aspects:
a. Validity
The validity index refers to a correlation coefficient that is used to “describe
the relationship between a set of scores obtained by the same group of individuals on a particular instrument and their scores on same criterion measure”
b. Reliability
Reliability refers to the consistency of test scores-that is, to how consistent
they are from one measurement. To measure this, researcher also used the
software that was based on Kuder-Richardson formula 20 (KR20), which is based on the proprotion of correct and incorrect responses to each of the items on a test
and the variance of the total scores (Arikunto, 2012).
c. Degree of Difficulty
Item difficulty or degree difficulty denotes the potential of a question to be
answered correctly by the students. The simple step to calculate this index is by
using this following formula. After the index of discrimination was obtained,
researcher interpreted the value by referring to the criterion (Arikunto, 2012).
d. Index of Discrimination
Index of discrimination or Item discriminability referred to the potential items
in question to show diffrerences between the groups of students. In this study the
index of discrimination referred to potential of the interdisciplinary questions to
differentiate students’ based on their understanding of the disciplinary grounding and integration skill in the excretory system topic. The calculation within the
software was based on this simple equation (Arikunto, 2012).
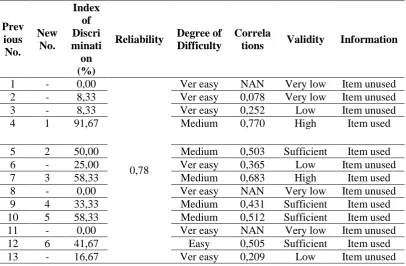
4. Result of Factor Analysis
The factor analysis of Multiplechoice Questions (MQ) showed that MQ have a
high reliability (α= 0,78). It could also be reported that majority of test items are
valid, some of the item were revised based on Judgment. While for Essay
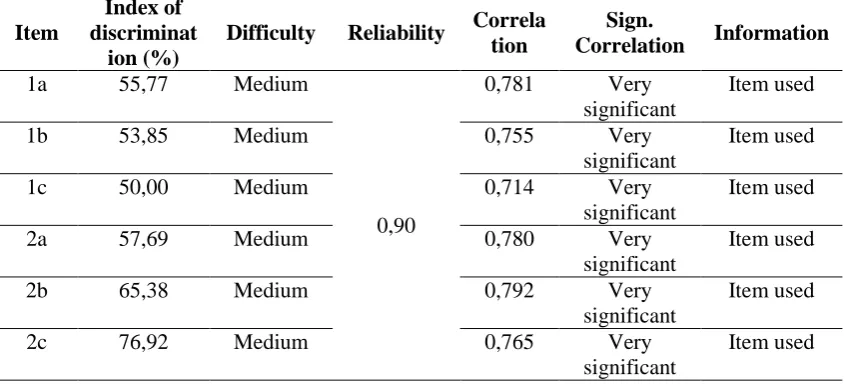
Questions (EQ), the raliability index was also high (α= 0,90). The validity
analysis showed that all of MQ were having a low significance; on the contrary all
of the EQ test items are valid. Some of the items (rcal>rtable) were used in this
study, some of them were revised based on judgment (0<rcal<rtable) (see detail in
5. Research Instruments
Table 3.2 presents instrument that are used in this study, along with their data
source and the aim of its incorporation in the study.
Table 3.2 Instruments of the Study Instruments Data Source
(Data type)
Aim
Multiplechoice Questions Students Measure students’ disciplinary grounding and integrate skill Essay Questions Students Measure students’ critical
awareness
Questionnaire Students Catch students’ opinion about learning strategy
Interview Students Obtain additional information of
the intervention
Anecdotal field note Observation Cover information uncovered by other instruments
a. Multiplechoice Questions
MQ is a instrument designed to asses student’s disciplinary grounding and
integrate skill. This instruments consist of 52 items (See Appendix B). Each of
items was made based on learning objectives by Marzano (1992) (see table 3.3).
Table 3.3 Result of Factor Analysis for the Multiplechoice Questions
Prev
Reliability Degree of Difficulty
Correla
tions Validity Information
Prev
Reliability Degree of Difficulty
Correla
tions Validity Information
14 - -16,67 Very
difficult
-0,192 Very low Item unused
15 7 25,00
0,78
Ver easy 0,581 Sufficient Item revised 16 8 50,00 Easy 0,424 Sufficient Item revised
-0,402 Very Low Item unused
Prev
Reliability Degree of Difficulty
Correla
tions Validity Information
51 23 8,33 Very easy 0,176 Veyr low Item revised 52 - 0,00 Difficult 0,005 Vey low Item unused
b. Essay Questions
MQ is a instrument designed to asses student’s critical awareness. This instruments consist of six items (See Appendix B). Each of items was made
based on learning objectives by Marzano (1992) (see table 3.4).
Table 3.4 Result of Factor Analysis for the Essay Questions
Item
Index of discriminat
ion (%)
Difficulty Reliability Correla tion
Questionnaire made was questionnaire for students to know students'
assumption about learning process based on steps of connected teaching with
dimensions of learning. The questionnaire admission filling was done in the fourth
meeting.
d. Interview
Interview were conducted to the students after attending learning process
learning. The anecdotal field note was completed by author to capture additional
information uncovered by other instrument.
E. Data Processing
1. Multiplechoice Questions
MQ were scored using a scoring guide generated by author. The score of each
question was one point for each correct answer and it was transfomed became
value. Besides, it represent the percentage of indicators within the participant’s
answer of the questions, so the maximum score for this test is 100. This process
implemented separately for each question of both posttest and pretest data.
In this research, questions were given in pretest and posttest. So
normalized-gain value were used to know how much improvement after intervention. Based
on Hake (1999:1), normalized-gain is counted by using the formulation:
n
Explanation: T1 = Score pretest T2 = Score posttest
Is = Score maximum pretest /posttest
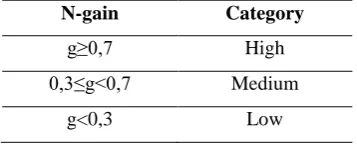
Categorization of normalized gain value can be seen based on the table
below:
Table 3.5 Value Category Normalized-gain
N-gain Category
g≥0,7 High
0,3≤g<0,7 Medium
g<0,3 Low
2. Essay Question
The essay question were scored using rubric (see Appendix A), which made
analyzes. The maximum score for this test is 100. This process implemented
separately for each question of both posttest and pretest data.
3. Questionnaire
This questionnaire that consisted of ordinal sclae (5-sclae), the data were
categorized based on the aspect (there were 13 aspect). Then, the data must first
transformed into score in every aspect and got the average score of its aspect.
F. Data Analysis
Analysis of the data (Multiplechoice and Essay Questions) was conducted
mainly using the IBM Statistical Package Software for Social Sciences (SPSS)
version 20.0. The analysis was conducted using descriptive statistics. The
assumptions test of two important properties of data distribution were also
conducted to determine what type of inferential statistics test that should be
conducted. The two basic assumption were: normality (using:
Kolmogorov-Smirniov Test) and homogenity using (Levenes Statistics). After the assumptions
tests, researcher used statistics test to examine the proposed hypotheses as
featured in Table 3.6. Detailed result of each test were included in the Appendix
C.
Independent sample test was incorporated in this study if the data distribution
was normal. On the contrary, if the data distribution un-normal, then the data
were transformed for got the normal data, but if un-normal consistent, so the data
were analyzed using non-parametric test (U-Mann Whitney Test).
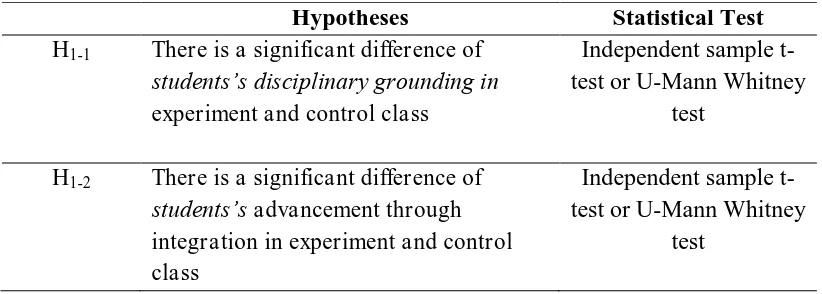
Table 3.6 Statistical Test to Examine Hypotheses
Hypotheses Statistical Test
H1-1 There is a significant difference of
students’s disciplinary grounding in experiment and control class
Independent sample t-test or U-Mann Whitney
test
H1-2 There is a significant difference of
students’s advancement through integration in experiment and control class
Independent sample t-test or U-Mann Whitney
Hypotheses Statistical Test Hypotheses
H1-3 There is a significant difference of
students’s critical awareness in experiment and control class.
Independent sample t-test or U-Mann Whitney
test
H1-4 There is a significant correlation among
interdisciplinary thinking skill component.
Pearson Product Moment or Spearmann
Correlation
To specifically adress the fisrt until three research question, normalized gain
between pretest and posttest were also calculated (See Appendix D for the
detailed result). The acquired scores of the gain could the be used to show the
effectiveness of the given intervention. The normalized-gain was then categorized
based on standards appointed by Hake (1999:1). After completing the data
analysis, crosscheck to the literature review was also conducted to explain
important findings.
G. Procedure of the Research
Research procedure covers all the things done starting from the beginning step
of problem determination until the final step of making conclusion. In the
preparation step, design teaching strategy is made for experiment and control
class. After making teaching scenario, the next step is making instruments and
doing validation. In the step of conducting research, pretest is done. Then learning activities are done in experiment and control class. In experiment class
and control class material of excretory system is presented in connected way. However, in experiment class instructional framework based on learning
dimensions developed by Marzano et al. (1992) consist of four dimensions: dimension I attitude and perception, dimension II Acquiring and Integrating
Knowledge, dimension III Extending and Refining Knowledge and dimension IV
Use Knowledge Meaningfully. Meanwhile, control class uses conventional
method. To distinguish teaching process done in experiment and control class can
Table 3.7 Comparison of Teaching Process in Experiment and Control Class
Experiment Class Control Class
I Attitude and Perception
Teachers greet students and make the conditions of class become comfortable for students
Teachers attract students' attention by displaying video about dialysis and kidney
Teachers tell phenomena of kidney stone and obligation of dialysis every week for the whole lifetime to motivate students by explaining the importance of keeping health
Teachers give some productive questions related to the video they have seen
Teachers explain the aim/goal of learning and also the benefits of learning material of excretion system
Teachers give reference
Opening:
Teachers attract students' attention by displaying video about dialysis and kidney stone
Teachers motivate students to explain the importance of keeping health, especially excretion system
Teachers ask questions to students related to the video that have been displayed
Teachers explain the aim/goal of teaching and give reference
Teachers connect material of excretion system with material that have been discussed that is
respiratory system
Main Activity:
Teachers explain structure of anatomy, morphology, and physiology excretion organ in human
Materials are presented connected with others relevant subjects, such as concept of Chemistry about buffer solution to explain
mechanisms of urine forming, stone kidney forming. Besides,
submaterial of excretion system is connected with the subject Physics about pressure principles in the concept of countercurrent multiplier.
Teachers display video to strengthen concept of students's understanding about the physiological process in excretion system
In the next meeting, practical activity of urine test is conducted II Acquiring and Intergrating Knowledge
Teachers show facts visually about excretion activities
Students construct definition of excretion system
Students give declarative questions about excretion system so that they remind specific information about material respiratory system that related to excretion
Students give descriptive questions about organs excretion and students are asked to identify and describe torso excretion organs
Teachers give explanation about anatomy, morphology, and physiological organs excretion in human by connecting it with the subjects of Chemistry and Physics to facilitate students in integrating new knowledge with
prior-knowledge they have got
Students construct their own knowledge and internalize them by distracting their
excretion process in human
During teaching process, teachers give oral feed back and motivation
Students present the result of practical activities and collect report of practical activities During
teaching process, teachers give oral feed back when students ask questions about material that is not understood
Closing:
Teachers review materials that have been discussed
Teachers give postest questions to find the result of students' learning Some students are asked to explain process of
excretion in liver, skin, kidney, and lung in front of the class
Teachers facilitate students to assimilate and accomodate knowledge
Teachers show pictures of excretion organs such as flatworm, ground worm, insects, and kidney in vertebrae to explained evolutionary variations of excretion organs
Students are asked to make difference about excretion system in animals trough pictures in slides
Teachers explain abnormality and disease in excretion system and ask students to analyze mistakes and disturbance occurred in organs which are possibly occurred those disease from the perspective of disciplines (Chemistry and Physics)
IV Using Knowledge Meaningfully
Students are instructed to bring urine samples for practical work urine composition test
Orally students are asked to determine what tools used in practical work urine test
Students grouped in five or six people do experiment group members' urine composition test
Students interpret and analyze the result of urine test and discusse the result of practical work with their group
Students fill and answer questions in
paperwork based on practical work that have been conducted
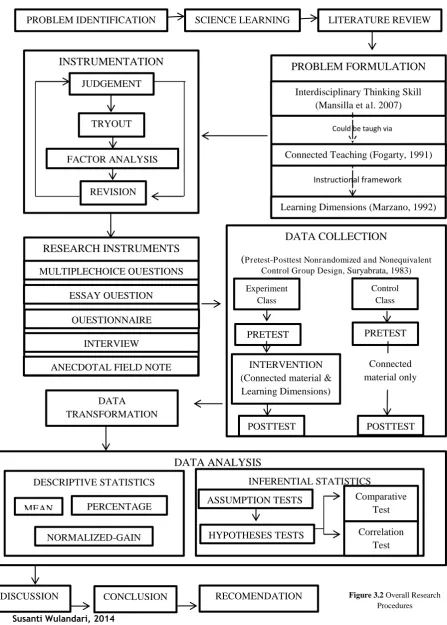
In the fourth meeting in the end of teaching activity, posttest is done and questionnaire is collected to find students' opinion about teaching process that
obstacles faced by them and also about students' impression during teaching
process. Summary of all procedures of this research is presented in the picture
3.2.
PROBLEM IDENTIFICATION SCIENCE LEARNING LITERATURE REVIEW
PROBLEM FORMULATION
Interdisciplinary Thinking Skill (Mansilla et al. 2007)
Could be taugh via
Connected Teaching (Fogarty, 1991)
Learning Dimensions (Marzano, 1992)
Instructional framework
(Pretest-Posttest Nonrandomized and Nonequivalent Control Group Design, Suryabrata, 1983)