ANALYSIS
Energy, diversity and development in economic systems; an
empirical analysis
Paul H. Templet *
Louisiana State Uni6ersity Institute for En6ironmental Studies,42Atkinson Hall,LSU,Baton Rouge,LA70803,USA Received 30 July 1997; received in revised form 9 July 1998; accepted 31 July 1998
Abstract
As economic systems develop over time they tend to become more complex with more structure and greater throughputs, assuming favorable conditions. Energy use increases as more economic sectors develop and more channels for flow are opened. Economic diversity, as measured by the number of economic sectors using energy and the equatability of flows between them, generally increases. As diversity increases the efficiency of generating outputs with a given amount of energy also increases. Development capacity, the product of system energy throughput and diversity of flows, is a measure of the potential system output and is calculated for selected countries. Capacity changes over time are shown to relate to changes in economic output in selected countries. Two distinct development strategies become evident, one which promotes energy use and one which emphasizes diversity. While most countries utilize a mix of the two, developing countries generally rely more on increasing energy use to increase output while developed countries tend to become more diverse as a means of increasing outputs. Sustainability is enhanced by strategies which promote diversity and resource use efficiency in economic systems. © 1999 Elsevier Science B.V. All rights reserved.
Keywords: Energy; Economic diversity; Development capacity; Economic systems
www.elsevier.com/locate/ecolecon
1. Introduction
Economic development is an evolutionary pro-cess that results in changes over time as economic systems self-organize in response to energy flows
and information feedback (Norgaard, 1992;
Gowdy, 1994, p. 127). Economies are open ther-modynamic systems which extract low entropy materials and energy from the environment to create goods and high entropy wastes. Wastes, including spent products, ultimately leave the eco-nomic system and are discharged to the environ-ment. Kauffman (1995) characterizes such systems which are far from equilibrium as on ‘‘...the edge of chaos’’ (p. 26) where order is at an optimum to * Tel.: +1 504 3886428.
facilitate change through self-organization with-out being unstable, i.e. such systems are between inflexible order and unpredictable chaos. A
por-tion of energy throughput builds structure
thereby increasing complexity and reducing un-certainty (Muller, 1998). This behavior resembles the dissipative structures of Prigogine (1980) which consume energy while increasing complex-ity and decreasing uncertainty within systems. These changes can also be represented as
in-creasing Shannon – Weaver (Shannon and
Weaver, 1949) diversity (Templet, 1996a, 1998a). Economic evolution continues over time as more system diversity leads to increased effi-ciency and less entropy generated at the margin, and so on as the energy flow-diversity building cycle continues. This may be an example of sys-tems behavior characterized by von Bertalanffy (1968) as ‘‘...directedness based upon struc-ture...’’. Kauffman (1995, p. 25) characterizes the changes as ‘‘Order, vast and generative, arises naturally’’. The greater the evolved diver-sity within a system the greater the number and types of energy uses, the more equitable the dis-tribution between compartments and the smaller the energy flow gradients between compartments (Muller, 1998). To put it another way, as energy cascades through the compartments of the sys-tem it generates less entropy at the margin (spe-cific entropy) if there are many compartments with only small gradients between them. Reduc-ing marginal entropy is a system requirement for ecological evolution (Binswanger, 1993) and probably for economic evolution. This organiza-tional strategy is also incorporated into indus-trial ecology (Tibbs, 1993; Andrews et al., 1994; Frosch, 1994) and used by ecosystems during development (i.e. succession and evolution) and results in more system diversity, structure and information (Odum, 1969).
Assuming isomorphism across system types (von Bertalanffy, 1968, p. 33; von Bertalanffy, 1975, p. 121), economic system diversity is also expected to generally increase during develop-ment. Having built new structure with a portion of past energy flow, an economic system be-comes more diverse in structure and efficient in generating future outputs (Muller, 1998;
Tem-plet, 1998a). Productivity is expected to rise and the energy intensity of system production, i.e. the amount of energy necessary to generate a dollar of GNP, rises rapidly in early
develop-ment, peaks and then declines as GNP/capita
increases (Goldemberg, 1996; Templet, 1996a). Diversity is important because it relates to im-provements in efficiency, productivity and out-put (Ulanowicz, 1986). A measure of diversity is useful because it gives us a means of tracking economic evolution and progress toward sustain-ability.
In an earlier paper (Templet, 1996a), I pre-sented an empirical means of estimating diver-sity in economic systems using broad economic sectors as energy nodes (analogous to species in
ecological systems) in the Shannon – Weaver
(Shannon and Weaver, 1949) equation. The rela-tionship of diversity (H) to GNP per capita was found to be positive, logarithmic and significant. A cross-sectional analyses over 64 countries and the 50 states of the US shows a significant and positive relationship between gross national (or
state) product and development capacity (r=
0.27 and 0.95, respectively). The stronger
rela-tionship between gross state product and
economic capacity for the US states may be due to the fact that the states have similar gover-nance, cultural and economic systems while countries do not. As one might expect, those countries with the highest diversity are the most
highly developed and have the highest GNP/
capita. There is a significant and positive
rela-tionship between average GNP/capita and
average diversity for grouped countries (Tem-plet, 1998a). However, there are hindrances to the building of diversity in economic systems. If energy is plentiful and cheap then a favored strategy is to invest in more energy procurement which yields rapid output returns rather than building diversity whose returns generally are longer term and cumulative. This introduces the
concept of short- and long-term economic
strategies which parallel Daly’s (Daly, 1993) ‘growth’ and ‘development’ economic stages.
that diversity and capacity are related. Tilman et al. (1996) investigated Darwin’s suggestion for grassland ecosystems and found the relationship of diversity to productivity to be positive and significant. Ulanowicz (1986) has developed a gen-eral theory of growth and development using energy flows, information theory and input – out-put techniques which he has applied to ecosys-tems. He defines system ‘ascendancy’ (i.e. to rise) as the product of system size (represented by energy throughput) and organization (which is related to diversity, structure, mutual information or connectedness). The first term in the formula-tion of ascendancy is the ‘development capacity’ which serves as an upper bound on the ascen-dancy since the remaining terms are negative and represent redundancy or overhead. Mageau et al. (1995) have suggested that Ulanowicz’s formula-tion could be used to assess economic system health but presented no data. The purpose of this paper is to empirically explore the relationship of the organizational structure of systems, which is represented by Shannon – Weaver diversity, to productivity and output.
Laitner (1995, pp. 10 – 11) has performed a two-sector analysis of the US where he investigated the effect of efficiency and structural changes on GDP. His measure of structural change was the change in value added of the service sector, rather than diversity, and the period of analysis was different than that used here. For the period 1970 – 1987 he found that efficiency improvements in the US represented 92% of the change while in the later period, 1987 – 1993, efficiency improve-ments were only 51%. Structural changes ac-counted for the remainder of the change in the two periods.
The energy data used in this paper is commer-cial energy consumption, i.e. the energy that is traded in markets. This approach neglects tradi-tional energy use (firewood, charcoal, etc. which is collected and used by households but which does not enter markets) and which can be a substantial portion of total energy consumption in developing countries but which declines in relative impor-tance as development proceeds and fossil fuels begin to dominate a countries’ energy mix.
2. Results and discussion
2.1. Di6ersity, output and de6elopment
Economic diversity can be calculated from the Shannon – Weaver (Shannon and Weaver, 1949) formula;
H= −%i[pilnpi] (1)
where H is the diversity and pi is the fraction of
energy flowing through compartment or sector, i.
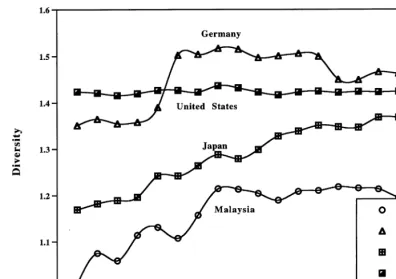
Economic energy diversity calculated with Eq. (1) has two components, richness (i.e. the number of channels present, which determines the number of terms in the summation) and equability which is a measure of how evenly energy is distributed across channels. Energy data across countries is collected into six categories or channels labeled industrial, commercial, residential, transportation, agriculture and other (World Resources Institute, 1992). Agriculture is omitted from this analysis because of lack of data. Applying Eq. (1) to yearly energy sector data gives the diversity values used in this analysis. A representative set of coun-try diversities are shown in Fig. 1 over time. The diversity in Malaysia is the lowest of the four countries but has climbed rapidly from 1971 to 1978 and has remained relatively unchanged since then. Japan’s diversity in 1971 was low for a developed country but has climbed consistently since then while the US has remained unchanged over the period. Germany’s diversity overtook the US shortly after a swift rise beginning in 1974, which was probably prompted by the oil price shock of that year, and has fluctuated but remains above the US diversity. (For more information on economic diversity see Templet, 1996a, 1998a).
Development capacity is the energy throughput multiplied by a term which is similar to the diver-sity formulation used here and derives from
sys-tem organization (Ulanowicz, 1986). Using
Fig. 1. Selected country diversity by year.
the organizational term if one assumes a five-com-partment model with single energy inputs to each compartment and no interconnections or energy outputs other than dissipation. Data availability requires this simplification of Ulanowicz’s ap-proach for economic systems and therefore the diversity calculated here can only be a first order approximation. This first approximation to ascen-dancy indicates a positive relationship to diver-sity, in agreement with Darwin’s prediction. The existence of the neglected overhead terms means that the relationship is not so straightforward and may have led to the historical uncertainty sur-rounding the role of diversity in the output and stability of ecosystems.
The development capacity (C) can be written as:
C=Energy Throughput× −%i[pilnpi] (2)
or
C=E×H (3)
taking the natural log of both sides of Eq. (2) gives (Eq. (4)):
lnC=lnE+lnH (4)
or
Change C/C=Change E/E
+Change H/H (5)
whereEis the annual commercial energy
through-put of a country. From Eq. (5) we see that the
fractional change inCis the sum of the fractional
changes in E and H. Table 1 gives the results of
the change analysis of H, E, C and GNP for 12
selected countries, six developing and six devel-oped by decade over two decades.
During the 1970s five of the six ‘developing’ countries shown in Table 1 had low or negative
Table 1
Changes in diversity, energy consumption and capacity by decade for selected countries
Country 1971–1980; % change in 1980–1988; % change in
E C(E×H) GNP H E C(E×H) GNP
H
Developing countries
100.3 102.2 99.1 1.7 21.8 23.5 17
Brazil 1.9
Korea, Rep. 69.7 113.6
2.5
Indonesia 82.4 84.9 86.9 4.3 58.9 63.2 65.8
72.5 91.5 100 −0.4 81.5
Malaysia 19 81.1 59.1
75.1 78.1 72.6 0.7
3 53.1
Average change 53.8 54
Developed countries
16.6 27.4 27.1 −2.2
10.8 −8.6
Germany, FR. −10.8 14.2
Luxembourg 39.1 −12.4 26.7 103.3 11.1 −11.9 −0.8 41.5
−0.9 3.8 19.3 1.3
4.7 −7.2
Sweden −5.9 16.4
7.3
Switzerland 13.8 21.1 81.7 −1.4 2.4 1 17.7
4.5 4.4 28.1 0 4.5 4.4
United States −0.1 25.9
24.1 35.2 51.6 5.4
11.1 10.8
Japan 16.1 37.2
7.6
Average change 12.2 19.7 51.9 2.4 −1.7 0.7 25.5
consumption considerably (Chile’s energy con-sumption declined slightly resulting in a small
negative change in C). Malaysia is the
excep-tion, having increased both its diversity and its energy consumption significantly over the period while its GNP doubled. During the 1970s the ‘developed’ countries, in contrast, generally had
larger increases in H and smaller percentage
in-creases in E. The US did not increase diversity
for the two decades but increased energy con-sumption instead. The US strategy is reflected in its policies which promote cheap energy prices and large energy subsidies which has resulted in one of the highest energy intensities among de-veloped countries. Japan’s strategy of increasing
H rapidly and energy consumption slowly seems
to have worked, Japan’s GNP/capita is now
among the highest of all countries. The author
(Templet, 1996a,b) has previously shown
that for ‘developed’ countries, and the US states, pollution, resource use and economic and public welfare measures generally improve only as the energy intensity declines. For the 1970s the relationship of the change in development
capacity (C) to change in GNP across the 12
countries in Table 1 is positive and significant (r=0.71).
For the 1980s the picture is similar to the prior decade in ‘developing’ countries which had
low or negative increases in H and fairly large
percentage increases in energy. The ‘developed’ countries, with the exception of Luxembourg and Japan, also had small or negative increases
in H but negative or only small percentage
in-creases in E. Luxembourg had the largest
in-creases in H and decreases in E in both decades
while GNP increased significantly. The US
ex-hibited little change in H over both decades
with moderate percentage increases in E and
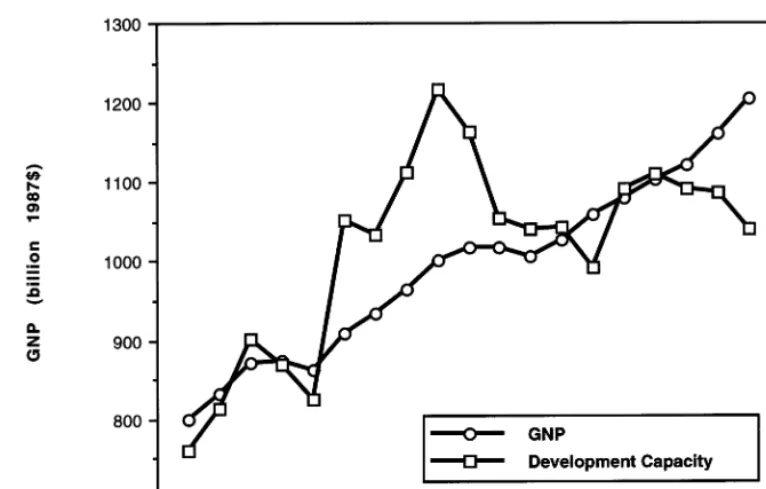
GNP. However, US energy consumption is so large that moderate percentage increases mask large absolute increases. Germany and Sweden decreased energy use during the 1980s with little
or no improvement in H which resulted in
de-creases in C. Consequently, their GNPs rose
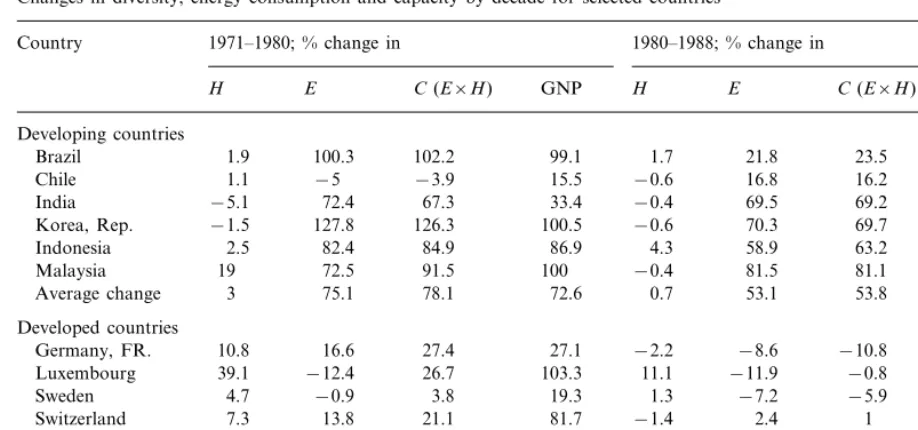
Fig. 2. Malaysia development capacity and GNP by year.
relationship which changes from positive to neg-ative as illustrated by the 1980s data for Ger-many, Luxembourg and Sweden. The decline in capacity for the three countries is related to the fairly large declines in energy consumption and is reflected in lower, but still positive, rates of GNP growth. This suggests that improvements
in H are cumulative, i.e. they continue to yield
dividends for future years even if the increase in
H slows, as it must eventually. The relationship
of changes in C to changes in GNP is positive
and significant (r=0.76) across the 12 countries
for the two decades (pooled data), thereby affirming Ulanowicz’s formulation. Since the
changes in C, and thus GNP, are the sum of
the changes in H and E (from Eq. (5)) the
rea-sons for the increase in GNP are easily traced in Table 1. For ‘developing countries’ the
aver-age change in H are small for both decades
while the changes in E are much larger. For
‘developed countries’ the converse is true, the
average change in H is higher than the average
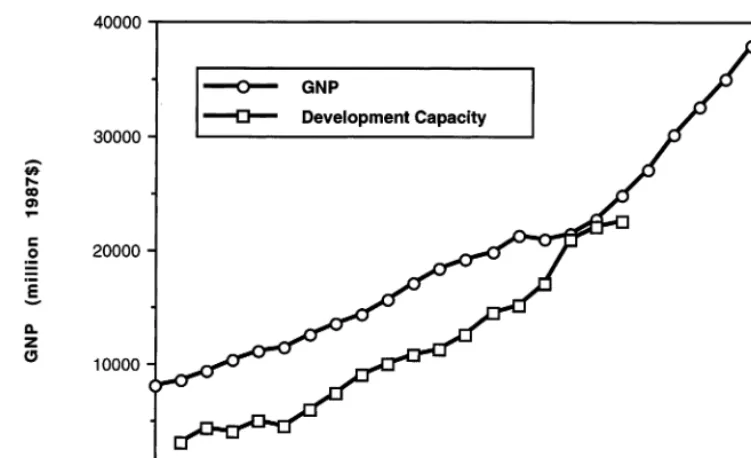
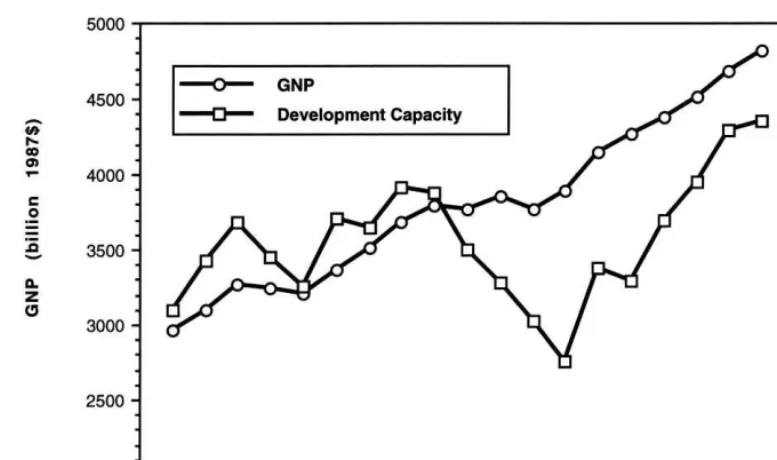
change in E across both decades. Figs. 2 – 5
show plots of the development capacity (C) and
GNP by year for Malaysia, Japan, the US and Germany, respectively. As expected GNP tends
to follow the development capacity but there is variation in capacity over time in the case of the US and Germany. The capacity analysis could be improved if more detailed energy data for countries was available which would allow a more realistic model of an economic system.
Then Ulanowicz’s ascendancy ‘redundancy’
terms could presumably be used to make the analysis more realistic, accurate and predictive.
2.2. Policy implications
Fig. 3. Japan GNP and development capacity by year. energy stocks, i.e. fossil fuels, are consumed
rather than renewable energy flows.
It is apparent from Eq. (3) that changes in development capacity can occur by two distinct means: increasing energy consumption (growth) or increasing system diversity (development). In actuality most countries use some combination of the two. Because increasing energy throughput increases pollution levels, and causes other im-pacts this strategy for growth is self-limiting. For example, pollution levels, as measured by toxic chemical releases (US EPA, 1991) across the US states, are positively and significantly related to
total energy use and industrial energy use (r=
0.84 and 0.93, respectively). Global warming and acid rain are two obvious examples of feedbacks due to high energy use which can have a negative impact on economic capacity. On the other hand, improving diversity does not have apparent nega-tive feedbacks although there are costs. One such cost is the energy required to maintain the system diversity although this development cost should be less than the costs of energy growth strategies. Decision makers at any level of development adopt strategies depending upon existing
condi-tions, e.g. the price and availability of energy, timing (i.e. their stage of economic evolution), the desire for rapid growth and political conditions. Maintaining low prices for energy would tend to slow the development of diversity and sacrifice efficiency in favor of increased energy throughput as is the case with the US and some other devel-oped western countries (e.g. Canada and Aus-tralia). Low energy prices also result in more externalities which generate subsidies for energy intensive industry and those already well-off while those less-well-off bear the costs leading to higher income disparities (Templet, 1995a). Industrial en-ergy prices are significantly and negatively related
to income disparity (r= −0.35) across the 50 US
states (Templet, 1996a). Low industrial energy prices across the US states also lead to lower
efficiency and higher energy intensity (r=0.44).
Fig. 4. US GNP and development capacity by year. (Barancik and Shapiro, 1992), one that ranks it
among developing countries.
Economic systems in early development gener-ally tend to increase energy throughput rapidly while efficiency slowly increases (analogous to Lotka’s (Lotka, 1922) ‘maximum power’ princi-ple in ecosystems). Economic systems in later development exhibit higher diversity and effi-ciency with stable or declining energy through-put. This behavior results in a peak in energy intensity and, in ecological systems, in ‘r’ and
‘K’ type development strategies, respectively
(Odum, 1969). The ability of a society to choose different development scenarios implies an im-portant role for government in promoting sus-tainability with policies which emphasize system diversity and de-emphasize rapidly increasing en-ergy consumption as a means of capacity build-ing, at least in the more developed countries. Examples are the energy tax policies of most European countries which drives their price of energy upward relative to US energy prices. As a consequence their diversity and energy inten-sity have improved over the last few decades which, according to this analysis, improved their economies and resulted in higher income and
improved public welfare while reducing negative environmental impacts per unit of output. This linkage of more efficient energy use to improve-ment in both economic and environimprove-mental
con-ditions may help explain the positive
relationship between a sound economy and a healthy environment which the author, and oth-ers, have found for countries (Templet, 1996a) and the US states (Meyer, 1992; Cannon, 1993; Hall, 1994; Templet and Farber, 1994; Templet, 1995b). In addition, the Organization for Eco-nomic Cooperation and Development (OECD, 1993) found that environmental policies ‘‘...may spur innovation, improve efficiency and confer competitive advantage...’’ (emphasis added).
in-Fig. 5. Germany GNP and development capacity by year. creased. Those countries which follow the US
model of low energy prices generally have lower diversity and higher energy intensity. There are empirical indications that higher energy prices are ‘positively’ related to production output. For example, the rate of gross state product growth (for 1982 – 1989) across the US states is ‘posi-tively’ related to higher energy prices (r=0.67), not negatively as some economic models might predict.
One other interesting energy relationship is that of environmental regulation and its effect on energy intensity. This study indicates that en-vironmental regulation generally plays a positive role in improving sustainability and competitive-ness because pollution prevention strategies like waste reduction require more cooperation, inte-gration and diversity of industry, i.e. they in-crease diversity and efficiency. To test this statement further we can examine the relation-ship between environmental policies and energy intensity. There is a positive and significant rela-tionship across states between the Green In-dexes’ policy score (Hall and Kerr, 1992) and a state’s energy intensity (r=0.62), i.e. as a state’s
environmental policies improve the energy inten-sity declines (the relationship is positive because a higher green policy score means poorer poli-cies). The relationships do not determine the di-rection of causation but good environmental policies are clearly compatible with lower energy intensity and higher economic growth rates (Templet, 1998b).
3. Conclusion
Policies guiding economic development can uti-lize different energy strategies to maximize eco-nomic output. These strategies generally involve the manipulation of energy flows. One type of policy merely results in increases in energy flows through sectors, the other affects the distribution or allocation of energy across economic sectors or the development of new sectors. Because energy use in economic systems can cause negative im-pacts to other related systems, e.g. ecosystems, the essential resource source and waste sink services provided by ecosystems to economies may be reduced by high energy consumption. Sustainable development policies should stress diversity cre-ation and minimize the emphasis on increasing energy consumption. Government must play a role because policies which minimize energy con-sumption and encourage diversity represent the best long-term sustainability strategy and such strategies do not appear to emerge from markets alone. Policies which maximize energy use by holding energy prices artificially low through sub-sidies epitomize short-term strategies and are un-sustainable since more energy use increases the risk of impacts and a diminished environment which then increases risks to development (Tem-plet and Farber, 1994). In addition, cheap energy policies diminish system incentives to build diver-sity. Government taxing policies which increase energy prices to high energy use sectors appear to result in long-term improvements to public wel-fare and economic competitiveness. The measure-ment of changes in diversity, energy flows and development capacity used in conjunction over time can be useful tools for predicting whether a country’s development strategies and policies are promoting or hindering sustainability.
A sustainable policy relies on increasing the diversity of the system which results in fewer externalities and cumulative economic efficiency gains. The environmentally acceptable level of economic outputs is higher when system diversity is higher for a given energy throughput but still remains constrained by system scale consider-ations (Daly, 1992). At a minimum, the path of economic sustainability requires efficient systems with moderate consumption and high diversity, all maintained with renewable energies.
References
Andrews, C., Berkhout, F., Thomas V., 1994. The industrial ecology agenda. In: Socolow, R., Andrews, C., Berkhout, F., Thomas, V., (Eds.), Industrial Ecology and Global Change. Cambridge University Press, New York, NY. pp. 469 – 77.
Barancik, S., Shapiro, I., 1992. Where Have All the Dollars Gone? Center on Budget and Policy Priorities, Washing-ton, DC.
von Bertalanffy, L., 1968. General System Theory. George Braziller, New York, NY.
von Bertalanffy, L., 1975. Perspectives on General System Theory. George Braziller, New York, NY.
Binswanger, M., 1993. From microscopic to macroscopic theo-ries: entropic aspects of ecological and economic processes. Ecol. Econ. 8 (3), 209 – 234.
Cannon, F., 1993. Economic Growth and the Environment, Economic and Business Outlook. Bank of America Eco-nomics-Policy Research Department.
Daly, H.E., 1992. Allocation, distribution, and scale: towards an economics that is efficient, just and sustainable. Ecol. Econ. 6 (3), 185 – 193.
Daly, H.E., 1993, Introduction to essays toward a steady-state economy. In: Daly, H.E., Townsend, K.N. (Eds.), Valuing the Earth: Economics, Ecology and Ethics. MIT Press, Cambridge, MA.
Darwin, C., 1859. The Origin of Species by Natural Selection. Murray, London.
Frosch, R.A., 1994. Industrial ecology: minimizing the impact of industrial waste. Physics Today Nov., 63 – 68. Goldemberg, J., 1996. Energy, Environment and
Develop-ment. Earthscan, London, pp. 75 – 80.
Gowdy, J.M., 1994. Coevolutionary Economics: The Econ-omy, Society and the Environment. Kluwer, Boston, MA. Hall, B., Kerr, M.L., 1992. Green Index. Institute for
South-ern Studies. Island Press, Durham, NC.
Hall, B., 1994. Gold and Green, Institute for Southern Studies. Island Press, Durham, NC.
Kauffman, S., 1995. At Home in the Universe, The Search for the Laws of Self-Organization and Diversity. Oxford Uni-versity Press, New York, NY.
Laitner, S., 1995. Energy Efficiency and Economic Indicators: Charting Improvements in the Economy and the Environ-ment. American Council for an Energy Efficient Economy, Washington, DC.
Lotka, A.J., 1922. Contribution to the energetics of evolution. Proc. Natl. Acad. Sci. 8, 147 – 155.
Mageau, M.T., Costanza, R., Ulanowicz, R.E., 1995. The development and initial testing of a quantitative assessment of ecosystem health. Ecosystem Health 1 (4), 201 – 213. Meyer, S.M., 1992. Environmentalism and Economic
Prosper-ity: Testing the Environmental Impact Hypothesis, Project on Environmental Politics and Policy. Mass. Inst. of Tech-nology, Bldg./Room E38-628, Cambridge, MA. 02139. Muller, F., 1998. Gradients in ecological systems. Ecol.
Norgaard, R., 1992. Co-evolution of economy, society and environment. In: Ekins, P., Max-Neef, M. (Eds.), Real-Life Economics. Routledge, London, pp. 76 – 86.
Odum, E.P., 1969. The Strategy of Ecosystem Development. Science, 164, 262 – 270. The American Association for the Advancement of Science, Washington, DC.
OECD, 1993. Environmental Policies and Industrial Competi-tiveness. Organization for Economic Co-operation and Development, Paris, France.
Prigogine, I., 1980. From Being to Becoming: Time and Diver-sity in the Physical Sciences. W.H. Freeman, San Fran-cisco, CA.
Shannon, C.E., Weaver, W., 1949. The Mathematical Theory of Communication. University of Illinois Press, Urbana, IL.
Templet, P.H., Farber, S., 1994. The complementarity between environmental and economic risk: an empirical analysis. Ecol. Econ. 9, 153 – 165.
Templet, P.H., 1995a. Grazing the commons; an empirical analysis of externalities, subsidies and sustainability. Ecol. Econ. 12 February 1995, 141 – 159.
Templet, P.H., 1995b. The positive relationship between jobs, environment and the economy: an empirical analysis. Spec-trum Spring Issue, 37 – 49.
Templet, P.H., 1996a. The energy transition in international economic systems: an empirical analysis of change
during development. Int. J. Sustainable Dev. World Ecol. 3, 1 – 18.
Templet, P.H., 1996b. Economic growth, public welfare and sustainability: an empirical system analysis. Int. J. Sustain-ability World Ecol. 2, 1 – 16.
Templet, P.H., 1998a. Energy, Economic Diversity and Devel-opment, 17th Congress of the World Energy Council, Sept. 13 – 18, Houston, TX., published in proceedings.
Templet, P.H., 1998b. The neglected benefits of protecting ecological services, a commentary provided to the ecologi-cal economics forum. Ecol. Econ. 25, 53 – 55.
Tibbs, H., 1993. Industrial Ecology: An Environmental Agenda for Industry. Global Business Network, Emeryville, CA.
Tilman, D., Wedln, D., Knops, J., 1996. Productivity and sustainability influenced by biodiversity in grassland ecosystems. Nature 379, 718 – 720.
Ulanowicz, R.E., 1986. Growth and Development, Ecosystems Phenomenology. Springer-Verlag, New York, NY. US EPA, 1991. Toxics in the Community 1989, National and
Local Perspectives. Environmental Protection Agency, Washington, DC.
World Resources Institute, 1992. World Resources 1992 – 93: A Guide to the Global Environment and the accompa-nying database. World Resources Institute, New York, NY.