www.elsevier.com/locate/eja
Seed yield, oil and phytate concentration in the seeds
of two oilseed rape cultivars as a
ff
ected by
di
ff
erent phosphorus supply
T. Lickfett
a,
*, B. Mattha¨us
b
, L. Velasco
c
, C. Mo¨llers
c
aInstitute for Agricultural Chemistry, University of Goettingen, Von-Siebold-Str. 6, 37075 Goettingen, Germany bInstitute for Chemistry and Physics of Lipids, Federal Centre for Cereal,
Potato and Lipid Research in the Alliance Product and Nutrition Research, Piusallee 68/76, 48147 Mu¨nster, Germany cInstitute of Agronomy and Plant Breeding, University of Goettingen, Von-Siebold-Str. 8, 37075 Goettingen, Germany
Accepted 26 July 1999
Abstract
A greenhouse pot experiment was conducted for studying seed and oil yield, P uptake and phytate concentration in the seed of two oilseed rape cultivars (Brassica napusL. var. Oleifera, cv. Bristol and cv. Lirajet), grown on a soil substrate at different levels of plant available phosphorus (6, 19, 31 and 106 mg P-CAL kg−1 soil, resp.). All other nutrients were maintained at a high level. At maturity, seed yield and seed quality were investigated. An increase in the phosphorus soil supply resulted in a significant (P<0.05) increase in seed and oil yield, oil and P concentration of the seeds, and P transported to the seeds. The phytate-phosphorus concentration ranged from 0.5 to 6.9 g kg−1in the seeds and from 0.9 to 12.8 g kg−1in rapeseed meal. Insufficient P supply resulted in a reduced concentration of phosphorus and phytate in the seeds. Significant interactions between the factors cultivar and P supply were found for the traits seed yield, oil yield, and P-harvest index. © 1999 Elsevier Science B.V. All rights reserved.
Keywords:Oilseed rape; Phosphorus supply; Phytate; Yield formation
1. Introduction Phytate, the salt of phytic acid, myoinositol-hexa-kisphosphate (IP6), is the main storage form of The high nutritional value of oilseed rape phosphorus in grains and seeds (Marschner, 1995). (Brassica napus L. var. oleifera) and rapeseed The major part of phosphorus in the seeds of meal — resulting from a high energy and protein rapeseed is located in the endosperm (Bell and concentration and a favourable amino acid com- Shires, 1982). Phytate phosphorus makes up to position — is restricted by its concentration of 50%of the total phosphorus in legume seeds, 60– glucosinolates, tannins, phenolic acids and phytic 70%in cereal grains, and about 86%in wheat mill acid, which are summarized as anti-nutritive com- bran (Lolas et al., 1976). Phytates have a low pounds (Feuerstein, 1991; Mattha¨us et al., 1995). digestibility for monogasters, reduce the resorption of calcium, iron, magnesium, zinc and other trace elements, and form complexes with basic amino * Corresponding author. Tel.:+49-551395568;
acids (Shah et al., 1979; Atwal et al., 1980; fax:+40-551399550.
E-mail address:[email protected] (T. Lickfett) Marquard, 1993). As a result, large amounts of
phytate-P are transferred with the manure to the of silty loam from the subsoil of a luvisol and quartz sand. The calcium lactate acetate soluble P environment, where it may contribute to the
eutro-phication of soils and waters ( Feil and Fossati, content (P
CAL; Schu¨ller, 1969) of the soil was adjusted to 6 (P1), 19 (P2), 31 (P3) and 106 1997). Supplementing diets with phytase — as
already practised in intensive livestock areas — (P4) mg P kg−1 dry soil, resp., by addition of KH
2PO4. The P supply per pot ranged from 24 to and growing cultivars with low levels of phytic
acid in their seeds might help to reduce this 424 mg, representing a low to adequate level of available phosphorus for the plants (in Germany problem (Feil and Fossati, 1997). However,
posi-tive effects of human phytate intake such as 45–90 mg P kg−1 soil ). When filling the tubes, 0.5 g of N (as NH
4NO3) and 0.3 g of K (as reduced risk of colon cancer, kidney stone,
cholest-erine and caries are often ignored (Greiner and K
2SO4) were mixed with substrate. At growth stage EC 31, the pots were amended with 0.2 g of Jany, 1996).
The concentration of phytic acid in rapeseed S (as MgSO
4.7H2O), followed by a second dressing of 0.5 g of N (as NH
4NO3) in EC 53. Since no and its products is generally higher than in other
oilseeds (Mattha¨us et al., 1995); rapeseed contains automatic irrigation technique was available, the PVC tubes with a small hole at the bottom were 2.0–4.0 g, linseed 2.5–2.6 g, peanuts 1.9 g,
soy-beans 1.2–1.7 g and sunflower seeds 1.9 g of phytic placed in tubs filled with 2 cm of deionized water to maintain a constant water supply by capillary acid per 100 g of seeds. Until now, no rapeseed
cultivar with a low phytic acid concentration has ascent.
At maturity, plants were fractionated in seeds, been available (Marquard, 1993). The phytate P
portion of total phosphorus in the seeds of oilseed straw and roots. After grinding (<0.5 mm) of the dried (105°C ) plant material, the total N and C rape has been reported to range from 33 to 50%
( Karvanek et al., 1964; Nwokolo and Bragg, concentration in straw and roots was determined by elemental analysis following dry combustion 1977).
Since experimental data on seed phytate content (LECO CN-2000). The total phosphorus was determined by the Molybdate–Vanadate method of oilseed rape presumably derive from sites with
an adequate P level in the soil, the question is (Scheffer and Pajenkamp, 1952). In the seeds, the oil and protein concentration were determined by whether the phytic acid concentration is affected
by nutritional factors, such as the phosphorus near-infra-red spectroscopy ( Tkachuk, 1981). Phytic acid was analyzed by HPLC, as described availability in soil. Hence, the objective of our
experiment was to describe the influence of increas- by Mattha¨us et al. (1995). The yield of rapeseed meal was calculated as the total seed yield minus ing soil phosphorus supply on seed and oil yield,
P uptake and phytate concentration in the seeds the oil yield.
Data were analyzed with the SigmaStat Version of two oilseed rape cultivars.
2.0 of SPSS. The homogeneity of the variances was checked. If the F-test showed significant differences among means, Tukey’s test was used at
2. Material and methods
a probability level of 0.05 for mean comparisons. Two winter oilseed rape cultivars (cv. Lirajet
and cv. Bristol ) that differ in phenological
proper-ties (seed yield, date and duration of flowering, 3. Results
maturity) were grown in a growth chamber at 4°C
for 8 weeks. After vernalization, soil was rinsed 3.1. Seed yield off from the roots with deionized water and the
plants (two foliage leaves, EC 17) were transferred The overall seed yield (dry matter) reflects the P supply ( Table 1). It increases with elevated P to an open top greenhouse and planted into PVC
Table 1 mean: oil concentration tended to increase from Mean seed yield of two oilseed rape cultivars as affected by 43.2 (P1) to 47.3 g 100 g
−1 seed (P4), but a sig-P supplya
nificant increase was only observed at P rates of P2 and higher. There was no interaction between P supply Seed yield (g dry matter per plant)
the factors cultivar and P level.
(mg pot−1) (mg kg−1soil ) Cv. Bristol Cv. Lirajet Mean The oil yield per pot was mainly a
ffected by seed yield and less by the oil concentration of the
24 (P1) 6 3.2a 3.8a 3.5a
seeds. The oil yield increased from 1.3 g (P1) to
74 (P2) 19 12.7b 7.1ab 9.9b
124 (P3) 31 11.2b 9.1b 10.2b 6.9 g pot−1 (P4) in cv. Bristol and from 1.7 to 424 (P4) 106 14.2b 9.7b 11.9b 4.5 g pot−1 in cv. Lirajet. Over all P levels, cv.
Mean 10.3a 7.4b 8.9
Bristol’s mean was 42% higher than that of cv. Lirajet (4.90 vs. 3.44 g pot−1). The maximum aNumbers in a column followed by different letters indicate
significant differences atP<0.05. increase in oil yield occurred between P1 and P2.
3.3. Protein concentration 9.7 g pot−1 (cv. Lirajet). There is a statistically
significant difference (P<0.05) in the cultivar
The protein concentration in the seeds ranged means among the different levels of P supply as
from 23.5 (P1) to 18.7 g 100 g−1 (P4) for cv. well as between the two cultivars. Cv. Bristol’s
Bristol and from 21.8 (P1) to 18.1 g 100 g−1(P4) seed yield was about 39%higher than cv. Lirajet’s
for cv. Lirajet (data not shown). The differences in the plot mean. The seed yield significantly
in cultivar means as well as the decrease in protein increased between P1 and P2, whereas P3 and P4
concentration from P1 to P2 were significant showed no further significant effect. The
inter-(P<0.05). action between cultivars and P levels was
signifi-cant (P=0.024, not shown); this underlines that
the effect of different P supply on seed yield 3.4. Characteristics of P use depended on the genotype.
The total P concentration in the seeds ( Table 3) ranged from 0.23 (cv. Bristol, P1) to 3.2. Oil concentration and oil yield
0.81 g 100 g−1(cv. Lirajet, P4). There was a clear and significant classification of the P concentration The mean oil concentration of the cultivars was
46.4 g 100 g−1 seed for cv. Bristol and according to the P supply. Depending on the amount of supplied P, between 7.4 (P1) and 45.9 g 100 g−1for cv. Lirajet ( Table 2). Differences
between cultivars were not significant. Never- 89.5 mg pot−1(P4) were accumulated in the seeds; in the plot mean, no significant difference was theless, an effect of P supply was found in plot
Table 2
Oil concentration and oil yield of two oilseed rape cultivars as affected by P supplya
P supply Oil concentration (g 100 g−1seed ) Oil yield (g plant−1) (mg pot−1)
Cv. Bristol Cv. Lirajet Mean Cv. Bristol Cv. Lirajet Mean
24 (P1) 41.9a 44.6a 43.2a 1.3a 1.7a 1.5a
74 (P2) 47.5a 46.3a 46.9b 6.0b 3.3ab 4.7b
124 (P3) 47.6a 46.5a 47.1b 5.4b 4.3b 4.8b
424 (P4) 48.5a 46.1a 47.3b 6.9b 4.5b 5.7b
Mean 46.4a 45.9a 46.1 4.9a 3.4b 4.2
Table 3
Characteristics of P use of two oilseed rape cultivars at different P supplya
P supply P concentration in the P accumulated in seeds P accumulated in the above ground P harvest index (mg pot−1) seeds (g 100 g−1) (mg plant−1) plant parts at harvest (mg plant−1)
Cv. Cv. Mean Cv. Cv. Mean Cv. Cv. Mean Cv. Cv. Mean
Bristol Lirajet Bristol Lirajet Bristol Lirajet Bristol Lirajet
24 (P1) 0.23 0.26 0.24a 7.4 9.9 8.7a 8.9 10.0 9.5a 0.80 0.88 0.84a 74 (P2) 0.30 0.39 0.35b 38.1 27.7 32.9b 40.6 32.0 36.3b 0.95 0.78 0.87a 124 (P3) 0.41 0.48 0.45c 45.9 43.7 44.8b 52.7 50.0 51.4c 0.85 0.87 0.86a 424 (P4) 0.63 0.81 0.72d 89.5 78.6 84.0c 110.0 96.0 103.0d 0.80 0.78 0.79a Mean 0.39a 0.48b 0.44 45.2 40.0 42.6 53.2a 47.0b 50.1 0.85a 0.83a 0.84
aNumbers in a column followed by different letters indicate significant differences atP<0.05.
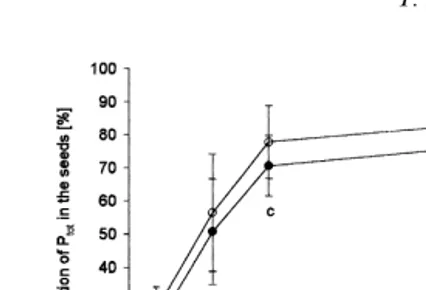
observed between the two cultivars, though Lirajet The portion of IP6-P of the total phosphorus (P
tot) in the seeds depended on the P supply showed distinctly higher values at all P levels. The
interaction between cultivar and P supply was not (Fig. 1). On average, it increased almost linearly from about 24%at P1 to 74%at P3; the triplication significant atP<0.05 (not shown).
The P accumulated in the above ground plant of P supply at P4 led to an increase of only 9% and reached 83%. No significant differences in parts (seeds and straw at maturity) did not differ
between the cultivars but was clearly affected by means of this parameter were found between culti-vars, and in the same way, the interaction P levels. At maturity, most of the P taken up was
present in the seeds. The P harvest index was cultivar×P supply was not significant.
The IP6-P/P
totratio increased with the P content nearly the same for both cultivars (cv. Bristol 0.85,
cv. Lirajet 0.83) and not affected by P supply. of the seeds. The correlation between these param-eters was quite strong (cv. Bristol: r=0.976***,
As shown in Table 4, the concentration of
phytate-P (IP6-P) in the seeds increased with P cv. Lirajet: r=0.975***). The regression coeffi
-cients of the linear regression are almost the same level. Furthermore, there was a significant diff
er-ence between the mean IP6-P concentration in for both cultivars (cv. Bristol: 1.131; cv. Lirajet: 1.120; data not shown).
the seeds of the two cultivars (0.34 vs.
0.25 g 100 g−1). The phytate-P concentration in There was a negative relationship between the concentration of IP6-P and protein in the seeds rapeseed meal increased from 0.11 at P1 to
1.12 g 100 g−1 at P4. Lirajet had a significantly (correlation coefficient r=−0.512;P=0.001) and a positive, but not significant, relationship for higher IP6-P concentration than cv. Bristol (0.63
vs. 0.48 g 100 g−1) averaged over all P levels. IP6-P vs. oil concentration in the seeds (r=0.279).
Table 4
Phytate-P concentration in the seeds of two oilseed rape cultivars with different P suppliesa
P supply IP6-P concentration in the seeds (g 100 g−1) IP6-P concentration in rapeseed meal (g 100 g−1) (mg pot−1)
Cv. Bristol Cv. Lirajet Mean Cv. Bristol Cv. Lirajet Mean
24 (P1) 0.05 0.07 0.06a 0.09 0.13 0.11a
74 (P2) 0.16 0.22 0.19b 0.30 0.42 0.36b
124 (P3) 0.29 0.38 0.34c 0.56 0.70 0.63c
424 (P4) 0.50 0.69 0.60d 0.96 1.28 1.12d
Mean 0.25a 0.34b 0.28 0.48a 0.63b 0.52
Presumably, this effect will need low or zero P fertilization for several decades as many soils have a high buffering capacity for phosphate. This will be accompanied by a decrease in soil fertility. Beyond this, phosphorus-deficient oil-seed rape plants seem to be able to increase phosphate uptake, e.g. from poorly soluble rock phosphates by root exudation of organic acids such as malic and citric acid (Hoffland, 1992). Regarding the plant’s nutrient efficiency, the physiological properties of rapeseed can be impressively described by the overall high P harvest index (PHI ) of oilseed rape, leading to Fig. 1. Percentage of IP6-P portion at P
totin the seeds of two a high P export with the seeds from the fields. rapeseed cultivars vs. P supply (means and standard deviation).
2. Selection of genotypes low in total P concen-The letters indicate significant differences in mean for the factor
phoshorus supply atP<0.05. tration. On the one hand, plants with a low total-phosphorus content will also show a low phytic acid content since both parameters are
4. Discussion closely correlated. On the other hand, it is not
quite clear how much P is necessary in the seeds The results of the experiment indicate that the
for ‘normal’ metabolism. Data on the phos-phytate concentration in the seeds is reduced when
phorus content in the plant necessary for a the P level in the soil is low. Since numerous
sufficient crop growth are given by Bergmann European soils show a high P status, it can be
(1993), but they are only usable for plant assumed that a large portion of P in feedstuffs
analysis at an early stage of development based on rapeseed meal is phytate. In comparison
(0.35–0.70 g P 100 g−1in the dry matter of the to data derived from field experiments (Mattha¨us
youngest fully developed leaves). For winter et al., 1995), the concentration of phytic acid (IP6)
wheat production in Australia, Batten and in greenhouse-grown seeds was lower for both
Khan (1987) proposed a grain P concentration cultivars, since only cv. Lirajet reached a maximum
of 0.1 g 100 g−1for P-efficient cultivars. Plants phytate content of 2.18 g 100 g−1seed (calculation:
and seeds low in P concentration might have IP6=IP6-P * 3.1615) at the highest level of P
problems with the development of seedlings in supply. In the same way, the phytic acid
concen-early growth stages, particularly when the soil tration in rapeseed meal did not exceed
is poor in P (Rebafka et al., 1993). Since 4 g 100 g−1 (cv. Lirajet, P4). However, the data
various yield-determining components are show that the phytate P portion of total
phos-formed at that time, yield reduction may occur phorus in the seeds is much more variable,
depend-later. This assumption is supported by the reac-ing on the P supply, than Karvanek et al. (1964)
tion of the seed yield on the total phosphorus and Nwokolo and Bragg (1977) had reported
concentration in the seeds. For cv. Bristol, a several decades before.
P
tot concentration of about 0.3 g 100 g−1 seed To improve the digestibility of rapeseed for
seems to be necessary for reaching the high animal nutrition, today, a more or less expensive
yielding area. However, for cv. Lirajet, the treatment of the rapeseed meal is necessary, e.g.
indication of a critical P concentration in the by dephosphorylation using phytase and acid
seeds has to be treated cautiously since the phosphatase (Zyla and Korelski, 1993). However,
variation is much higher than for cv. Bristol. if the phytate concentration in rapeseed is lowered
Furthermore, the results of the present experi-in the future, three more strategies are imagexperi-inable:
Bell, J.M., Shires, A., 1982. Composition and digestibility by rape, leading to a high P export with the seeds
pigs of hull fractions from rapeseed cultivars with yellow or from the fields.
brown seed coats. Can. J. Anim. Sci. 62, 557–565. 3. Selection for genotypes low in IP6-P content
Bergmann, B., 1993. Erna¨hrungssto¨rungen bei Kulturpflanzen. only. There has already been some success in Gustav Fischer, Jena. 835 pp
barley (Hordeum vulgare): two mutations dra- Boever, J.L.de, Eeckhout, W., Boucque, Ch.V., 1994. The possi-bilities of near infrared spectroscopy to predict total-phos-matically reduced the grain phytic acid content
phorus, phytate phosphorus and phytase activity in and increased the inorganic seed phosphorus
vegetable feedstuffs. Neth. J. Agric. Sci. 42 (4), 357–369. (Larson et al., 1998). However, to our knowl- Feil, B., Fossati, D., 1997. Phytic acid in triticale grains as edge, to date, there have been no reports on affected by cultivar and environment. Crop Sci. 37, 916–921. Brassicasp. with a reduced phytate content. We Feuerstein, D., 1991. Zur Verwendung von einheimischen Pro-teintra¨gern in der Tiererna¨hrung. Eugen Ulmer, Stuttgart. assume that the selection of oilseed rape
geno-178 pp types low in IP6-P content does not necessarily
Greiner, R., Jany, K.-D., 1996. Ist Phytat ein unerwu¨nschter require poor soils. It will be possible even on
Inhaltsstoffin Getreideprodukten? Getreide Mehl und Brot soils with an adequate and high P availability, 50 (6), 368–372.
supposing that there is a sufficient genetic varia- Hoffland, E., 1992. Quantitative evaluation of the role of organic acid exudation in the mobilization of rock phos-tion in the oilseed rape breeding material. Some
phate by rape. Plant and Soil 140, 279–289. variation in the IP6-P content of a rapeseed
Karvanek, M., Pokorny, J., Kozlowska, H., Rutkowsky, A., germplasm collection has been reported by
1964. U¨ ber Rapsschrote. 5. Mitteilung: Mineralstoffe. Nah-Thies (1991). For the screening of oilseed rape, rung 8, 675–680.
rapid photometric tests are available (Thies, Larson, S.R., Young, K.A., Cook, A., Blake, T.K., Raboy, V., 1991), and a NIRS calibration could be devel- 1998. Linkage mapping of two mutations that reduce phytic acid content of barley grain. Theor. Appl. Genet. 97, oped (Boever et al., 1994). Raboy et al. (1991)
141–146. reported a positive correlation for winter wheat
Lolas, G.M., Palamidis, N., Markakis, N., 1976. The phytic between phytic acid and protein content. acid–total phosphorus relationship in barley, oats, soybeans, However, the present experiment revealed a and wheat. Cereal Chem. 53, 867–871.
negative correlation of phytic acid with the seed Marquard, R., 1993. Zuchtziele bei Raps im Hinblick auf die Qualita¨t von Rapsschrot. Fat Sci. Technol. 95, 557–561. protein content. This has to be further
investi-Marschner, H., 1995. Mineral Nutrition of Higher Plants. 2nd gated in genetically segregating material for
edition, Academic Press, London. 889 pp phytic acid content.
Mattha¨us, B., Lo¨sing, R., Fiebig, H.-J., 1995. Determination of inositol phosphates IP3-IP6 in rapeseed and rapeseed meal by an HPLC method, Part 2: Investigations of rapeseed and rapeseed meal and comparison with other methods. Fat Sci. Technol. 10, 372–374.
Acknowledgements
Nwokolo, E.N., Bragg, D.B., 1977. Influence of phytic acid and crude fibre on the availability of minerals from four protein We gratefully acknowledge technical assistance
supplements in growing chicks. Can. J. Anim. Sci. 57, by G. Dormann and S. Schubert. Thanks to 475–477.
Wilhelm Ro¨mer for helpful comments on the Raboy, V., Noaman, M.M., Taylor, G.A., Pickett, S.G., 1991. Grain phytic acid and protein are highly correlated in winter manuscript.
wheat. Crop Sci. 31 (3), 631–635.
Rebafka, F.-P., Bationo, A., Marschner, H., 1993. Phosphorus seed coating increases phosphorus uptake, early growth and yield of pearl millet (Pennisetum glaucum(L.) R. Br.) grown
References on an acid sandy soil in Niger, West Africa. Fert. Res. 35,
151–160.
Scheffer, F., Pajenkamp, H., 1952. Phosphatbestimmung in Atwal, A.S., Eskin, N.A.M., MacDonald, B.E., Vaisy-Genser,
Pflanzenaschen nach der Molybda¨n-Vanadin-Methode. Z. M., 1980. The effects of phytate on nitrogen utilization and
Pflanzenerna¨hr. Du¨ngung Bodenk 56, 2–8. zinc metabolism in young rats. Nutr. Rep. Int. 21, 257–267.
Schu¨ller, H., 1969. Die CAL-Methode, eine neue Methode des Batten, G.D., Khan, M.A., 1987. Uptake and utilisation of
pflanzenverfu¨gbaren Phosphats in Bo¨den. Z. Pflanzener-phosporus and nitrogen of bread wheats grown under
Shah, B.G., Giroux, A., Belonje, B., Jones, J.D., 1979. Benefi- Tkachuk, R., 1981. Oil and protein analysis of whole rapeseed kernels by near infrared reflectance spectroscopy. J. Am. Oil cial effect of zinc supplementation on reproduction in rats
fed rapeseed protein concentrate. Nutr. Metab. 23, 275–285. Chem. Soc. 58, 819–822.
Zyla, K., Korelski, J., 1993. In-vitro and in-vivo dephosphoryla-Thies, W., 1991. Determination of phytic acid and sinapic acid
esters in seeds of rapeseed and selection of genotypes with tion of rapeseed meal by means of phytate-degrading enzymes derived from Aspergillus niger. J. Science Food reduced concentration of these compounds. Fat Sci.