A NOVEL GRAPH BASED FUZZY CLUSTERING TECHNIQUE FOR UNSUPERVISED
CLASSIFICATION OF REMOTE SENSING IMAGES
Biplab Banerjee∗, B. Krishna Mohan
Satellite Image Analysis Lab,
Center of Studies in Resources Engineering (CSRE), Indian Institute of Technology Bombay,
Mumbai, India.
{biplab.banerjee,bkmohan}@iitb.ac.in
KEY WORDS:Clustering, Image segmentation, Maximum likelihood classifier, Expectation maximization
ABSTRACT:
This paper addresses the problem of unsupervised land-cover classification of multi-spectral remotely sensed images in the context of self-learning by exploring different graph based clustering techniques hierarchically. The only assumption used here is that the number of land-cover classes is known a priori. Object based image analysis paradigm which processes a given image at different levels, has emerged as a popular alternative to the pixel based approaches for remote sensing image segmentation considering the high spatial resolution of the images. A graph based fuzzy clustering technique is proposed here to obtain a better merging of an initially over-segmented image in the spectral domain compared to conventional clustering techniques. Instead of using Euclidean distance measure, the cumulative graph edge weight is used to find the distance between a pair of points to better cope with the topology of the feature space. In order to handle uncertainty in assigning class labels to pixels, which is not always a crisp allocation for remote sensing data, fuzzy set theoretic technique is incorporated to the graph based clustering. Minimum Spanning Tree (MST) based clustering technique is used to over-segment the image at the first level. Furthermore, considering that the spectral signature of different land-cover classes may overlap significantly, a self-learning based Maximum Likelihood (ML) classifier coupled with the Expectation Maximization (EM) based iterative unsupervised parameter retraining scheme is used to generate the final land-cover classification map. Results on two medium resolution images establish the superior performance of the proposed technique in comparison to the traditional fuzzy c-means clustering technique.
1. INTRODUCTION
Satellite image analysis has attained extensive popularity in the recent past with the advent of several high performance new-age sensors with high spatial and spectral properties. These images are of great importance in diverse application domains including Environmental Monitoring, Urban Planning, Extraction of Re-gions of Interest (ROI) from the Earth Surface etc. These appli-cations require the proper extraction of the land-cover informa-tion from the images for further analysis. Image segmentainforma-tion is a useful tool in this respect (Pal and Pal, 1993) which can ex-tract image regions employing learning based or computer vision based techniques. Clustering is the most popular unsupervised land-cover classification technique cited in the literature (Jain et al., 1999) .
Clustering is inherently an ill-posed problem in the sense that, given a set of data points sampled from many groups, different clustering solutions are equally plausible with no prior knowl-edge about the underlying probability distribution of the data. The clustering algorithms assume some model to describe the data. If the data model does not match with the actual distribu-tion of the data, the clustering result becomes erroneous. More-over, many clustering algorithms require some initial estimations of some of the inherent cluster parameters (mean, variance, etc.) implicitly or explicitly. An improper initialization may lead to a non-reliable clustering outcome.
Clustering methods like K-means, Fuzzy c-means, density based clustering etc. have been used successfully in segmenting remote sensing data in the past (Saha et al., 2012) (Rekik et al., 2006).
∗Corresponding author.
Graph based clustering techniques (Felzenszwalb and Huttenlocher, 2004) are better than these traditional clustering algorithms as graph topology can capture the spatial distribution of the data well which is important in clustering non-linearly separable datasets including remote sensing images. Given a graph of the input im-age pixels, the graph based pixel clustering is posed as the graph-cut problem which aims at removing the set of inconsistent edges from the graph which span different clusters. The only disadvan-tage of the graph based clustering method is its high resource uti-lization in handling large volume of data. The size of the graph Laplacian matrix grows rapidly and it subsequently makes the graph-cut problem even more difficult. In object based frame-work, graph-cut based techniques are preferred as the merging step to merge the regions of an over-segmented image which is much less in number compared to the number of image pixels.
Spanning tree is a reduced, acyclic version of a given graph which is minimally connected in the sense that the removal of any edge from a spanning tree leaves the tree disconnected. Clustering us-ing MST is simpler compared to the approximation algorithms like the spectral clustering or brute-force approaches used to clus-ter a general graph as it is easy to identify the set of inconsistent edges in a spanning tree (Banerjee et al., 2014).
techniques is expected to enhance the results.
Object based segmentation techniques for remote sensing images (Buddhiraju and Rizvi, 2010) first generates an over-segmented version of the original image. In the second level, these large number of small objects are merged properly to obtain a sta-ble segmentation. This hierarchical segmentation scheme allows to explore different regional properties of the small regions in merging them which is not possible in pixel based techniques. It also reduces the uncertainty related to the pixel label assignment which many pixel based techniques are unable to handle properly.
Furthermore, in spite of processing the images at different levels using object based approach, another problem in properly seg-menting remote sensing images arises considering the fact that the spectral signature of many land-cover classes overlap drasti-cally. It is difficult for any clustering technique to cope with this situation. As a remedy to this problem, self-learning classifiers can be employed to refine the segmentation result to some extent. Self-learning essentially means that the training points for model-ing the classifier are selected automatically and the true classifier free parameters are obtained by a sophisticated parameter retrain-ing algorithm like EM (Bruzzone and Prieto, 2001).
With this background, the proposed object-based unsupervised land-cover classification technique of remote sensing images can be summarized using the following steps:
• Obtain an initial over-segmentation of the input multi-spectral image using minimum spanning tree (MST) based cluster-ing uscluster-ing spectral features.
• Perform the proposed graph based fuzzy clustering tech-nique for merging the regions. It gives an estimation of the class-labels of the image pixels.
• Select a set of highly reliable samples per cluster. Con-sidering that a given land-cover class can be modeled by a Mixture of Gaussian (GMM) functions, the iterative EM algorithm is used to obtain a true estimate of the model pa-rameters. EM is initialized from the selected highly reliable samples per cluster.
• The final land-cover map is obtained by an ML classifier built based on the updated parameter sets obtained from the EM stage.
The letter is organized as follows. Section II and Section III de-scribe the self-learning based classification problem in the current context and the proposed solution respectively. Experimental re-sults are discussed in Section IV. The letter concludes in Section IV with references to the future endeavor based on this work.
2. UNSUPERVISED LAND-COVER CLASSIFICATION
OF MULTI-SPECTRAL REMOTE SENSING IMAGES IN THE CONTEXT OF SELF-LEARNING
Let X = {x1,1, x1,2, . . . xR,S} represent a multi-spectral
re-motely sensed satellite image with R ×S pixels where each pixelxr,c∈Rd, i.e., each pixel can be represented usingd
spec-tral bands. LetΩ = {ω1, ω2, . . . , ωN}representN land-cover
classes characterizing the geographical area represented by image
X. Let us also assume thatNis known a priori, whereas the class labels are not. In the context of the Bayes decision rule, a given pixelxr,cis assigned to a specific land-cover classωkaccording
to:
xr,c∈ωk⇔ωl∈Ωargmax(P(ωl)p(xr,c|ωl)) (1)
P(ωl)andp(xr,c|ωl)represent the prior probability and the
con-ditional probability density function for thelthland-cover class, respectively. The training phase of the Bayes classifier consists of estimating the true prior probability and conditional probability function that describe each land-cover class. This requires some highly reliable samples for each land-cover class to be identified for the estimation of the underlying statistical distribution of the class. Since the true distribution of a given class is unknown, a common practice is to fit some known distribution like Gaussian, Poisson function, etc. to characterize the density function of the class.
In remote sensing literature, it is well-accepted to represent each land-cover with a multi-variate Gaussian function. Hence, for each land-cover classωi, the set of parameters to be estimated is θi ={µi,Σi, P(ωi)}whereµiandΣirepresent the mean and
the covariance matrix of the pixels ofωiandP(ωi)is the prior
probability ofωi.
In the current setup, no labeled training data are available. These samples are selected automatically following the application of two graph based clustering techniques hierarchically to the in-put image. The initial values of the model parameters for the PDF’s are estimated from these automatically selected samples and adopted to the entire image space by using the iterative EM algorithm. The ML classifier modeled with the updated parame-ters of (1) is further used to generate final unsupervised classifi-cation result ofX.
3. THE PROPOSED METHODOLOGY
The proposed unsupervised land-cover classification algorithm of multi-spectral remote sensing images has four major steps:
1. Apply MST based clustering to the pixels ofXin the spec-tral domain into K groups where K >> N. K is se-lected to be very large with respect toNto ensure the over-segmentation ofX.
2. A complete graphGis formed considering the regions found in the previous step as nodes. A novel graph-fuzzy cluster-ing algorithm is used further to perform mergcluster-ing of those regions. The output of this step is an approximation of the land-cover classification ofX.
3. A set of highly reliable samples per cluster obtained in the previous stage are identified. ConsideringXas the Mixture of Gaussians, the mean, co-variance matrix and the class prior probabilities for each land-cover class are initialized from this set of samples which are further adapted to the entireXby iterative EM algorithm.
4. An ML based classifier modeled on the updated parameters is used to produce the final classification.
3.1 Obtain the initial over-segmentation ofX
GivenR×Spixels ofX, a minimum spanning treeT{VT, ET}
is constructed considering the pixels as the nodes and the Eu-clidean distance between the pixels as the edge weight connect-ing two nodes usconnect-ing Prims algorithm (Graham and Hell, 1985).
T is undirected, acyclic and the nodes inT are minimally con-nected to each other in the sense that the removal of an edge from
T makesT disconnected. In order to generateKclusters ofX
• Sort the edges ofTin descending order of the corresponding edge weights.
• Delete topKedges. It will generateK+ 1sub-trees where the pixels (nodes) of each sub-tree correspond to a cluster.
• Xis now over-segmented intoKclusters. Several objects of each cluster are likely to be present in the over-segmented image.
• Let us considerRover={R1, R2, . . . , RM}to represent the
regions found from this step.
AsK >> N, a proper merging step is needed to alleviate the problem due to over-segmentation. The proposed graph based fuzzy clustering technique performs this task.
3.2 Region merging using a novel graph based fuzzy
clus-tering
A complete graphG(V, E)is built consideringV = {Ri}Mi=1 where a givenRirepresents the set of pixels belonging to that
particular region. The weight of the edge between a pair of nodes (Ri, Rj)which are Gaussian distributed and(µi,Σi)and(µj,Σj)
defining the mean vectors and the covariance matrices of them, is specified using the Euclidean distance between their centroids. A small distance value indicates better matching between the corre-sponding regions, i.e. both the regions have high probability of belonging to the same land-cover class. Because it is already as-sumed thatXcontainsNland-cover classes, the goal of this step is to clusterGintoNgroups. The proposed clustering scheme is discussed below.
3.2.1 Initialization of the fuzzy membership co-efficient for
each node inG GivenG(V, E), the proposed method first ini-tializes the fuzzy membership of each node (region) inV in the range[0,1]randomly. LetUN×M ={αki}(1 ≤k ≤N,1≤ i≤M)represent the membership of each node(region) in each of theNclusters.
fuzziness. Subsequently, the new values inU are calculated as:
αki= norm used in the traditional case. The distance is defined as the minimum sum of edge weights connecting the nodes representing
Riand the pseudo node representing the centerCkorCj. Gis
modified to accommodate the centroids. The well-known Floyd-Warshall algorithm (Dreyfus, 1969) is used to find the shortest path between all the pairs of nodes inG.1-nearest-neighbor rule is followed next to assign each region to one of the clusters.
These two steps are carried out iteratively until the convergence criteria (discussed below) is satisfied.
3.2.3 Convergence of the clustering algorithm The proposed
method converges when a cost function (F) is minimized. F is composed of two parts:
• Sum of the mean edge weights of every cluster (F1).
• Sum of mean weights of the edges spanning different clus-ters (F2).
Fis defined as:
F= F1
F2
(4)
In order to check for the minimization ofF, the value ofF is evaluated for each iteration of the clustering algorithm. ifF(iter+ 1)≥F(iter)for any iterationiter, then the algorithm stops and the clustering outcome of theiterth
is considered to be the final result.
Algorithm 1 describes the proposed graph based fuzzy clustering scheme.
Algorithm 1 Input:N,{Ri}Mi=1
Output: The grouping of{Ri}Mi=1intoNclusters
1: InitializeUN×Mrandomly in the range[0,1].
2: Construct a complete graphG(V, E)considering the regions in{R}M
i=1as nodes and the Euclidean distance between the centroids of a pair of regions as the edge weight between them.
3: Update the cluster centers and the fuzzy membership ma-trix according to (2) and (3). The distance between a pair of nodes is calculated in accordance with the method discussed in Section 3.2.2.
4: Apply 1 nearest-neighbor ranking to associate each node with one of the clusters.
5: Repeat 3-4 until the cost function in (4) is minimized.
3.3 Identification of the set of reliable samples per cluster
The specific set of samples which are very close to the centroid of the each cluster represents the set of highly reliable samples for the cluster. To select these highly reliable set of samples, the maximum pairwise Euclidean distance among the samples of the cluster is calculated. The specific subset of samples lying within the sphere rooting at the centroid and having a radius ofδ%of the maximum pairwise Euclidean distance have high memberships of belonging to that cluster. Same process is repeated for all the clusters. A smallδprovides more reliable samples. LetTr = {Tr1,Tr2, . . . ,TrN}denote the set of reliable samples for each
cluster found in this step.
3.4 Final land-cover classification using EM and ML
This step produces the clustering ofX using an ML classifier retrained with the EM algorithm. The training of ML classifier requires the estimation of the class prior and the class conditional probabilities. The values of the parameters inθcan be updated using the iterative EM algorithm considering the imageX as a mixture ofNGaussian functions using the equations:
µli+1=
lrepresents thelthiteration. In EM, at each iteration, the esti-mated new values of the parameters provide an increase of the negative log likelihood function until a local maxima is reached. Once the updatedθare obtained for each classωi, the Bayes rule
of (1) is used to classify all the remaining samples ofX to pro-duce the final classification map.
4. EXPERIMENTAL RESULTS
K = 50is considered to over-segment the image initially us-ing the MST based clusterus-ing technique. δ = 25is considered Section 3.3 to point to the highly reliable set of samples for each cluster. Though, results on medium resolution images is exhib-ited here, the proposed technique can be extended to Very High Resolution (VHR) images without any modification.
4.1 Medium resolution Indian Remote Sensing Satellite (IRS)
dataset
The first study area considered is a1024×1024image of Thane area, Mumbai, Maharashtra, India. The image was captured by Indian Remote Sensing Satellite 1C LISS III. The Near Infra-Red (NIR) band of the image is shown in Figure 1 and it has a spatial resolution of23.8m×23.8m.7land-cover classes are identified from the image, e.g. Water, Vegetation, Forest Vegetation, Settle-ments, Swamp, Hilly areas and some other classes. Test samples are collected from these classes for the experimental purpose and the reference class labels are used to assess the performance of the proposed technique. 100samples per class are selected for this purpose. The result of the proposed method is compared with the framework where the proposed graph based fuzzy clustering is replaced by FCM.
The scatter plot of the reference test data along with the actual class labels are shown in Figure 2. The scatter plot for the pro-posed method and the propro-posed framework with FCM are de-picted in Figures 3-4.
It can be seen from the scatter plots that, the classification result of the proposed method agrees well with the ground reference except for a few pixels of the Settlement class which are wrongly classified to Some other classes, , i.e.the producer accuracy of the proposed algorithm for the set of test samples is100%for6 classes. For the class tagged as some other classes, the Producer accuracy is99%.
On the contrary, FCM is unable to detect the Water class. As observed from Figure 4, Water and Forest Vegetation classes are merged. This is the problem of using the Euclidean distance in the feature space. The proposed graph-fuzzy based clustering ap-proach removes the problem entirely. The application of a super-vised ML classifier on a set of reliable training samples produces a generalization accuracy of100%on the test samples. The pro-posed method almost touches that upper bound.
Figure 5: The band4of the the simulated Sardinia Dataset
4.2 Sardinia dataset
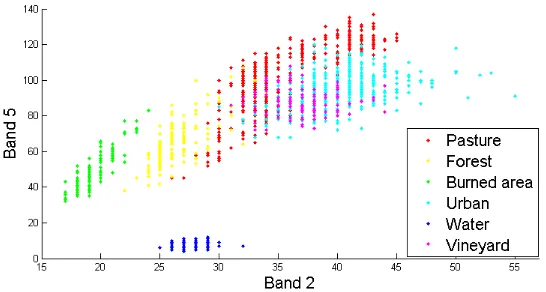
The second study area considered in the experiments is acquired by the Thematic Mapper (TM) sensor of the LandSat 5 satellite in September 1995. Though the image consists of7bands but in the experiments conducted, band6has been neglected due to its lower geometrical resolution. The selected test site is a section of412×493pixels of a scene including the area surrounding the Lake Mulargia on the Island of Sardinia (Italy). Figure 5 de-picts the band4of the image.5natural land-cover classes can be identified from the image, i.e. Pasture, Forest, Urban, Water and Vineyard. A burned area class has additionally been simulated in the image to increase the complexity (Bahirat et al., 2012). Test samples are available for all the classes and the corresponding reference map is used to assess the clustering accuracy. The scat-ter plot of the test samples with the reference map is shown in Figure 6.
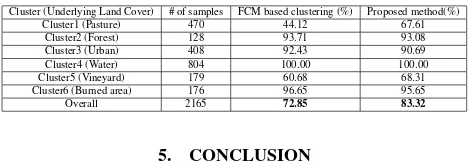
It can be observed from the scatter plot that Pasture, Vineyard and Urban classes are highly overlapped in all the spectral bands. FCM with Euclidean distance is unable to produce a good clus-tering result in this respect. However, certain improvement in the overlapped classes in term of the Producer accuracy is no-ticed with the proposed technique. For Pasture, the proposed method has an enhancement of13%in the classification accu-racy compared to the result of FCM. Similar enhancement is also observed for Vineyard class (8%). The overall producer accu-racy of the proposed technique is83.32% which is better than the result with the FCM clustering (72.85%) and is close to the classification performance of a supervised ML classifier trained on some manually selected set of samples (87.45%).
Table 1: Comparison of the class-wise Producer accuracies on the Sardinia Dataset
Cluster (Underlying Land Cover) # of samples FCM based clustering (%) Proposed method(%)
Cluster1 (Pasture) 470 44.12 67.61
Cluster2 (Forest) 128 93.71 93.08
Cluster3 (Urban) 408 92.43 90.69
Cluster4 (Water) 804 100.00 100.00
Cluster5 (Vineyard) 179 60.68 68.31
Cluster6 (Burned area) 176 96.65 95.65
Overall 2165 72.85 83.32
5. CONCLUSION
Figure 1: The NIR band of the IRS Mumbai image
Figure 2: The scatter plot of the test samples with reference labels for the IRS data
Figure 3: The scatter plot of the test samples for the proposed method for the IRS data
Figure 6: The scatter plot of the test samples with the reference labels for the Sardinia data
correctly predict the class labels of the pixels with crisp mem-bership values. Considering that the spectral properties of many land-cover classes overlap significantly, a EM+ML based self-learning classifier is used in the post-processing step to generate the final classification map. The performance of the proposed technique is close to the one produced by the supervised classifier trained on the manually selected set of labeled samples without the need to work with costly training samples. The application of ensemble clustering technique in this framework is the future mode of research.
6. ACKNOWLEDGEMENT
The authors are grateful to Prof. Lorenzo Bruzzone, University of Trento for sharing the Sardinia dataset.
REFERENCES
Bahirat, K., Bovolo, F., Bruzzone, L. and Chaudhuri, S., 2012. A novel domain adaptation bayesian classifier for updating land-cover maps with class differences in source and target domains. Geoscience and Remote Sensing, IEEE Transactions on 50(7), pp. 2810–2826.
Banerjee, B., Varma, S., Buddhiraju, K. M. and Eeti, L. N., 2014. Unsupervised multi-spectral satellite image segmentation com-bining modified mean-shift and a new minimum spanning tree based clustering technique. Selected Topics in Applied Earth Ob-servations and Remote Sensing, IEEE Journal of 7(3), pp. 888– 894.
Bruzzone, L. and Prieto, D. F., 2001. Unsupervised retraining of a maximum likelihood classifier for the analysis of multitemporal remote sensing images. Geoscience and Remote Sensing, IEEE Transactions on 39(2), pp. 456–460.
Buddhiraju, K. M. and Rizvi, I. A., 2010. Comparison of cbf, ann and svm classifiers for object based classification of high resolu-tion satellite images. In: Geoscience and Remote Sensing Sym-posium (IGARSS), 2010 IEEE International, IEEE, pp. 40–43.
Dreyfus, S. E., 1969. An appraisal of some shortest-path algo-rithms. Operations research 17(3), pp. 395–412.
Felzenszwalb, P. F. and Huttenlocher, D. P., 2004. Efficient graph-based image segmentation. International Journal of Com-puter Vision 59(2), pp. 167–181.
Graham, R. L. and Hell, P., 1985. On the history of the minimum spanning tree problem. Annals of the History of Computing 7(1), pp. 43–57.
Jain, A. K., Murty, M. N. and Flynn, P. J., 1999. Data clustering: a review. ACM computing surveys (CSUR) 31(3), pp. 264–323.
Pal, N. R. and Pal, S. K., 1993. A review on image segmentation techniques. Pattern recognition 26(9), pp. 1277–1294.
Rekik, A., Zribi, M., Benjelloun, M. and Ben Hamida, A., 2006. A k-means clustering algorithm initialization for unsupervised statistical satellite image segmentation. In: E-Learning in Indus-trial Electronics, 2006 1ST IEEE International Conference on, IEEE, pp. 11–16.