POLARIMETRIC SIGNATURES IDENTIFICATION FOR DIFFERENT FEATURES IN
RADARSAT-2 POLSAR IMAGE: A CASE STUDY OF HALAYIB AREA, EGYPT
Ayman H. Nasr and Hind Z. Abdelhamid
National Authority for Remote Sensing and Space Sciences (NARSS), 23 Joseph Tito st., El-Nozha El-Gedida, P.O. Box: 1564 Alf-Mascan, Cairo, Egypt
[email protected], [email protected]
KEY WORDS: Radarsat-2 PolSAR, Polarimetric signatures, Pauli decomposition, Co-polarization and cross-polarization signature.
ABSTRACT:
In fully polarized SAR (PolSAR) data the returned signal from a target contains all polarizations. More information about this target may be inferred with respect to single-polarization. Distinct polarization separates targets due to its different backscattering responses. A Radarsat-2 PolSAR image acquired on December 2013 of part of Halayib area (Egypt) was used in this study. Polarimetric signatures for various features (Wadi deposits, Tonalite, Chlorite schist, and Radar penetrated areas) were derived and identified. Their Co-polarized and Cross-polarized signatures were generated, based on the calculation of the backscattered power at various ellipticity and orientation angles. Graphical 3D-representation of these features was provided and more details of their physical information are depicted according to their different polarization bases. The results illustrate that polarimetric signatures, obtained due to factors like surface roughness, dielectric constant and feature orientation, can be an effective representation for analyzing various features. The shape of the signature is significant and can also indicate the scattering mechanisms dominating the features response.
1. INTRODUCTION
Polarimetric SARs provide significantly more data relative to conventional radars that record backscatter only at the linear polarizations. They allow measurement of the physical characteristics by using scattering mechanism between electromagnetic (EM) wave and the targets (Ulaby and Elachi, 1990) and (Zebker and van Zyl, 1991). They have been also successfully employed to classify and separate a wide range of terrain types. Fully polarimetric radars record the complete four coherent channels (HH, VV, HV, and VH) and retain the phase information. The “H” indicates horizontal and “V” indicates vertical transmit or receive polarization. The phase differences can result from a time delay when the phase velocity of H and V waves differs within the target. The total power is the sum of the power recorded for each of the linear polarizations (HH, VV, HV, and VH) (McNairn et al. 2001).
Polarimetric signature plot is a general approach to visualize the signature that captures many scattering characteristics of the ground cover targets. It is a 3D-representation of polarimetric information in various polarization bases (Jafari et al. 2014). It is usually displayed assuming: the identical transmit and receive polarizations (co-polarized) and the orthogonal transmit and receive polarizations (cross-polarized) of the wave intensity at all possible ellipticity and orientation angles. The shape of these plots is significant and
can indicate the scattering mechanisms (surface, double-bounce, or multiple/volume) dominating the target response. Ellipse geometric elements are two dimensions, and target response is the third dimension represented in three dimensional coordinate system (Van Zyl et al. 1987). The shape of the Polarization signatures of the same target observed in different time should resemble each other in general if there are no changes; otherwise, they should be different. In some researches (Durden et al, 1989), (De Grandi et al, 2003), (Nunziata et al, 2011), and (Jafari et al. 2014).it has been used as a tool for analysis and assessment of various targets.
1989) and (Ray et al. 1992) found that pedestal height was related to surface roughness with increases in roughness resulting in higher pedestals.
2. AQUIRES DATA AND THE STUDY AREA
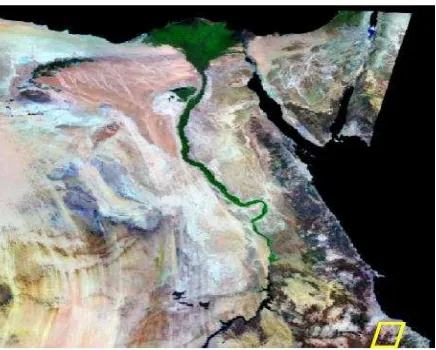
A Radarsat-2 PolSAR image acquired on December 2013 was used in conducting this study. It was delivered as a Single-Look Complex (SLC) Standard Quad Polarization, Q6 in compressed format. The major characteristics of the image are depicted in Table 1. The study site selected is part of Halayib area located in south eastern desert of Egypt, with coordinate of 22oβ9ʹ to ββo09ʹ N, and γ5o4γʹ to γ6o0γʹ E, as shown in
figure 1. A variety of different features were considered in this study. These include (Wadi deposits, Chlorite schist, Tonalite, and Radar penetrated areas). Reference data was collected from geological maps and ETM-8 images to verify the identification of these features. The Software used was the freeware Polarimetric SAR Data Processing and Educational Toolbox; (PolSARpro).
Table 1. Major Characteristics of the Used Radarsat-2 PolSAR Image
3. METHODOLOGY
In order to interpret and retrieve the feature information of polarimetic SAR data, pre-processing is of critical importance (Lee, et al. 2001). The first step is the generation of × scattering matrix [S] that measures the complete information of the surface features. This is followed by deriving the × coherency matrix [T3] and the polarimetric parameters. Once the scattering matrix and the covariance matrix are known, one can synthesize the received power for any transmit and receive antenna polarizations. Finally, speckle filtering and geometric correction (geo-referencing) are calculated for interpreting the image correctly. After completion of this phase, the coherency matrix is decomposed based on the Pauli basis for deriving the polarimetric signature for each surface feature on the study area. Figure 2 shows the flowchart of the different pre-processing steps for polarimetric signature retrieval.
Figure 2. Flowchart of the different pre-processing steps for polarimetric signature retrieval.
Figure 1. The study area (yellow rectangl
3.1 The Scattering Matrix
The original data is in Single Look Complex (SLC) format. When the incident radar signal interacts with the earth feature on horizontal or vertical wave, the backscatter of the radar signal is the contribution of both vertical and horizontal wave. Therefore, the reflected backscatter can be represented by scattering matrix as given in equation 1:
[S] = [SHH SHV
SVH SVV] (1)
Each pixel in a polarimetric radar image is represented by this 4-component scattering matrix. Each component is a complex value which has magnitude and phase of 4-polarimetric channels. The diagonal elements of the scattering matrix are RADARSAT-2 (SLC) Image
Scene Date and time 18-12-2013, 03:38:58
Acquisition Type, beams Standard Quad Polarization, Q6
Polarizations and Pass-Direction HH VV HV VH & Descending
Incidence Angle (units: deg) 24.5
the co-polarized information while off-diagonal elements represent the cross- polarized information (Nandan, 2012).
3.2 Coherency Matrix
Scattering matrix is used to represent the backscatter of the coherent or pure target like urban area. In contrast, the natural target which partially polarized waves is very difficult to be realized using scattering matrix. To describe the distributed scatters, the second order matrices are used. The second order matrices are derived from the scattering matrix. In case of reciprocity condition in which ��� = ��� then the vectorized format of the scattering matrix is given in form of lexicographic basis and Pauli basis (Nandan, 2012).
In case of Pauli format:
Speckle appearance in radar images is caused by the coherent interference of waves reflected from many elementry scatters (Lee and Pottier, 2009). Speckle can be reduced using multi-look observations, which can be achieved during the image construction, or a speckle-reduction filter performed by the user. In order to achieve optimal speckle reduction in imagery refined lee filter was used. It was used since it has proven to be good in preserving polarimetric information for distributed targets. We tested different filter sizes and the best results were achieved by using a 7× 7 filter. It is based on statistical correlation between channels without introducing cross talk (Niu et al. 2011), (Salehi et al. 2013).
3.4 Geometric Correction
The most significant step in SAR data pre-processing is the geometric correction. The original measure of SAR system is the slant range so, the image is recorded in slant range system (Lee and Pottier, 2009). With the slant range the image can’t be visually interpreted because each pixel is compressed and
can’t also be display with the correct size. So, it needs to be converted into ground range. Geometric correction transfers
model (DEM) of the study area was applied during performing the geometric correction. The study area is generally flat so, the terrain effects of layover and shadowing are neglected. MapReady tool has been used in conducting this part. It is a Remote Sensing Tool kit developed by Alaska Satellite Facility and embedded in the PolSARpro software.
3.5 Feature Extraction
The main objective of the decomposition of the matrix representation (e.g. coherency or covariance matrices) is extracting parameters that carry information about the structural and compositional contents of the ground target or land cover from the measured backscatter. The matrix can be first order (e.g. the scattering matrix in equation 1) or second order (e.g. the coherency matrix in equation 3). The most commonly-used decomposition is that of the scattering matrix which is known as Pauli decomposition. It decomposes the scattering matrix for mono-static case into three components for studying the surface properties which are represented as single-bounce (SHH + SVV), double-bounce (SHH – SVV), and volumetric (SHV) scattering mechanisms (Huynen, 1965), (William, 2012). These components are represented by the Pauli vector as in equation 2.
3.5.1 Pauli decomposition
The Pauli decomposition parameters are the elements included in the vector of equation 4. The first, second and third element in the vector represent the single-bounce, double-bounce and volume scattering, respectively. This decomposition is the most common and more appropriate for coherent targets (with identifiable structures) compared to other coherent decomposition methods. The Pauli decomposition is the most effective and useful for exposing natural targets, but not ideal for highlighting man-made targets (Zhang et al. 2008). The scattering matrix [S] can be written as:
[S] = [SHH SHV
Using Pauli decomposition, often α, , and components are represented as blue, red, and green respectively for visual interpretation. The polarization color composite of the used image in Pauli basis is displayed in figure 4.
3.5.2 Polarimetric signature
polarization so that different targets show different polarization signatures (Arai, 2011). Although many targets can produce similar plots, the shape of the plots as well as the pedestal height, provide clues about the type of scattering dominant from the target. The polarimetric signatures are very sensitive to the orientation of the target relative to the radar line of sight (Schneider et al. 2005). The angle of the semi-major axis with the horizontal axis (x-axis) is the orientation
angle ( o) ranging from 0o to 180o. Ellipticity defines the oval
shape of the ellipse shown as ( o) as depicted in figure 3.
Linear polarizations have an ellipticity angle of 0o, while
circular polarizations have ellipticity angles of 45o. Although
all orientations are represented in the plot, the commonly used linear polarizations have orientation angles of 0o (H) or 90o (V)
(McNairn et al. 2001). The polarization signature σo is
represented by the following equation 5:
� = Κ JΤ Μ J = � , , , (5)
Where K = constant.
Jr, Jt =Stokes vectors at receiver,
transmitter, respectively.
, = ellipticity and the orientation angles of the electric field vector.
With the help of the geological map and the ETM-8 image, we choose areas within the Radarsat-2 image for different types of terrain, as illustrated in figure 4. The polarization signature for
each resolution element (pixel) represents the sum of the polarization signatures of each object in this pixel.
Figure 3. Definition of polarization signature
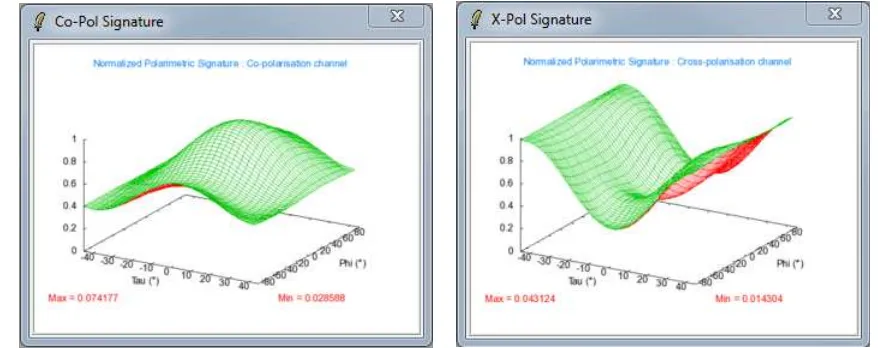
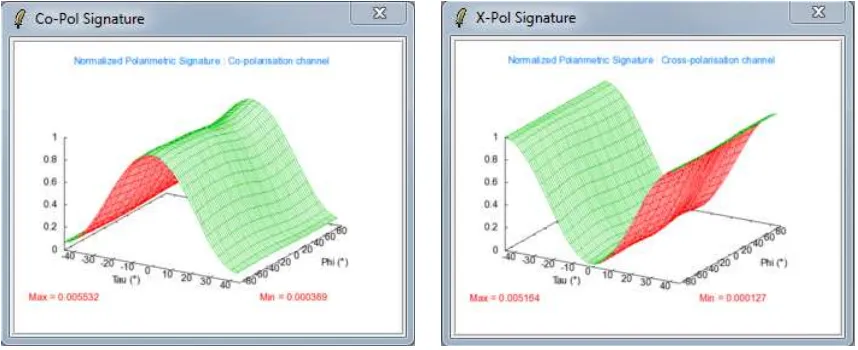
The signatures can be computed on a pixel basis or average over a region that captures the particular feature. Single pixel basis was used for the generation of the various features polarization signatures ((a) Wadi deposits, (b) Chlorite schist, (c) Tonalite, and (d) Radar penetrated areas). Co-polarization and Cross-polarization signature plots were extracted for these pixels. The following figures (5, 6, 7 and 8) display the calculated polarimetric signatures (backscattered power) of these major features normalized to the intensity range 0-1 in lin format (Mesh representation).
(a) (b)
Figure 4. (a) Geological map of the study area, (b) Radarsat-2 PolSAR image in Pauli basis
(a)
(b)
(d)
Figure 5. (a) Wadi deposits polarimetric signature
Figure 6. (b) Chlorite schist polarimetric signature
Figure 8. (d) Radar penetrated areas polarimetric signature
4. RESULTS AND DISCUSSIONS 5. CONCLUSION
There are a wide range of SAR parameters that can be extracted from PolSAR data. Polarimetric signature introduces new concepts for different targets identification. (de Matthaeis et al. 1994) describe the co-polarization plots as containing the imprinting by the various scattering mechanisms (surface, double-bounce, and multiple/volume). It is clear from the previous figures that, the calculated polarization signatures are more or less different from each other. The cross-polarized response behaves in an exactly opposite manner to the co-polarization response. The relative similarity between the two classes Chlorite schist and Tonalite was predictable due to the same physical properties and the influence of surface roughness. Their co-polarization and cross-polarization signatures show some peaks corresponding to the maximum backscattered power. Their pedestal height were (0.52, 0.4) respectively, indicating moderate amount of randomly oriented backscatter (i.e. rough surface scattering mechanisms). It is also clear that, Wadi deposits and Radar penetrated areas have the same behavior in changing polarization bases. In the sense, for both co-polarization and cross-polarization signatures, there is not much variation in the backscattered power response ranging over various ellipticity and orientation angles. Also there is low amount of randomly oriented backscatter (i.e. minimal depolarization) that can be viewed from their low pedestal heights (≈ .07), indicating that surface scattering is dominant. These features are not rough enough to cause multiple or volume scattering. Therefore, this result confirms that surface scattering is typical of areas that appear smooth relative to the Radar wavelength.
The polarimetric signatures of various features in Radarsat-2 PolSAR image of part of Halayib area (Egypt) were generated and studied. Several types of scattering are usually present within distributed features, although these features often have a dominant scattering mechanism. The polarization signature plots clearly differentiated these features based on their type of scattering. Analysis results demonstrated that rough surfaces like Tonalite, Chlorite schist cause greater multiple scattering as compared to the smoother surfaces like Wadi deposits and Radar penetrated areas. Shape of the co-polarization, cross-polarization signature plots and the pedestal heights indicate and provide information on the dominant scattering mechanism. The pedestal height was also unique for each of the features. Smooth surfaces have low backscattered power values. Rougher surfaces have more multiple scattering and higher pedestal heights. This confirms the sensitivity of pedestal height to multiple and volume scattering. The results illustrate that polarimetric signatures of various features can be an effective criteria for analyzing the different features.
ACKNOWLEDGMENT
REFERENCES
Arai, K., 2011. Polarimetric SAR Image Classification with High Frequency Component Derived from Wavelet Multi Resolution Analysis: MRA. (IJACSA) InternationalJournal of Advanced Computer Science and Applications, Vol. 2, No. 9.
De Grandi, G., Lee, J. S., Schuler, D., and Nezry, E., 2003. Texture and speckle statistics in polarimetric SAR synthesized images. IEEE Transactions on Geoscience and Remote Sensing, vol. 41, pp. 2070-2088.
de Matthaeis, P., Schiavon, G., and Solimini, D., 1994. Effect of scattering mechanisms on polarimetric features of crops and trees. International Journal of Remote Sensing, vol. 15, pp. 2917–2930.
Durden, S. L., Van Zyl, J. J., Zebker, H. A., 1989. Modeling and observation of the radar polarization signature of forested areas. IEEE Transactions onGeoscience and Remote Sensing,
vol. 27, pp. 290-301.
Huynen, J. R., 1965. Measurement of the Target scattering matrix. Proceedings of the IEEE. vol. 53, pp. 936-946.
Jafari, M., Maghsoudi, Y., Valadan, Z. M. 2014. Analyzing Polarimetric Signature for Different Features in Polarimetric SAR Data. IGARSS, IEEE, pp. 2782-2785.
Lee, J. S., Grunes, M. R., and Pottier, E., 2001. Quantitative comparison of classification capability: Fully polarimetric versus dual and single-polarization SAR. IEEE Transactions on Geoscience and Remote Sensing, vol. 39, pp. 2343–2351.
Lee, J. S., and Pottier, E., 2009. Polarimetric radar imaging: from basics to applications. Taylor & Francis Group, New York.
McNairn, H., Duguay, C., Brisco, B., and Pultz, T.J. 2001. The effect of soil and crop residue characteristics on polarimetric radar response. Remote Sens. Environ., vol. 80, pp.308-320.
Nandan, V., 2012. Retrival of volume scatterer information using three - components decomposition model, based on compact polarimetry. M.Sc. Thesis. Reading University: Twente.
Niu, C., Zhang G., Zhu, J., Liu, S., and Ma, D., 2011.
Correlation coefficients between polarization signatures for evaluating polarimetric information preservation. IEEE Geosci. Remote Sens. Lett, vol. 8, pp. 1016–1020.
Nunziata, F., Migliaccio, M., and Gambardella, A., 2011. Pedestal height for sea oil slick observation. IET radar,sonar & navigation, vol. 5, pp. 103-110.
Ray, T. W., Farr, T. G.,and van Zyl, J. J., 1992. Polarization signatures for abandoned agricultural fields in the Manix Basin area of the Mojave Desert: can polarimetric SAR detect desertification?. In: Proceedings of the International
Geoscience and Remote Sensing Symposium (IGARSS ’92),
Houston, pp. 947– 949.
Salehi, M., Sahebi, M. R., and Maghsoudi, Y., 2013. Improving the accuracy of urban land cover classification using radarsat-2 polSAR data. IEEE journal in selected topics in applied earth observations and remote sensing. vol. 7, pp. 1394 – 1401.
Schneider, R. Z., Papathanassiou, K., Hajnsek, I., and Moreira, A., 2005. Polarimetric interferometry over urban areas: Information extraction using coherent scatterers. In Proc. IEEE IGARSS, Seoul, Korea, Jul. 25–29, pp. 1089–1092.
Ulaby, F. T., Elachi, C., 1990. Radar Polarimetry for Geoscience Applications. Artech House Inc., Dedham.
Van Zyl, J. J., 1989. Unsupervised classification of scattering behavior using radar polarimetry data. IEEE Transactions on Geoscience and Remote Sensing, vol. 27, pp. 36–45.
Van Zyl, J. J., Zebker, H. A., and Elachi, C., 1987. Imaging radar polarization signatures: Theory and observation. Radio Science, vol. 22, pp. 529-543.
William, D. H., 2012. Exploration of data fusion between polarimetric radar and multispectral image data. MSE Thesis. Reading University: California State University.
Zhang, L., Zhang, J., Zou, B., and Zhang, Y., 2008. Comparison of methods for target detection and applications using polarimetric SAR image. Progress in Electromagnetic Research, PIERS Online, vol. 4, pp. 140–145.