1.
IntroductionIn general, urban commuting management refers to using different effective factors to achieve predetermined goals. As one of the most vital parameters of the area, "time management" which means controlling time and activities until certain purposes and goals are achieved in a certain time interval, is a critical issue. Optimal time management can decrease time waste and people's mental involvements. For this purpose, it is necessary for each dynamic user in urban commutations to know which vehicles, including transport (bus, urban railway, taxicab, etc.) or passenger car, with what time and cost, are able to traverse the path from origin to destination.
Obviously, the implementation of this requires using large amounts of dynamic data on place and time of the passengers, origin and destination places, and the existing transport infrastructure facilities. So, use of mobile technology as an efficient bed for collection, representation, and analysis of spatial and temporal information in the form of "Context Aware" not only increasingly encourages and motivates people, but also, when its capabilities combine with various sensor networks, can be an effective step taken in speeding information exchange.
Since mobile is a cheap, public, and available means, and in the form of geographical information system, it can receive the surrounding changes and update itself, its combination with sensors will make providing an efficient system for optimal commuting time management. The most important problem of using the system for time management is the necessity for support of two systems of GPS and GPRS by the user's
communication hardware (mobile) in order to locate and transfer the data. Most often, because satellite positioning system does not function in tunnels and indoor spaces, due to its low accuracy, and lack of necessary facilities in the mobile used, permanent application of the above systems is not easily possible. In this paper, aiming at providing an proper system for urban commuting time management in Mashhad, each user, by using SMS and introducing some of his/her mental priorities to the system, will be able to select the best option depending on the timing of the available public transport system.
2. Literature Review
One of the important factors affecting development of urban society is to increase operational efficiency with the aid of time management by citizens. Currently, decision-making on this area has been made in an experimental and uncertain form and includes a lot of wasted time (Grzybowska and Barcelo, 2012). Wasted time is the time when, due to the governing environmental conditions such as waiting for the public transport to reach the station, and frequent stops because of high volume of vehicles, the passengers are prevented from moving in the path (Haag, 2001, Yue and Ren, 2011). In order to decrease the wasted time, modeling of space-time relationship between the effective factors and their combination in urban commutations requires a system which can analyze the environmental changes and complexity and multiplicity of factors using integrated functions, with its components' speed, accuracy, and flexibility. (Vande Walle and Steenberghen,
Cooperating Mobile GIS and Wireless Sensor Networks for Managing Transportation
Infrastructures in Urban areas
R.Shad a,
*, N. Abazari b
, A. Alizadeh b
, M. Choghooni b
a
Rouzbeh Shad, Assistant professor, Civil Department, Ferdowsi University of Mashhad, Mashhad,
Dept. of Civil Engineering, Ferdowsi University of Mashhad (International Campus), Mashhad, Iran-
Abazari_ Navid @Yahoo.com
KEY WORDS: Mobile GIS, Time management, Bus lines, Taxi network.
ABSTRACT
Time management is a major subject which, in order to optimize trip conditions, emphasizes on interpreting processes and classifying
individual's information. In this paper, with the aim of providing an optimal system for urban commuting in proper time in Mashhad,
each user using SMS and introducing some of his/her mental priorities to the system, will be able to select the best option depending
on the timing of movement of the available public transport system. The present study adopts a newly developed method of time
management which is evaluated for urban transportation considering dynamic conditions of a spatial database. For this purpose,
regarding time management, processed data such as bus lines, taxi networks, and the subway system are combined in a spatial
2006) Recently in the studies conducted, the components such as positioning system, wireless communications, sensor-based technology, and decision-making support systems are considered to provide an accountable and spatial-temporal infrastructure in metropolises (Gong, Chen and Bialostozhy, 2012). For example, to solve traffic problems in Seoul, it was attempted to provide the users with the possibility of better and more updated options including the road and type of vehicles used (Kim and Dickey, 2006). This instantaneous information is given to the users of public transport system through showing waiting time and the next destination in the digital panel of the station, and drivers of the passenger cars are informed about traffic status of the streets ahead through message boards. This way, by using a positioning system and a network of sensors, spatial position of the public transport vehicles are specified at any moment and provided to the traffic experts through web. Another big city which provided an online web-based traffic information to decrease urban commuting time and develop transport system is Abu Dhabi (Abu Helwa, 2011). In this city, to provide reliable information and services to the related departments and users, a public portal called DARB and an internal portal known as TRANS GEO were operated. TRANS GEO is an advanced tool providing effective applications to the experts of transport system for evaluating and analyzing the reports. While DARB, as the main gate, is considered for sharing the maps and services with the citizens and tourists of United Arab Emirates. The following is some of the transport services provided in DARB portal to the public.
-
In case where the road is closed because of repairs, it helps the occupants of the passenger cars to find the shortest road.-
By selecting their origin and destination, the users can be informed of the tourism and recreation areas existing in the road.-
With the aid of this portal, the tourists are able to find the driving paths toward airports and passenger ferry terminals, and he informed of timing of their movement.Of the obvious disadvantages of this system is that the availability of Internet, which, regardless of its cost, requires desired infrastructures, while this decreases its widespread use. In this respect, even in the presence of Internet facilities, a great deal of information is not provided to the users for time management.
Another important problems of using the above system is to use GPS to connect the information on transport and commutations to physical places. Because use of GPS is only possible for those users whose mobile phones can support GPS and GPRS outdoors. What distinguishes this paper from earlier ones is the use of communication infrastructures which, in addition to being cost-effective and highly accurate in all regions, are available to the users without needing special facilities. In most third world countries and developing countries, use of GPS along with the systems based on information exchange technologies is not successful due to lack of efficient and strong hardware and software infrastructures. Thus, to locate the
vehicles, sensor networks (token method) which have more efficiency and less error as well as the short message system (SMS) with the capability of online providing are used. Short message system has the facilities such as being public, and usable in all indoor regions, and being supported by all kinds of mobile phones.
3. Theory and concepts
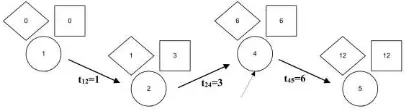
To represent the time, a chart (Gantt Chart) in which the vertical axis is the activity and the horizontal axis is the time, can be used (Jia et al, 2007). In onset and end of such activities as the movement of the bus, subway train, and taxicab in the activity-time chart, virtual activity-time interval called "Slack" is defined. Slack is the total time duration on which each activity can be delayed in onset and end, without any disruptions to total time duration of the passenger transport in the bus line. For example, if the activity D has no slack, it means that no delay in starting it is allowed (critical activity) (Guerriero and Talarico, 2010). In Figure. 1, the bus stations are shown in the form of some circles with the numbers of 1, 2, 4, and 5. Diamond and square symbols show start time and end time of each event, respectively. In this figure, passenger transportation from the node 1 to the node 2, as well as from node 2 to node 4 has two hours of slack, indicating that each of these two activities may be delayed through two hours, without the path becoming critical. Hence, in the said figure, tij is the same connection weights of the network, known as the duration of the activity from i to j.
Figure. 1 Passenger transportation network along with activities and events
Kettschau and Obernostere, 2004). Each cell in GSM network is divided, in terms of dimensions, into five groups including macrocells, microcells, piccolos, femtocells, and umbrella cells. The coverage area of each cell, according to the environment in which it places, is defined differently.
After gathering spatial and temporal data, sensor networks transmit the information through a mathematical algorithm to the main station (processing unit). The processing unit which is responsible for analyzing spatial and temporal data, communicates with the user by means of GSM waves and mobile phone. In addition, by using the transmitter and receiver, this unit is able to control the sensor network. In this part, the information received from the user and sensor network about travel origin and destination, vehicle location, volume of vehicles passing, servicing level of the roads, level of demand for public transport vehicles, and safety system are analyzed by GIS. Accordingly, time and cost of traveling in case of using each type of public transport vehicle including urban railway, bus, and taxicab, are transmitted to the passengers via SMS. In this way, by providing the map of public transport stations, the user selects the nearest station as the origin, and transmits it along with the destination to the system via SMS. In response to the user, the system determines the spatial location of the public transport vehicles and the time needed for reaching the destination, and transmits the following information to the user.
-
Commuting time with each of three types of public transport vehicles including taxicab, bus, and urban railway together with the cost of each.-
The time needed by a vehicle to reach the station, in order to determine the time on which the user walks to the origin.-
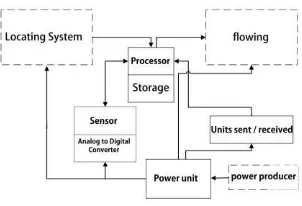
Determine the path in case of combined use of two types of vehicles together with its time.As a result, aware of the necessary information, passengers are able to make optimal and reliable decisions for their plannings. In this system, a sensor consists of four basic parts including: sensor unit, processing unit, transmitter-receiver unit, and power unit (Wang, 2004), (Heinzelman, 2000). In Figure. 2, the main components of a sensor are shown.
Figure. 2 Main components of a sensor
4. Implementation
In Mashhad, urban commutations are made by using various vehicles including passenger cars, bus, taxicab, and urban
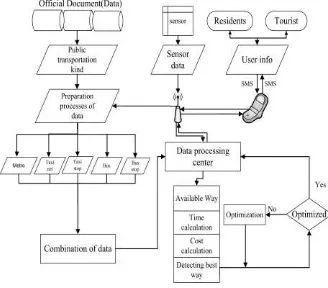
railway. By defining this information in GIS environment, the necessary data can be inserted into the system, and favorable options can be extracted. The sensor used in buses and taxicabs along with sensors installed in the stop stations (bus / taxicab) are able to receive the information on the vehicle and transfer it to the center (Figure. 3).
Figure. 3 Exchanging data between sensor and mobile phone
4.1 Study Area
In this paper, the pilgrimage city of Mashhad, which accepts more than 32 million pilgrims a year, is selected as the study area. According to Census of Population and Housing in 2006, this city with a population of 2,410,800 people is the second most populous city of Iran. The city is well served with 2460 buses of which 2141 ones are active and the rest passive. In addition, there are currently 6399 taxicabs under supervision of the Taxi Company and 1456 wireless taxicabs transport passengers and tourists. In addition, there are 120 active taxicabs, and in order to implement and effectively operate the system, it is necessary for all of them to be equipped with the transmitter-receiver sensor.
4.2 Information Processing and Documentation
During data preparation stages, the whole information collected from the sensor, ground-based observations (user) and graphic data (map, photo, and image) are made uniform and converted into digital form. after controlling input information and removing the errors, numerical data are produced and transmitted to the processing unit until, while performing specific functions, a model of reality is established. so, in this system, predicting the status in future will be possible according to the changes of the status quo.
Much of the collected information change depending on environmental and social conditions. Therefore, in designing this system such stages as recognition of spatial situation, introduction of time axis in the traffic model of transport system as a dimension, making changes and corrections automatically (so that the uniformity and integrity of total system and the information layers do not change) and finally reviewing the model and analyzing the optimization of the results are included.
the information receiving sensor transmits the bus number to the central station. In the central system, the bus number shows the origin and destination of the bus path. So, within the time defined, it is specified where (station) each bus or taxicab locates. In this way, by using the GPS, the system can calculate almost accurately the waiting time for each station. In addition, the city's traffic data is provided to the GIS by using traffic cameras, and according to it, the necessary reports and products are given to each user.
Figure. 4 Bar chart obtained from (one hour) field measurements of the number of passing vehicles at 7:00 in the
morning, June 2, 2012
Figure. 5 Showing general changes in the number of passenger cars from (one hour) field study at 7:00 in the morning, June 2,
2012
Figure. 6 Output changes from the sensors in Khayyam junction in Mashhad on July 13, 2012
4.3 Results
In this system, the users, the organizational documentations and the sensors are the main references receiving the information, in which transfer is made from the references to the information exchange center by means of wireless waves and GSM. In this center, the information and maps received are standardized and, with their format changed in a desirable form, are prepared to be inserted into GIS.
After this stage, all data are combined in the processing unit and such functions as the shortest path and lowest cost are operated over them. If the results are optimal, they are transmitted to the information exchange center, and from there, are transmitted to the user by using SMS. If the responses are not optimal, the necessary analyses are made again, and after optimization, they are provided to be transmitted to the information exchange center and the user. All operations of the system include three stages: collecting, preparing, and modeling the information and exchanging the analyses in reality.
Collecting information from users includes spatial data about the origin and destination of commutation. However, in GIS, the maps are the base information and the geometric bed. By converting spatial and descriptive information of the map into digital information and storing them in computer memory, it will be possible to refer to any information in order to classify and use them desirably. The spatial data about the vehicles as part of the urban transport network, is collected by the sensors installed on the public transport vehicles and their stop stations. The sensor installed in the public transport vehicle, as soon as the vehicle enters the station, transmits a sign containing the number and the entrance time to the sensor installed in the station. The receiving sensor also adds this information to its spatial details, and transmits it to the data exchange center by means of wireless network. Images are of the common sources collecting the GIS data, that are commonly used in analyzing the road traffic information. The information available at these images is converted into tabular and documented (descriptive) data during software-aided preparation process.
Figure. 7 Urban commuting time management in Mashhad
Figure. 6, evaluating distribution of the bus stations numbered by the system indicates that providing service to the passengers in the city has a suitable spatial distribution. Since the city of Mashhad has about 1800 bus stations in its disposal, the system numbers about 1800 points.
Figure. 8 Distribution of bus stations in Mashhad
Now, these maps are provided to the users in two forms: paper maps or in mobile operating systems such as Android, Symbian,
Windows and etc… Given the nearest station, each user can
observe his / her origin and destination specified by a special number. Then, the user transmits the two mentioned numbers to the center through SMS by his / her own mobile phone. For example, if the number of the origin is 100 and the number of the destination is 200, the user will be able to transmit his / her message as 100,200.
After being received, the numbers of the commuting origin and destination are transmitted to the processing unit in which the commuting time is momentarily predicted by combined with the information received from the existing documentation such as width and level of providing services by the roads (under the analysis made by GPS). In this way, not only the system introduces the shortest road between the origin and the destination but also suggests the road through which the passenger can arrive at the destination more rapidly. So, the parameters of road length and movement speed need to be analyzed according to time. In this case, the road length is extracted according to the network distance between the starting and end points (from the data about the study area), and the allowed movement speed is selected in accordance with the codes and regulations and the bylaws and depending on the urban arterials (according to Mashhad Detailed Plan). However, movement speed in each road, usually due to the effect of the social and environmental, conditions is to some extent less than the allowed speed. So, depending on the average speed of the bus (in similar hours of the previous days) and passing volume in the junctions ahead, the system predicts the bus movement speed. As a result, due to changed volume of the public transport vehicles in the path and the bus speed in different hours, it allocates its lf different values. In this way, for each of the bus lines, the time interval between two subsequent stations is determined. By optimizing these values, the best path leading to the destination by the bus in the minimum time is determined, and is reported to the user along with the commuting cost. In a similar way, the commuting time and cost with other public transport vehicles are calculated, and different options are communicated to the user through SMS. To arrive at
the destination, the passenger needs to traverse the distance between his / her location to the origin station, the distances of the origin and destination stations, as well as the distance between the destination station and the final destination. The users traverses the length of the origin to the destination by bus and the remaining on foot with a fixed and constant speed. So, the optimal path covering the shortest commuting time changes depending on the shortest distance. In Figure. 9, the best path between the current location of the passenger and the origin station is shown by the system.
Figure. 9 An image showing the result from the system analysis in order to determine the distance the user traverses on foot to
the selected station
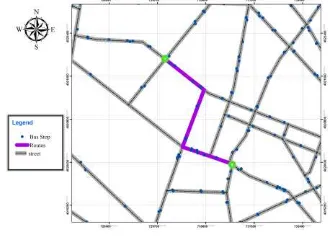
If Khayyam junction and Ahmadabad Sq. are assumed to be the origin station and the destination station, respectively, of the user, the path proposed by the system will be the same shown in Figure. 10.
Figure. 10 The path proposed by the system to the user
In addition, by using this system, urban commutations can be managed efficiently. For example, if there are a lot of individuals using the bus, the system will be able to include other buses in the line so that the commuting time decreases. So, this will encourage the user to use other public transport vehicles such as taxi and urban railway. Finally, by using the said strategy, in case where the demand for traveling between certain origin and destination is high, the system orders backup vehicles to be used in the network and supervises favorably the commuting times.
5. Conclusion
usually confusion over whether to take public transportation or a personal car. For example, selecting suitable vehicle in terms of optimal commuting time management is an important parameter. So, an efficient system which can meet this need is a must.
In this paper, in order to perform time management, different traffic data such as bus network, taxi network, and urban railway network are combined with communicative and analytic infrastructures including wireless sensor network and mobile GIS. In the provided process, first all bus stations, taxi stations as well as the public transport vehicles are equipped with information transmitting-receiving sensors. Then, the said vehicles along with the stations are numbered through which an exclusive identification code per a vehicle can be introduced for the system. In the next stage, the urban traffic data, which is obtained by means of the installed sensors and cameras, is inserted into the system. As a result, the city area is divided into some sub-areas through which each passenger can, depending his / her need, transmit the origin and destination to the system. Finally, while transmitting an SMS to the system, the user receives some options at the same moment, and manages his / her commuting time and cost. Implementing this system in the region of Khayyam T-Junction to Ahmadabad Sq. in Mashhad (one of the most populous cities of Iran) which constitutes a heavy traffic region, requires making correct topological structures in the road network and assigning characteristics relating to time in integrated descriptive tables. Accordingly, optimal paths for each user requiring the shortest commuting times are determined based on the lowest costs. These costs include the direct effective parameters such as travel, road attraction, waking time to the station, and indirect costs including information transmitting services. Of the obvious advantages of this system compared to web-based systems is that access to the Internet, regardless of its cost, requires desirable infrastructures. This decreases its application generally. In addition, even in the presence of online facilities, a lot of information is not provided to the users for time management. By using this cost-effective system, all citizens can manage their time and place, resulting on average in improving urban commutations by any passenger up to about 40% his / her daily time plan compared to the usual commuting conditions. Analysis and evaluation of this number show that the proposed process brings enormous economic savings for the people with it and also for authorities of the city which in turn plays an effective role in decreasing the pollutions caused by traffic, as well as maintaining m entail and physical health of the citizens. This system is able to locate the bus and taxi stations properly by using the analytic abilities of mobile GIS to avoid the passengers' time waste. In addition, by using the management facilities of this system with respect to effectively organizing the public transport vehicles and urban transport infrastructures, high costs of trail and error will decrease and mental safety of the users is supplied.
Reference
Grzybowska H., Barceló J.,)2012 (.Decision support system for real-time urban freightmanagement. Procedia - Social and Behavioral Sciences; (39) ,pp.712 – 725.
Haag D., 2001. Spatial and temporal transferability of relationship between travel demand, trip cost and travel time. Transportation research part E; (37) ,pp.163-189.
Yue M, Ren C., Li X.,2011. Access to Massive Data of Power System. Procedia Engineering; (24) ,pp.165 – 170.
Vande Walle S., Steenberghen T., 2006. Space and time related determinants of public transport use in trip chains. Transportation Research Part A; (40),pp.151–162.
Gong H, Chen C., Bialostozky E., Lawson C., 2012. A GPS/GIS method for travel mode detection in New York City. Computers, Environment and Urban Systems; (36) ,pp.131– 139.
Kim K., Dickey J., 2006. Role of urban governance in the process of bus system reform in Seoul. Habitat International; (30) ,pp. 1035–1046.
Abu Helwa S., Transportation GIS Trend. summer 2011.
D’Acierno L., Carteni A, Montella B., 2009. Estimation of urban traffic conditions using an Automatic Vehicle Location (AVL) System. European Journal of Operational Research; (196) ,pp.719–736.
Jia H., Fuh J., Nee A, Zhang Y., 2007. Integration of genetic algorithm and Gantt chart for job shop scheduling in distributed manufacturing systems. Computers & Industrial Engineering; (53) ,pp.313–320.
Guerriero F., Talarico L.,2010. A solution approach to find the critical path in a time-constrained activity network. Computers & Operations Research; (37) ,pp. 1557–1569.
Zhao Q., Deng F., Zhang W., Zeng S., 2012. The Research of Mobile GIS power distribution line inspection based on mobile SVG/J2ME. Physics procedia;(24) ,pp.1038-1043.
Brueck S., Kettschau H., Obernosterer F., 2004. Emission Reduction and Capacity Increase inGSMNetworks by SingleAntenna Interference Cancellation. Int. J. Electron. Commun. (AE¨U) ; (58) ,pp.274–283
Heinzelman w.,2000. Application-specific protocol
architectures for wireless networks, Ph.D. Dissertation, Mass. Inst. Technol., Cambridge.