QUANTITATIVE MEASUREMENT OF SOIL EROSION FROM TLS AND UAV DATA
A. Eltner a, *, C. Mulsow a, H.-G. Maas a
a Institute of Photogrammetry and Remote Sensing, TU Dresden, Germany - [email protected]
KEY WORDS: UAV, laser scanning, high resolution, soil surface model, change detection, soil erosion
ABSTRACT:
Soil erosion is a major issue concerning crop land degradation. Understanding these complex erosion processes is necessary for effective soil conservation. Herein, high resolution modelling of relief changes caused by run-off from precipitation events is an essential research matter. For non-invasive field measurements the combination of unmanned airborne vehicle (UAV) image data and terrestrial laser scanning (TLS) may be especially suitable. The study’s objective is to measure high precision digital terrain models (DTM) of the soil surface at two selected research areas with the extent of at least 500 square meters. The used UAV is integrated with GPS and inertial measurement unit (IMU). Furthermore, an active stabilizing camera mount equipped with a customary compact camera is implemented. For multi-temporal comparison of measured soil surfaces and for aligning UAV and TLS data a stable local reference system consisting of signalized points is defined by total station measurements. Two different software packages are applied for DTM generation from UAV images and compared to the corresponding DTM captured by TLS. Differences between the point clouds are minimal six millimeters and generally within TLS accuracy range. First multi-temporal comparisons are made and illustrate interesting surface changes.
* Corresponding author.
1. INTRODUCTION
Soil erosion is a driving factor for land degradation and therefore destruction of valuable crop area. Besides precipitation behaviour, soil and slope characteristics are major influencing forces. Highly resolved surface change detection can be an eminent support to explore the complex process of soil erosion. To extract surface models UAV equipped with a customary amateur camera and TLS used on a few meters high tripod are practical methods due to their contactless nature. UAVs are economical and flexible in acquiring aerial images. In addition, programmed flight patterns can be repeated almost arbitrarily to capture the test areas. These qualities of UAV are particularly helpful for quantifying single soil erosion events. The recognition of aerial images from low flying heights as a useful and cost-effective tool for soil erosion analysis is limited, yet (MARZOLFF &POESEN 2009, D’OLEIRE-OLTMANNS ET AL. 2012).
UAV photogrammetry (EISENBEIß 2009) is applied to derive point clouds from UAV imagery to describe the surface. Advances in digital photogrammetry enable fast image processing with high accuracy. Inter alia, progress in computer vision allows for automatic image orientation without initial estimates of inner and outer camera parameters – e.g. implemented in ‘bundler’ (SNAVELY ET AL. 2008). Furthermore, multi-image matching is recently gaining interest (HAALA 2009) due to software improvements and permits dense image matching – e.g. realized with semi-global matching (HIRSCHMÜLLER 2008) or multi-stereo view (FURUKAWA & PONCE 2008). Utilisation of these developments within environmental sciences has so far only been a few (JAMES & ROBSON 2012,CASTILLO ET AL.2012,WESTOBY ET AL.2012). In addition to UAV terrestrial laser scanning is used to generate DTM with centimetre resolution to complement and verify image derived terrain models. TLS has the advantage of high accuracy potential and automation level. TLS has been
established within soil sciences (e.g. SMITH ET AL.2011,PERROY ET AL.2010,HANCOCK ET AL.2008,SCHMID ET AL.2004). Considering test area size for soil erosion detection two different situations seem to be given. Either small patches up to a few square metres are measured with high accuracies within sub-millimetre range (RIEKE-ZAPP &NEARING,2005,JESTER & KLIK,2005,HAUBROCK ET AL.,2009)or large plots with sizes up to hectares are captured but accuracy amounts within sub-decimetre range (SCHÜRCH ET AL. 2011, SCHNEIDER ET AL.). BARNEVELD ET AL. (2013) indicate the ability to use TLS on larger plots (20 – 100 m²) with sub-millimetre accuracies. Also, within our study we want to achieve DTMs with accuracies beneath one cm, however for test sizes between 500 m² and 0.2 ha. Therefore, we are combining UAV and TLS technology to realize highest possible surface representation. Furthermore, the coherent usage of TLS and UAV allows for compensation of respective disadvantages. Aerial images assert occlusion effects from laser scanning and TLS detects error propagation given for large image bundles.
This contribution concentrates on the demands for data acquisition and processing for highly resolved multi-temporal soil surface change detection. Accuracy assessments and first results are presented.
2. DATA ACQUISITION 2.1 Applied Sensors
as well as nick and roll movements are compensated to maintain a constant image overlap according to terrain height.
Two different cameras are applied for the field survey. The first data collection phase is conducted with the Panasonic Lumix DMC-LX 3 with a focal length of 5.1 mm. The camera uses a zoom lens and the sensor size is 7.36 x 5.52 mm² with a pixel size of 2 µm². At the second data collection phase the Sony Nex-5N with a prime lens and a focal length of 16 mm is applied. Therefore, the camera geometry should be more stable. Also, higher sensor (23.5 x 15.6 mm²) and pixel size (4.8 µm²) promotes better ground resolution.
Figure 1. TLS with high tripod and UAV.
Supplementary to UAV the Riegl LMS Z420i laser scanner is utilised. The scanner has a panorama view and works after the time-of-flight principle. The system exhibits measurement accuracies about one centimetre. The terrestrial laser scanner is installed on a tripod with an approximate height of four metres (Figure 1). Since shallow slopes are scanned laser beam geometry is adverse, especially with increasing distance (SCHÜRCH ET AL. 2011). Due to decreasing reflected pulse intensity and possible multiple reflections wrong distance values might be assigned (BOEHLER 2003). A higher scan position enhances the incident angle and thus laser beam geometry. Nevertheless, for instance, at the short distance of 25 m foot print size is already seven centimetres.
2.2 Field Campaign
Two different study areas located at slopes are selected to consider different site characteristics influencing the process of soil erosion. The first study site is situated in the Andalusian marl landscape close to Sevilla, Spain and has an extent of 40 x 50 m². The geological situation is conditioned by Tertiary marl. The slope is convex and has an average inclination of 6°. Andalusia is affected by strong soil erosion, amongst others due to seasonal torrential precipitation events (e.g. FAUST & SCHMIDT 2009, BRACKEN & KIRKBY 2005, POESEN & HOOK 1997).Measurements were performed once in September 2012 and in March 2013 twice – before and after a strong precipitation event.
The second study site is located in the Saxonian loess close to Döbeln, Germany. Site characteristics are as follows: extent of 20 x 25 m², geology made of Pleistocene loess and average slope of 5.5°. The precipitation in Saxony is less erosive, but due to erodible soils within this area intense soil erosion is given as well (WOLF &FAUST 2013). Data acquisition was done in October 2012 and after snow melt in April 2013.
UAV: For image acquisition flight planning is necessary. Due to different cameras and area sizes different parameters are given (Table 1). Both applied cameras are non-calibrated amateur systems. Hence, instable camera geometry necessitates either a temporary transportable calibration field or self-calibration during data processing. The self-calibration field consists of coded and un-coded markers and are distributed in different
heights to provide depth information. The calibration images are gathered immediately before or after the UAV flight.
camera flying
Table 1. Flight planning, unit [m]
TLS: To assure line of sights with area cover as complete as possible the scanner was located in the middle of each side of the study plot. Scan resolution is set to one centimetre at the distance of 25 m, thus both plots have nearly at least one point per centimetre. But due to occlusion e.g. from plough marks or larger soil aggregates total coverage can still not be assumed, in which heterogeneous point distribution causes immense lowering of point density.
For multi-temporal comparison as well as UAV and TLS data fusion a local stable reference system is setup. Self-built ground control points (GCP) are used which simultaneously can be extracted from the TLS point cloud and from UAV images. Besides plane markers, retro-reflective cylinders with a closing target disk are temporarily plugged on marking pipes with a depth of 60 - 100 cm (Figure 2). Additional temporary plane markers for the UAV image processing, which are measured by total station, are used in Andalusia. Although marking pipes are piled deeply into the soil, GCP movements are possible. To sustain these circumstances further survey bolts on utility poles are levelled by total station. Especially at the clayey position in Andalusia between the pre- and post rain-laden season erroneous points are removed and a moving least square (MLS) filter from the point cloud library (RUSU &COUSINS 2011) is applied to reduce the noise for meshing the data in a further step.
While TLS yields 3D point clouds directly, UAV data need to be processed for receiving 3D information from 2D images. Classical aero-triangulation is one possibility. Since the UAV system integrates GPS and IMU initial estimates for the camera position and orientation are given. With “Leica Photogrammetry Suite” sufficient results of bundle block adjustment can be derived (ELTNER 2012). But due to point densities merely about one point per 15 cm² different software has to be used for dense DTM generation.
“Pix4UAV Desktop by Pix4D” which combines photogrammetry and computer vision (KÜNG ET AL. 2012). Firstly, automatic aero triangulation is performed with initial camera position values and matching points amongst others found with SIFT operator (LOWE 2004). After bundle block adjustment the calculated 3D-coordinates of the matching points are densified by dense multi-image matching which e.g. implements semi-global matching. For geo-referencing GCP with corresponding imported image points can be included within the bundle block adjustment. Hence, in-house software for sub-pixel accurate automatic detection of circular markers is implemented.
On the other hand, “Agisoft PhotoScan” is used which allows image alignment without any further information. However, the implementation of initial estimates of camera positions is supported as well. General workflow is as follows: the camera orientations are calculated by image matching with common points and the resulting DTM is densified based on the identified camera positions and the images (AGISOFT 2012). In contrary to “Pix4UAV”, in “PhotoScan” geo-referencing is not included within the bundle block adjustment and performed after relative image orientation. Furthermore, the image points of the corresponding GCPs need to be measured manually. Thus, less accurate absolute orientations are expected.
For UAV data processing the original and undistorted images are used. The undistorted images are calculated by in-house software. Especially for the first measurement phase with the deployed camera from Panasonic high radial lens distortion coefficients are detected. Both used software packages estimate the inner camera orientation but have difficulties dealing with distorted images, although own camera calibration estimates can be implemented. “Pix4UAV” misses points during DTM densification and the generated DTM from “PhotoScan” contains a well recognizable bulge with offsets greater than ten centimetres.
The final point clouds produced by TLS and UAV images are to be compared. Data comparison is succeeded with the open source software “CloudCompare” from D. Girardeau-Montaut.
4. RESULTS & DISCUSSION
UAV image processing with “Pix4UAV” is easy and fast. After providing the necessary data camera orientation and DTM generation process is performed completely automatically. For the smaller study site in Saxony undistorted and distorted images are processed. It becomes apparent that data processing of the first measurement phase in fall 2012 with the Panasonic Lumix camera is difficult with distorted images. The bundle block adjustment is sufficient (Table 3), but the resulting geometrical model still seems to have errors, because DTM densification is unsatisfactory. For the Saxony DTM twelve percent more points are achievable with the undistorted images. Hence, images acquired with the Panasonic Lumix are processed undistorted, only. Performance with Sony NEX is already satisfactory with distorted images and a first interpolation step can be skipped.
Using “PhotoScan” for image orientation undistorted images need to be applied with both cameras. However, “PhotoScan” has difficulties with the images from the second Andalusian measurement phase in spring 2013. Image contrast is low because of a homogenous surface after sheet transport of soil fragments and due to dull lighting conditions. Therefore, only the first measurement phase can be investigated.
Image overlap consideration is necessary with regard to multi-image matching. Flying heights above terrain are not constant due to the need of defining a single height for the whole UAV
flight planning. Since slopes are captured image overlap is changing within the image blocks (Figure 3). This leads to the conflict of higher ground resolution and lower image overlap at the upper slope versus the reversed case at the lower slope. In addition, UAV software problems during the spring measurement phase caused selective image overlap decreasing because the system skipped camera triggering at several waypoint locations.
Figure 3. Ortho mosaic (1) and image overlap [nbr. of images] with Panasonic Lumix (2) and Sony NEX (3) in Andalusia. Arrow indicates direction of increasing height above terrain.
Point density is differing between TLS and UAV data and between small and large study site (Table 2). Especially PhotoScan exhibits for the DTMs generated from UAV images high point densities up to six points per square centimetre. For the UAV data point density decreases with decreasing ground resolution due to higher flying heights. In contrast, point density of TLS data is decreasing with increasing distance to the scanner position and consequently is lowest in the middle of the study site, which is even more relevant for the larger plot in
Table 2. Average point density [points/cm²]
Before the actual accuracy analysis of UAV data a short accuracy control of TLS data needs to be performed. TLS registration error between the different scan positions for a single time interval ranges between 4 and 6 mm. For multi-temporal comparison target coordinates of the first interval, which were transformed to the local reference system, are assigned to the following measuring phase, if no GCP movement has been verified by total station control. Hence, adverse error propagation due to separately conducted 3D-Helmert transformations for every time interval to the local reference system is avoided. In Saxony, accuracy of multi-temporal registration amounts 2.3 mm. In Andalusia, only the pre- and post-rain measurement in spring can be registered with the same target coordinates because GCP movement between fall 2012 and spring 2013 was detected. Accuracy of multi-temporal registration is 3 mm. The final filtering of the noisy TLS point cloud by MLS for DTM meshing results in an average point movement between 2 and 3 mm.
4.1 Accuracy of image processing
flying heights in Saxony and Andalusia is distinguishable. The small enhancement of ground resolution due to greater pixel size of the Sony NEX-5N is not recognizable within accuracy results and is likely compensated by worse lighting conditions for the measurements in spring. Besides, even though the NEX images have been undistorted, a small bulge within the DTM
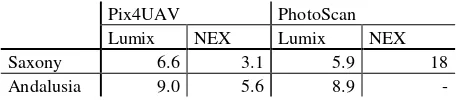
In addition to accuracy details provided by the used software for DTM generation from UAV, images are compared to TLS point clouds, which have not been yet filtered by MLS. The alignment of UAV and TLS data is adequate, because point deviations are within TLS accuracy range. Dense image matching performed by “Pix4UAV” achieves better results for the Sony NEX camera with higher ground resolution. In contrast, the DTM from the NEX images which is generated by “PhotoScan” shows inferior accordance due to the mentioned DTM bulge.
Pix4UAV PhotoScan
Lumix NEX Lumix NEX
Saxony 6.6 3.1 5.9 18
Andalusia 9.0 5.6 8.9 -
Table 4. Average point deviation [mm] for DTMs from TLS and UAV
A closer look at the extraction of different surface properties by UAV and TLS exhibits interesting details. When comparing DTMs from micro-drone and laser scanning an underestimation of local heights of the DTMs generated from the UAV images is obvious (Figure 4). Furthermore, the terrain models generated from “PhotoScan” are clearly different than those generated from “Pix4UAV”. Besides significantly higher point density (Table 2), DTMs from “PhotoScan” seem to underestimate rill heights systematically and are generally smoother. For “Pix4UAV” processed DTMs frequent deviations are not as obvious, though overestimations of rill depths as well as similarly shifts of rill slopes are visible. However, it is difficult to estimate whether the differences between TLS and UAV DTM are due to errors from TLS – e.g. multiple reflections due to edges and large footprint sizes, or due to errors from UAV –
e.g. insufficient point matching within image processing due to insufficient contrast.
Figure 4. Height differences between differently from UAV generated point clouds and TLS displayed for an excerpt of the Saxonian DTM
Different point densities influence the detail of surface reconstruction which is especially relevant for the larger plot in Andalusia. The increasing distance to the TLS amplifies the increase of incident angles and hence the increase of noise (SOUDARISSANANE ET AL. 2011) and occlusion effects. Furthermore, the convex slope shape causes additional unfavourable incident angle amplification. In Andalusia a tractor trail is chosen for detailed examination of occlusion effects (Figure 5). The DTM generated from TLS point cloud misses points in the depth of the trail. Thus, the meshed surface model underestimates the steepness. DTM processed with “PhotoScan” has the highest point density and should be sufficient to fill the gap, but the surface rebuilding is generally too smooth. Hence, the tractor trail is not correctly measured. to DTM generated from UAV point of view (turquoise)
4.2 Multi-temporal Change Detection
Simple un-weighted point fusion of UAV data processed with “Pix4UAV” and TLS data is performed for a first multi-temporal change detection. Exemplary an excerpt of the Saxonian plot and of the Andalusian plot (three times three square metres) are presented.
In Saxony strong surface subsidence of the in fall freshly ploughed field is obvious (Figure 6). The whole area has been lowered. Furthermore, levelling of the machine induced rippled terrain. The surface roughness has been decreased.
Figure 6. Change detection at the Saxonian plot, unit [m]
At the study plot in Andalusia different events are apparent (Figure 7). The long-term observation from fall to spring exhibits surface lifting mainly due to swelling at the clayey position while the short-term single precipitation event surveillance indicates small rill developments and laminar soil particle movement.
Figure 7. Change detection at the Andalusian plot, unit [m]
5. CONCLUSION
Quantitative measurement of soil erosion with UAV and TLS data with high resolution at sub-hectare large plots is well accomplishable. Both applied software packages allow fast and automatic image processing. However, this can be disadvantageous at the same time because few possibilities to influence image matching and orientation remain.
DTMs derived from both systems show a good accordance with the installed local stable reference system. Regarding small scale observations the combined data is still noisy. Due to the rough and constantly changing terrain it is difficult to distinguish possible error sources. Additional analysis inter alia with a calibrated test field is necessary.
The combined utilisation of TLS and UAV derived DTMs for soil erosion examination needs further detailed consideration to extract maximal benefit of both systems for highly resolved change detection. For instance, weighted point assignment as a function of incident angle, surface heterogeneity or roughness is conceivable.
6. REFERENCES
Agisoft LLC, 2012. Agisoft PhotoScan User Manual: Professional Edition, Version 0.9.0. http://downloads.agisoft.ru/ pdf/photoscan-pro_0_9_0_en.pdf
Barneveld, R., Seeger, M., Maalen-Johansen, I., 2013. Assessment of terrestrial laser scanning technology for obtaining high-resolution DEMs of soils. Earth Surface
Processes and Landforms, 38, p. 90-94
Boehler, W., Bordas, V., Marbs, M., 2003. Investigating Laser Scanner accuracy. International Archives of Photogrammetry,
Remote Sensing and Spatial Information Sciences, Vol.
XXXIV-5, Part C15, p. 696-701
Bracken, L., Kirkby, M., 2005. Differences in hillslope runoff and sediment transport rates within two semi-arid catchments in southeast Spain. Geomorphology, 68 (3-4), p. 183-200
Castillo, C., 2012. Comparing the Accuracy of Several Field Methods for Measuring Gully Erosion. Soil Science Society of
America Journal, 76 (4), p. 1319-1332
d’Oleire-Oltmanns, S., Marzolff, I., Peter, K., Ries, J., 2012. Unmanned Aerial Vehicle (UAV) for Monitoring Soil Erosion in Morocco. Remote Sensing, 4, p. 3390-3416
Eisenbeiß, H., 2009. UAV Photogrammetry. Dissertation, Institut für Geodäsie und Photogrammtrie, ETH Zürich, IGP
Mitteilungen, 105
Eltner, A., 2013. Konzeption einer Methode zur quantitativen Erfassung von Bodenerosion durch integrierte Aufnahme mit einer Mikrodrohne und einem terrestrischen Laserscanner.
DGPF Tagungsband, 22, p. 289-297
Faust, D., Schmidt, M., 2009. Soil erosion processes and sediment fluxes in a Mediterranean marl landscape, Campiña de Cádiz, SW Spain. Zeitschrift für Geomorphologie N.F., 52 (2), p. 247-265
Furukawa, Y., Ponce, J., 2007. Accurate, dense, and robust multi-view stereopsis. IEEE Conference on Computer Vision
and Pattern Recognition, 17–22 June, Minneapolis, USA, pp.
1-8
fall 2012 spring 2013
fall 2012 - spring 2013 single rain event 2013
fall 2012 spring 2013
60 cm
60 cm 60 cm
1 m 1 m
Haala, N., 2009. Comeback of Digital Image Matching.
Photogrammetric Week, 2009, p. 289-301
Hancock, G., Crawter, D., Fityus, S., Chandler, J., Wells, T., 2008. The measurement and modelling of rill erosion at angle of repose slopes in mine spoil. Earth Surface Processes and
Landforms, 33, p. 1006-1020
Haubrock, S.-N., Kuhnert, M., Chabrillat, S., Güntner, A., Kaufmann, H., 2009. Spatiotemporal variations of soil surface roughness from in-situ laser scanning. Catena, 79, p. 128-139
Hirschmüller, H., 2005. Accurate and Efficient Stereo Processing by Semi-Global Matching and Mutual Information.
IEEE Conference on Computer Vision and Pattern
Recoginition, June 2005, San Diego, CA, USA, Volume 2, p.
807-814
James, M., Robson, S., 2012. Straight-forward reconstruction of 3D surfaces and topography with a camera: Accuracy and geosciences application. Journal of Geophysical Research
Earth Surface. doi:10.1029/2011JF002289
Jester, W.. Klik, A., 2005. Soil surface roughness measurement-methods, applicability, and surface representation. Catena, 64, p. 174-192
Küng, O., Strecha, C., Beyeler, A., Zufferey, J-C., Floreano, D., Fua, P., Gervaix, F., 2012. The Accuracy of Automatic Photogrammetric Techniques on Ultra-light UAV Imagery.
International Archives of the Photogrammetry, Remote Sensing
and Spatial Information Sciences, Vol. XXXVIII-1, Part C22
Lowe, D., 1999. Object recognition from local scale-invariant features. Proceedings of the International Conference on
Computer Vision, 2, p. 1150-1157
Marzolff, I., Poesen, J., 2009. The potential of 3D gully monitoring with GIS using high-resolution aerial photography and a digital photogrammetry system. Geomorphology, 111, p. 48-60
Perroy, R., Bookhagen, B., Asner, G., Chadwick, O., 2010. Comparison of gully erosion estimates using airborne and ground-based LiDAR on Santa Cruz Island, California.
Geomorphology, 118, p. 288-300
Poesen, J., Hooke, J., 1997. Erosion, flooding and channel management in Mediterranean Environments of southern Europe. Progress in Physical Geography, 21 (2), p. 157-199.
Rieke-Zapp, D., Nearing, M., 2005. Digital Close Range Photogrammetry for Measurement of Soil Erosion. The
Photogrammetric Record, 20 (109), p. 69-87
Rusu, R., Cousins, S., 2011. 3D is here: Point Cloud Library (PCL). IEEE International Conference on Robotics and
Automation (ICRA), May 9-13, 2011
Schmid, T., Schack-Kirchner, H., Hildebrand, E., 2004. A case study of terrestrial laser scanning in erosion research: calculation of roughness and volume balance at a logged forest site. International Archives of Photogrammetry, Remote
Sensing and Spatial Information Sciences, Vol. XXXVI-8, Part
W2, p. 114-118
Schneider, A., Gerke, H., Maurer, T., Seifer, S., Nenov, R., Hüttl, R., 2012. Evaluation of remotely-sensed DEMs and modification based on plausibility rules and initial sediment budgets of an artificially-created catchment. Earth Surface
Processes and Landforms, 37, p. 708-725
Schürch, P., Densmore, A., Rosser, N., Lim, M., McArdell, B., 2011. Detection of surface change in complex topography using terrestrial laser scanning: application to the Illgraben debris-flow channel. Earth Surface Processes and Landforms, 36, p. 1847-1859
Smith, M., Cox, N., Bracken, L., 2011. Terrestrial laser scanning soil surfaces: a field methodology to examine soil surface roughness and overland flow hydraulics. Hydrological
Processes, 25, p. 842-860
Snavely, N., Seitz, S., Szeliski, R., 2008. Modeling the world from internet photo collections. International Journal of
Computer Vision, 80, p. 189-210
Soudarissanane, S., Lindenbergh, R., Menenti, M., Teunissen, P., 2011. Scanning geometry: Influencing factor on the quality of terrestrial laser scanning points. ISPRS Journal of
Photogrammetry and Remote Sensing, 66 (4), p. 389-399
Westoby, M., Brasington, J., Glasser, N., Hambrey, M., Reynolds, J., 2012. ‘Structure-from-Motion’ photogrammetry: A low-cost, effective tool forgeoscience applications.
Geomorphology, 179, p. 300-314
![Table 1. Flight planning, unit [m]](https://thumb-ap.123doks.com/thumbv2/123dok/3250083.1398440/2.595.57.289.197.284/table-flight-planning-unit-m.webp)
![Figure 3. Ortho mosaic (1) and image overlap [nbr. of images]](https://thumb-ap.123doks.com/thumbv2/123dok/3250083.1398440/3.595.316.532.395.455/figure-ortho-mosaic-image-overlap-nbr-images.webp)
![Figure 6. Change detection at the Saxonian plot, unit [m]](https://thumb-ap.123doks.com/thumbv2/123dok/3250083.1398440/5.595.63.283.195.423/figure-change-detection-saxonian-plot-unit-m.webp)
