GIS-BASED SMART CARTOGRAPHY USING 3D MODELING
E.S. Malinverni a, A.N. Tassetti a
a DICEA, Civil Engineering Faculty, Università Politecnica delle Marche, via Brecce Bianche, 60131 Ancona, - (e.s.malinverni, n.tassetti)@univpm.it
Commission III WGIII/4
KEY WORDS: Cartography, Digital mapping, GIS, 3D City Model, CityGML, Interoperability
ABSTRACT:
3D City Models have evolved to be important tools for urban decision processes and information systems, especially in planning, simulation, analysis, documentation and heritage management
.
On the other hand existing and in use numerical cartography is often not suitable to be used in GIS because not geometrically and topologically correctly structured.The research aim is to 3D structure and organize a numeric cartography for GIS and turn it into CityGML standardized features. The work is framed around a first phase of methodological analysis aimed to underline which existing standard (like ISO and OGC rules) can be used to improve the quality requirement of a cartographic structure. Subsequently, from this technical specifics, it has been investigated the translation in formal contents, using an owner interchange software (SketchUp), to support some guide lines implementations to generate a GIS3D structured in GML3.
It has been therefore predisposed a test three-dimensional numerical cartography (scale 1:500, generated from range data captured by 3D laser scanner), tested on its quality according to the previous standard and edited when and where necessary. Cad files and shapefiles are converted into a final 3D model (Google SketchUp model) and then exported into a 3D city model (CityGML LoD1/LoD2). The GIS3D structure has been managed in a GIS environment to run further spatial analysis and energy performance estimate, not achievable in a 2D environment. In particular geometrical building parameters (footprint, volume etc.) are computed and building envelop thermal characteristics are derived from. Lastly, a simulation is carried out to deal with asbestos and home renovating charges and show how the built 3D city model can support municipal managers with risk diagnosis of the present situation and development of strategies for a sustainable redevelop.
1. INTRODUCTION
1.1 Motivations and challenges
Numerical cartography can be a widespread planning aid but it should be provided with defined characteristics to be used for certain purposes and defined working environment. For this reason, building and testing numerical cartography, important features should be pursued in order to prepare the data not only to be visualized but also and especially to be managed in a GIS environment for advanced spatial analysis.
Sharing different kinds of information, and among them spatial data, put the question of construction of a cartographic model to build and manage geographical information at large, medium and small scale. So it becomes necessary to solve many problems concerning the use of different GIS instruments by customers, the definition of an appropriate format for exchanging and transferring of geographic data, the design of a common cartographic model.
It is important to underline that this common cartographic model should be:
- printable, by means of a defined common graphic style - arranged for generalization into smaller scales (multi-precision database handling)
- geometrically exact
- topologically structured with a shareable geometrical and semantic content. This is indispensable to allow advanced applications (like route calculation on a graph) and GIS management.
- interoperable in terms of open data format, metadata and service interoperability.
In this context the CItyGML format should be of help giving standard to describe three-dimensional geographical objects in terms of geometrical, topological and thematic aspects and making in this way easier to exchange and transfer them from a drawing/GIS instrument to a different one. Generally every GML file is combined to a schema file with a structure referring to the rules defined by Open Geospatial Consortium.
In addition to the above, the three-dimensional content is nowadays an important information and a must to allow not only visualization but also geoprocessing and computation (like volume calculation, visibility charts, cost's evaluation, etc.).
1.2 CityGML and OGC Standard
CityGML model, carried out by a consortium of several German public and private bodies, is an open data model and XML-based format for the storage and exchange of virtual 3D urban objects. It defines the classes and relations for the most relevant topographic objects and regional models according to their geometrical, topological and semantical properties.
The thematic information of CityGML goes beyond graphic exchange formats and allows developing virtual 3D city models for sophisticated analysis and helps to employ virtual 3D city models for sophisticated analysis tasks in different application domains (i.e. simulations, urban data mining, facility management and thematic inquiries).
International Archives of the Photogrammetry, Remote Sensing and Spatial Information Sciences,
It is implemented as an application schema for the Geography Markup Language 3 (GML3), the extendible international standard for spatial data exchange issued by the Open Geospatial Consortium (OGC) and the ISO TC211.
CityGML encodes a multi-level representation of cities, also including ground, buildings, transportation network, bodies of water, city furniture, electric/power lines, and vegetation objects. Important features are:
• the use of five Level of Detail (LOD), numerated from zero to four (Figure 1)
Figure 1. LOD definition (Kolbe et al., 2008)
• the definition ofonly one geometric-topological structure. Besides CityGML introduces textures into GML, to make more realistic models.
CityGML is intended to become an open standard and therefore can be used free of charge.
2. FROM THE NUMERIC CARTOGRAPHY TO GIS
2.1 Objectives
The main objective is to work with available numerical cartography in order to permit spatial analysis in GIS environments and dissemination with web technology.
A workflow is given to describe how is possible to obtain outdoor modeling results using available software such as Google SketchUp, AutoCAD and standard like CityGML.
Cad files and shapefiles are imported in Google SketchUp and used as primitives to build a 3D environment that is finally exported into a 3D city model (CityGML LOD1/LOD2). The built 3D GIS allows to explore and query the 3D model and, more important, run further spatial analysis.
2.2 Methodologies and Instruments
Data are initially built and edited in the Autocad environment. The choice of using this software, born with the native format of the source data (mostly CAD files and shapefiles), is supported by its powerful editing tools, as well as its 3D visualization capabilities. For modelling the city buildings and other generic objects, Google Sketchup (Google Inc. 2010b) including citygml.de Sketchup Plug-In (CityGML-Toolchain 2010) is used.
2.2.1 Google SketchUp:
It is a 3D modeling tool, highly compatible, user friendly and suitable for any urban simulation and visualization work. It has the functionality of modeling, editing, texturing, and creating walkthroughs of the scene created thus making it a very useful tool for professional planning. Initially 3D buildings are created for the whole municipalities using Google SketchUp and are
converted to CityGML format using the SketchUp CityGML plug-In and face in this ways two main problems:
1) after data have been correctly geometrically structured, it’s
necessary to allocate attributes and to assign each entity to various feature classes;
2) find the way to export data in GML format, using an appropriate schema file
To reach the first level of detail (City GML LOD1), CAD files of the building feature layers (1:2000 scale cartography) are imported directly into Google SketchUp and first modelled by giving extrusion with accurate height information.
Standard Attributes are edited (Name, YearOfConstruction, CreationDate, MeasureHeight, StoreyAboveGround, StoreyBelowGround, usage) and added the Address as generic attribute.
Then, to rise the City Model into LOD2, 1:500 scale cartographic data are imported in SketchUp and used as primitives for the following 3D modelling step. The process includes modeling of the buildings using various tools in SketchUp by modifying their architecture and, when possible, giving them textures from the images of the features.
Again, attributes are edited and SketchUp surface models converted into CityGMLMultiSurface feature type (Figure 2).
Figure 2. Converting SketchUp surface model into CityGMLWallSurface feature type
Various other urban objects like monument, perimeter fence and bastions are modelled, compiled in terms of attributes and exported in same way into the CityGML format.
Vegetation objects and city furniture are downloaded from shared 3D model libraries and exported as Solid feature type while the transportation network is built directly in the GIS environment working with the available cartographic layers, TIN and overlay spatial operations. Name, YearOfConstruction and material are defined as road attributes.
2.2.2 LandXplorer Viewer:
The complete package provides for the creation of 3D city models combining GIS functions with photorealistic graphics. Only the Viewer module is open source and remarkable for its interactive and real-time visualization system.
Figure 3. LOD 2Build Buildings loaded in LandXplorer Viewer International Archives of the Photogrammetry, Remote Sensing and Spatial Information Sciences,
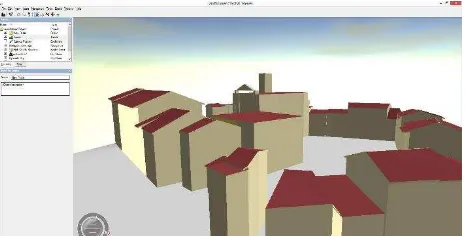
In this experience the Viewer is used, step by step, to quickly load and explore the compiled 3D city models based on CityGML and test their correctness in terms of textures, topology and geometry (Figure 3).
2.2.3 GIS:
After having topologically structured all the geographical information, GML data can be loaded in the chosen GIS environment and used for further spatial processing.
Figure 4. 3D query and analysis tools in GIS environments
3. IMPLEMENTATION TROUGH REAL DATA
3.1 Source Data
This work starts from an agreement between DICEA department (Università Politecnica delle Marche) and Morro d’Alba municipalityfor the town-planning and the old town detailed plan drafting. The whole project is framed around different tasks and different products with the aim to improve the cultural and
environmental heritage of Morro d’Alba (Ancona province,
Marche Regione, Italy).
First, a 1:2000 numerical cartographic product by aerial photogrammetry served as a fundamental instrument for town planning and management. Then, limited to the historical center, it was integrated by terrestrial, topographical and 3D laser scanning surveys for a more detailed and complete knowledge of the old town urban system (numerical cartography, scale 1:500). This last cartographic product is now mostly used to set up a 3D city model (CityGML LoD1/LoD2) that, after further improvements and level of details, will play an essential role for municipal managers forming the basis for an increasing range of calculations, simulation and analysis.
3.1.1 Terrain Data:
High resolution DEM is extracted by means of digital aerial photogrammetry and automated image matching procedures. The capture of break lines where appropriate was essential to obtain a perfect fit of the DTM with the real-world. A 2 meter TIN was interpolated from the extremely dense automated 3D point clouds imagery and 2 meter contour lines were generated from it. Its raster form underlay the ortophoto production.
3.1.2 Aerial Imagery:
Very high resolution orthophotos and a mosaic were obtained of the area under study applying the differential rectification method. The aerial image in Figure 5, used as the DEM texture in this project, is an orthorectified airborne photography by Integraph Digital Mapping Camera, in a scale of 1:2000, provided in RGB Geotiff format and with a spatial resolution of 13 cm per pixel.
3.1.3 Numerical cartography:
The generation of 1:2000 scale digital cartography (Figure 5) of the whole municipality was produced by classical aerial
photogrammetry: flight (high resolution DMC camera), orientation, bundle adjustment with airborne GPS control and 3D restitution in Gauss-Boaga (Datum Roma 40).
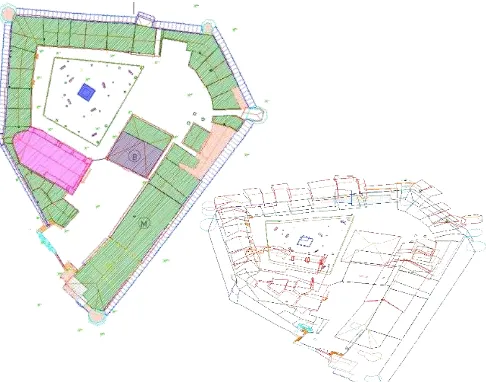
Limited to the historical centre, an higher scale cartography (scale 1:500, Figure 6) is produced by means of in field direct measurements (integration of GPS and total station) and 3D Laser Scanner (Leica ScanStation C10).
All the produced cartographic data are organized and lined up with INSPIRE program principles E.U. Directive and with 'Intesa GIS Project' for a National Geodatabase Infrastructure but not fully oriented to 3D visualization and analysis that represent important feature to accomplish typical GIS operations.
Figure 5. Orthophoto by aerial camera Z/I Imaging DMC (on the left) and 1:2000 scale digital cartography(on the right)
Figure 6. 1:500 scale digital cartography, old town
3.2 3D City modules and Level of Detail
3.2.1 CityGML LOD 0: The CityGML model contains only a TIN relief with a georeferenced orthophoto texture modelled as GeoreferencedTexture element (Figure 7).
Figure 7. LOD0, 2.5D Digital Terrain Model over which an aerial orthophoto is draped.
International Archives of the Photogrammetry, Remote Sensing and Spatial Information Sciences,
The CityGML standard specify five Levels of Detail (LoD) (Table 1), pointing to solve some problems on structuring cartography and showing how suitable capture techniques are needed for each object class because of different required 3D point accuracy.
Table 1. LOD 0-4 with its accuracy requirements (Albert et al. 2003).
LoD1 objects should have an accuracy better than 5m and do not have to implement roof type. LoD1 buildings are also referred to as block buildings. LoD2 objects should have a geometry accuracy of better than 2 m and the roof type and its orientation should be included in the model. The LoD3 models have an overall geometry accuracy of better than 0.5 m and the real object form of the roof, windows, doors, balconies, etc. of the buildings should be represented in the model (Kolbe et. al. 2008). The available 3D laser scanner survey is suitable to satisfy the required 3D point accuracy for LOD3 object classes but not the 1:500 scale cartography that is lacking in information about windows and doors. Up to now, it is preferred to put the LOD3 project on hold and underline the performance of working with cartography at different scale (scale 1:200 and 1:500) and with different contents.
3.2.2 CityGML LOD 1:
The CityGML model improves the TIN relief with a block model comprising buildings structure (Height Data) of old town and neighboring buildings (Figure 8).
Figure 8. LOD1, “Block model” of old town and neighboring buildings, w/o roof structures
Figure 9. LOD 1 Buildings and true orthophoto
3.2.3 CityGML LOD2:
Bounding surfaces are differentiated semantically in wall, roof, ground surfaces with additional feature types (RoofSurface, WallSurface, GroundSurface, and ReliefFeature) and thematically differentiated surfaces according to the building use (Figure 10). All buildings contain semantic information and a number of thematic attributes including their addresses, usage and other geometrical parameters (covered surface, perimeter, volume, hight etc.).
Figure 10. LOD2, Old town buildings
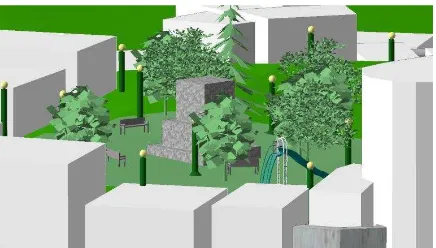
Vegetation and City furniture (mostly street lights and benches) are imported to enrich the City model content (Figure 11). Generic City objects and roads are added as well (Figure 12-13).
Figure 11. old town LOD2, Vegetation and City Furniture
Figure 12. LOD2, Transportation network
Figure 13. LOD2, Generic City Objects
Experimental results
International Archives of the Photogrammetry, Remote Sensing and Spatial Information Sciences,
Land use model is created intersecting terrain model and land use information in order to allow the visualization with different material texture depending on the land use (Figure 14).
Figure 14. LOD2, old town land use
3.3 GIS environment and Spatial Analysis
The built City structures (CityGML LOD1 and LOD2) are both managed in a GIS environment to run further spatial analysis and energy performance estimate.
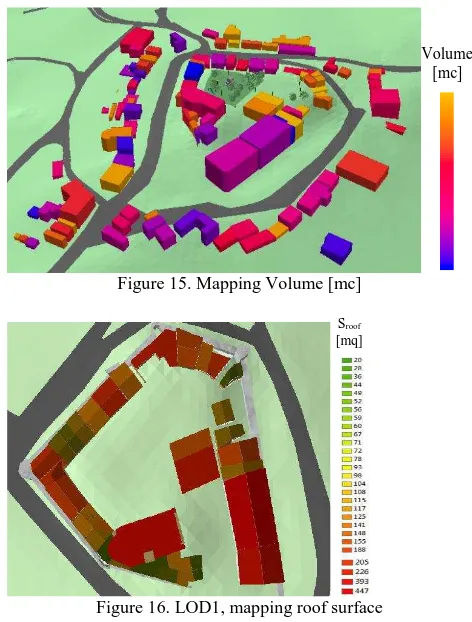
First, the GIS environment is used to compute some geometrical building parameters related to buildings (Footprint, Perimeter, Maximum height, Minimum height, Building height and Volume) and other connected with vegetation objects (Area, perimeter, Maximum and Minimum height). Simple thematic maps can be derived to emphasize some attribute distribution (Figure 15-16)
Figure 15. Mapping Volume [mc]
Figure 16. LOD1, mapping roof surface
Some interesting urban index (i.e. drainage surface, Gross and net building areas) are computed and building envelop thermal characteristics derived. In particular, according to UNI/TS
11300-2, the CityGML LOD1 is used to give an evaluation of primary energy need and of system efficiencies for domestic hot water production (Figure 17). Experimental results should be improved using an higher level of detail (LOD4) in order to give precise net building areas and more reliable energy estimates for domestic hot water production.
Figure 17. Energy demand for domestic hot water production
Lastly, a simulation is carried out to deal with asbestos and home renovating charges and show how the built 3D city model can support municipal managers with risk diagnosis and development of strategies for a sustainable redevelop.
The CityGML LOD2 is managed to compute and edit some roof attributes in terms of material, area, weight, dump/transportation/sanitary charges (Figure 18). Conjecturing to remove asbestos, a simulation can be run to understand the total charges for every involved home (Figure 19)
Figure 18. LOD1, mapping roof material
Figure 19. LOD1 Simulation: asbestos and home renovating charges
Total charge
[€]
Material
Asbestos Brick
Sroof
[mq]
Volume [mc]
Qw [KWh]
3404
148
International Archives of the Photogrammetry, Remote Sensing and Spatial Information Sciences,
4. CONCLUSION
The aim of digital cities is to combine photorealistic urban visualisations with rich analysis tools useful in different fields: location based services systems, pedestrian and car routing systems, urban planning, police/army training simulators and others.
Right now it is still difficult to make the link between the analysis and database functions of GIS software, and the photorealistic visualisations that 3D graphics software provides. 3D GIS applications like ESRI ArcScene are a step in the right direction,
but don’t yet offer the 3D graphics power, or web publishing functions, that ideally we’d like to see.
Our model, first designed to be consistent with a scale of 1:2000, needed the introduction of more detailed zones (intended at a scale 1:500), regarding public utilities and services (like post office, municipalities and so on) to rise in LOD1.
The LoD3 buildings can be in future modelled by extending the LoD2 buildings with help of ground and floor plans of some buildings, the available 3D laser scanner survey, individual on-site investigation and taken photographs of the objects. The modelling process of extending the LoD2 models to LoD3 models is very time consuming, but it is planned to have soon the complete old town in LoD3 at some point with detailed wall and roof structures, detailed vegetation and transportation objects
REFERENCES
Eicker U., Nouvel R., Schulte C., Schumacher J., Coors V., online publication, Hochschule für Technik Stuttgart, http://194.94.110.144/proceedings/pdf/BauSIM2012_103.pdf.
Armin G., Xinhua W., CC-Modeler: a topology generator for 3-D city models, ISPRS Journal of Photogrammetry & Remote Sensing 53 (1998), pp. 286–295.
Biason A., 2007. L'informazione territoriale di base nei sistemi informativi geografici. PhD Thesis, Politecnico di Torino.
Brunner T.,Einsatz von FME rund um das 3D Stadtmodell von Zürich, online publication, Stadt Zürich Geomatik+Vermessung http://www.fme-days.de/media/vortraege2011/
Brunner_StadtZ%C3%BCrich.pdf.
Corongiu M., Galetto R., RossiM., Spalla A., 2006. Cartografia numerica per i Database topografici e il 3D City Model dei Centri storici, Bollettino SIFET, pp.45-68.
Groger G., Plumer L., 2012. CityGML-Interoperable semantic 3D city models, ISPRS Journal of Photogrammetry and Remote Sensing 71, pp. 12–33.
Haala N., Kada M., An update on automatic 3D building reconstruction, 2010. ISPRS Journal of Photogrammetry and Remote Sensing 65, pp. 570-580.
Kada M., 2007. Generalization of 3D building models for Map-like Presentations, Spatial Information Theory, Winter S., Duckham M., Kulik L., Kuipers B., Berlin-Heidelberg, pp.399-404.
Kada M., The 3D Berlin Project, 2009. Photogrammetric Week '09, Heidelberg.
Kolbe T. H., Groger G., Towards Unified 3D City Models, 2003. Challenges, Geospatial Analysis, Integration and Visualization. Schiewe J., Hahn M., Madden M., Sester M., Stuttgart.
Koppers L., 3D-Stadtmodelle - Techniken, Trends, Visionen, online publication, Technische Universität München, 2/2004 http://www.dvwbayern.de/UserFiles/File/Veroeffentlichungen/ Mitteilungen/2004_2/Koppers.pdf.
Lazaroiu G., Roscia M., 2012. Definition methodology for the smart cities model, Energy 47, pp. 326-332.
Nachhaltige Erweiterung der Geodateninfrastruktur für 3D-Geodaten auf Basis von CityGML – am Beispiel der EU-Umgebungslärmkartierung, 2007. CzerwinskiA., Groeger G., DorschlagD., Stroh V. Kolbe T. H., Plumer L, Bonn-Berlin.
OpenGIS® City Geography Markup Language (CityGML) Encoding Standard. Reference number of this OGC® project document: OGC 08-007r1, Groeger G., Kolbe T.H., Czerwinski A., Nagel C. http://www.opengeospatial.org/legal/.
OpenGIS® City Geography Markup Language (CityGML) Encoding Standard. Reference number of this OGC® project document: OGC 12-019, Groeger G., Kolbe T.H., Nagel C. http://www.opengeospatial.org/legal/.
Reimers A., Fachtagung Public Space?-Virtual Space!, «Schöne neue Welten»: 3D-Stadtmodell Zürich und die realen Nutzer/innen, Hochschule Luzern, 2011 http://www.hslu.ch/download/s/public_space%202011/reimers. pdf.
Strzalka A., Alam N., Duminil E., Coors V., Eicker E., Large scale integration of photovoltaics in cities, 2012, Applied Energy 93, pp. 413–421.
Becker T., 2008. Eine softwaretechnische Lösung zur Generierung von CityGML-Gebäudenmodellen mittels Model Driven Architecture, Graduation Thesis, Bonn Univesrity.
Van Lammeren R., Houtkamp J., Colijn S., Hilferink M., Bouwman A., 2010. Affective appraisal of 3D land use visualization, in Computers, Environment and Urban Systems 34, pp. 465–475.
WangH. Song Y., Hamilton A., Curwell S., Urban information integration for advanced e-Planning in Europe, 2007. Government Information Quarterly 24, pp. 736–754.
Umsetzung der Umgebungslärmrichtlinie aus der Sicht des Landes Nordrhein- Westfalen, Lärmbekämpfung - Zeitschrift für Akustik, Schallschutz und Schwingungstechnik, 2/2007, pp. 7-15.
Acknowledgements
Authors would like to thank Celeste Rohani Saldin for her contribution in carrying out the research during her graduation thesis.
International Archives of the Photogrammetry, Remote Sensing and Spatial Information Sciences,


