CORRECTING ATTENUATION EFFECTS CAUSED BY INTERACTIONS IN THE
FOREST CANOPY IN FULL-WAVEFORM AIRBORNE LASER SCANNER DATA
K. Richter∗, N. Stelling, H.-G. Maas
Institute of Photogrammetry and Remote Sensing, Technische Universit¨at Dresden, Germany [email protected], [email protected], [email protected]
Commission III, WG III/2
KEY WORDS:full-waveform airborne laser scanning, attenuation correction, waveform history analysis
ABSTRACT:
Full-waveform airborne laser scanning offers a great potential for various forestry applications. Especially applications requiring information on the vertical structure of the lower canopy parts benefit from the great amount of information contained in waveform data. To enable the derivation of vertical forest canopy structure, the development of suitable voxel based data analysis methods is straightforward. Beyond extracting additional 3D points, it is very promising to derive the voxel attributes from the digitized waveform directly. For this purpose, the differential backscatter cross sections have to be projected into a Cartesian voxel structure. Thereby the voxel entries represent amplitudes of the cross section and can be interpreted as a local measure for the amount of pulse reflecting matter. However, the ’history’ of each laser echo pulse is characterized by attenuation effects caused by reflections in higher regions of the crown. As a result, the received waveform signals within the canopy have a lower amplitude than it would be observed for an identical structure without the previous canopy structure interactions (Romanczyk et al., 2012). If the biophysical structure is determined from the raw waveform data, material in the lower parts of the canopy is thus under-represented.
To achieve a radiometrically correct voxel space representation the loss of signal strength caused by partial reflections on the path of a laser pulse through the canopy has to be compensated. In this paper, we present an integral approach correcting the waveform at each recorded sample. The basic idea of the procedure is to enhance the waveform intensity values in lower parts of the canopy for portions of the pulse intensity, which have been reflected (and thus blocked) in higher parts of the canopy. The paper will discuss the developed correction method and show results from a validation both with synthetic and real world data.
1. INTRODUCTION
The characterization of the vertical forest structure is highly rele-vant for ecological research and for better understanding forest ecosystems. Small-footprint full-waveform laser scanning has been increasingly used in forestry applications for some years now, because it delivers measurements on physical attributes of vegetation canopy structure. Voxel based data-analysis methods have a great potential to derive biophysical forest parameters. Lindberg et al. (2012) point out that using ALS waveform data to describe the volumetric aspects of vertical vegetation structure is very promising. So far, new approaches are mostly based on the generation of 3D raster domains derived from extracted discrete 3D points (e.g. Reitberger et al. (2009), Leiterer et al. (2012), Hosoi et al. (2013)). Deriving voxel attributes from the digitized waveform directly instead of using a densified point cloud was proposed by Persson et al. (2005) and Buddenbaum et al. (2013).
We expect that these volumetric representations will facilitate the determination of parameters which could so far hardly be ex-tracted from airborne laser scanner data, for instance vertical and horizontal forest structure, open stem area, lower tree crown de-lineation and classification as well as the density of understory vegetation. Moreover, a significant improvement of the precision of biomass and biodiversity parameters can be expected. Gen-erating volumetric forest stand representations of high geometric and radiometric quality from full-waveform airborne laser scan-ner data requires a series of geometric and radiometric transfor-mations of the data into a voxel structure as well as an improved understanding of the interaction between laser pulse and pulse reflecting matter.
∗Corresponding author.
An important factor herein are attenuation effects caused by re-flections in higher regions of the crown. So far, these effects are either not considered or only considered in a very simple way. Lindberg et al. (2012) use an iterative normalization algorithm based on the Beer-Lambert law to compensate the attenuation of the signal energy as the signal propagates through a canopy. Al-louis et al. (2011) correct the aggregated waveform with a log-arithmic function. Furthermore, several simulation studies con-tribute to an improved understanding of signal-forest interactions (Sun and Ranson (2000), Liu et al. (2010), Pang et al. (2011), Romanczyk et al. (2012), Cawse-Nicholson et al. (2013)).
In order to derive the biophysical structure of a forest stand from full-waveform airborne laser scanner data, advanced methods for attenuation correction are required. Finding a suitable correction method will contribute to improve the accuracy of volumetric for-est reconstructions and enable forfor-estry applications which require accurate information in the understory of a forest canopy (Cawse-Nicholson et al., 2013). In this paper, we present an attenuation correction method based on a waveform history analysis.
The paper is divided into 5 parts: Part 2 treats the theoretical background, and part 3 describes the developed attenuation cor-rection model. The results of the validation with both synthetic and real world data are discussed in part 4. Finally a short con-clusion is given in part 5.
2. PHYSICAL PRINCIPLES AND RELATED WORK
signal, called received waveform. On one hand, the shape of the received waveform depends on several sensor parameters (shape of the laser pulse, receiver impulse function, pulse spreading), on the other hand on the backscattering characteristics of the target (Wagner et al., 2007). For spatially distributed targets, the re-turn signal is mainly a superposition of echoes from scatterers at different ranges. If the distance between the scatterers is larger than the range resolution of the ALS system, they produce dis-tinct echoes. Normally, the leaves and branches of vegetation are clustered at smaller distances. If the emitted laser pulse in-teracts with such a cluster, the original pulse is widened. All target properties, e.g. reflectivity, target size, and directionality of scattering, are summarized into one parameter: the differen-tial backscatter cross sectionσ(t). The formation of the received waveformPr(t)can be described mathematically as the result of
a convolution of the emitted laser pulsePe(t)and the differential
backscatter cross section. As shown in equation 1, the received signal depends on the aperture diameter of the receiver opticDr,
the rangeR, and the transmitter beam widthβ2
t (Wagner et al.,
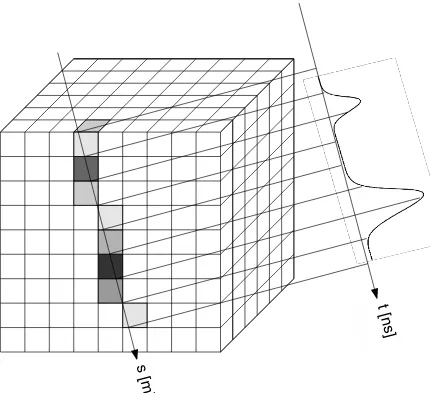
The most interesting quantity herein is the unknown backscatter cross section, which can be estimated by decomposition (Hofton et al., 2000) or deconvolution (Lucy (1974), Jutzi and Stilla (2006), Lawson and Hanson (1974), Roncat et al. (2011)) techniques. Depending on the chosen method, the cross section is treated as a sum of discrete values or as a continuous variable (Wagner et al., 2006). In the latter case, the differential backscatter cross section can be projected into a Cartesian voxel structure (Figure 1). The voxel entries represent the amplitudes of the correspond-ing differential backscatter cross section. The procedure of fillcorrespond-ing the voxel space has both geometric and radiometric aspects. The geometric aspects include an intersection of the diverging laser cone with the voxel structure and an interpolation procedure to obtain the actual voxel values. The differential backscatter cross section resulting from decovolution is in first instance only an ”apparent” cross section, because the measuring process is influ-enced by different attenuation effects. Therefore, the amplitudes of the backscatter cross section have to undergo some radiomet-ric correction before entering them into the voxel structure. There are two groups of attenuation effects which influence the emitted laser pulse and therefore the shape of received waveform and de-rived differential backscatter cross section – on the one hand the attenuation due to atmospheric effects, on the other hand the at-tenuation of the signal during its propagation through the canopy. The former is treated in several studies (H¨ofle and Pfeifer (2007), Wagner (2010)) and does not require a further discussion here. The latter issue is analyzed in more detail in the following sec-tion. After the radiometric correction, the voxel entries can be interpreted as a local measure for the amount of pulse reflecting matter.
In their simulation study, Cawse-Nicholson et al. (2013) used the Digital Imaging Remote Sensing Image Generation (DIRSIG) simulation environment to investigate the factors influencing the attenuation. DIRSIG waveform LiDAR simulation is a ray-tracing program which is able to model photon paths in a virtual scene. To simplify matters, the virtual forest structure was represented by a simple geometric model consisting of a couple of plates in several levels with predefined reflectance and transmission. Cawse-Nicholson et al. (2013) generated simulated waveforms in different experiments, performed a Gaussian decomposition to
Figure 1: Cartesian voxel structure with projected differential backscatter cross section
derive range, amplitude and standard deviation for each peak, and developed a correction factor based on the results of the Gaussian decomposition. Our correction method, that we applied to both simulated and real data in this study, is similar to their approach, even though it is not based on the detailed consideration of sin-gle photons. In contrast to their approach treating the attenuation theoretically in a simulation, our investigation starts from a prac-tical point of view (unknown tree geometry and reflectance). Our objective is to develop a correction method, which can be eas-ily applied to real full-waveform forestry data sets. Thereby, the correction term has to be derived from the digitized pulse echo it-self. Furthermore, our attenuation correction is derived from the complete recorded signal, not applying decomposition methods.
3. METHOD
During the propagation of the emitted laser pulse through a forest canopy, it interacts with different components (leaves, branches, forest floor). Depending on the material, the number of incom-ing photons is reduced due to reflection, transmission, absorption and scattering processes. Therefore, less photons are available for subsequent interactions in lower parts of the canopy. As a re-sult, the received waveform signal within the canopy has a lower amplitude than it would be observed for an identical structure without the previous (upper) canopy structure interactions (Ro-manczyk et al., 2013). If the biophysical structure is determined from the waveform raw data, the material in the lower parts of the canopy is thus not estimated correctly. The following consider-ations require that the attenuation due to atmospheric effects has already been corrected.
3.1 Attenuation Model
the pulse intensity is decreased continuously during the propa-gation, resulting in the extension of the discrete model to an in-tegral one. Please note that this approach modifies the shape of the backscattered signal and influences the geometric component of the signal. Strictly speaking, this is only valid for volumetric scatterers like leaves and branches, not for extended targets like the forest floor. In the following, the difference of the two attenu-ation models is first illustrated by means of our synthetic data set. The correction methods based on both models are discussed in 4. taking into account synthtic data as well as real world data.
3.2 Synthetic Data Set
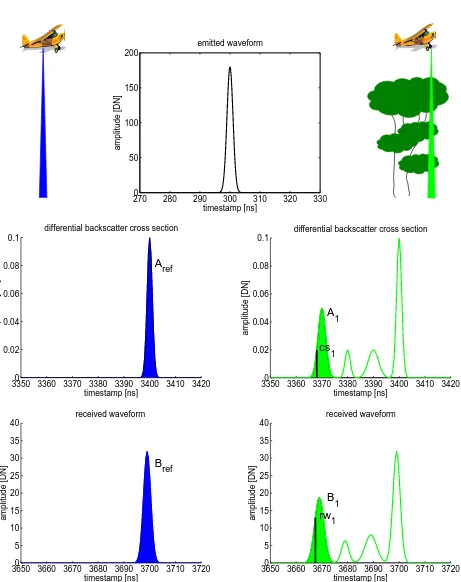
For validation purposes, we created a synthetic example (Figure 2) consisting of two cases: the undisturbed propagation of the emitted laser pulse to the ground without any interactions (left) which serves as reference, and the propagation through a canopy with interactions at three clusters and the forest floor (right). We designed a synthetic emitted waveform and two synthetic differ-ential backscatter cross sections, where the spatial expansion of the tree layers is considered. Please note that the cross sections are true differential backscatter cross sections directly correlated to the amount of pulse reflecting matter. An ideal received wave-form without attenuation effects is obtained by a convolution of emitted waveform and cross section. In the next step, the attenu-ation is taken into account by decreasing the received waveform with a linear attenuation factorai. The factor depends on the
por-tion of the laser pulse which is reflected at each interacpor-tion (dis-crete model) or waveform digitization sample (integral model). The reflected portion can be estimated from the relation between reference cross section and canopy cross section. For the discrete attenuation model (Figure 3), the attenuation factor is calculated from the ratio between the area under the reference cross section (Figure 2, blue) and the area under the cross section for each in-teractionA1−Ai(Figure 2, green).
ai= 1−AAi
ref
(2)
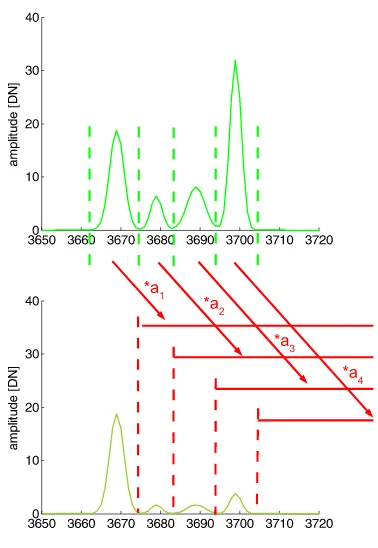
For the extension to the integral model (Figure 4), the areasA1− Aiare superseded by the amplitudescsiat each sample (Figure
2, black).
ai= 1− csi
Aref
(3)
3.3 Attenuation Correction
Beyond the discrete correction method published in (Richter et al., 2014), we developed an integral correction method to remove the above described attenuation effects. The procedure is based on the increase of the waveform intensity values in lower parts of the tree crown for portions of the pulse intensity, which have been reflected in higher parts of the crown. The attenuated received waveform can be corrected by stepwise increasing the amplitudes after each sample with an appropriate correction factorci.
As-suming that the attenuation of a laser pulse in the canopy fulfills the above described integral model, the correction factor can be developed by inverting the attenuation process. For this purpose, we calculate the proportionpiof the signal which was reflected
at the first sample by setting the amplituderwiof the received
waveform at the sample point in relation to the reference value
Bref(see figure 2, bottom):
pi=
rwi
Bref
(4)
Figure 3: Discrete attenuation model
2700 280 290 300 310 320 330 50
100 150 200
emitted waveform
timestamp [ns]
amplitude [DN]
3350 3360 3370 3380 3390 3400 3410 34200
0.02 0.04 0.06 0.08 0.1
differential backscatter cross section
timestamp [ns]
amplitude [DN]
A
ref
3350 3360 3370 3380 3390 3400 3410 34200
0.02 0.04 0.06 0.08 0.1
differential backscatter cross section
timestamp [ns]
amplitude [DN]
A
1
cs
1
3650 3660 3670 3680 3690 3700 3710 37200
5 10 15 20 25 30 35 40
received waveform
timestamp [ns]
amplitude [DN]
B
ref
3650 3660 3670 3680 3690 3700 3710 37200
5 10 15 20 25 30 35 40
received waveform
timestamp [ns]
amplitude [DN]
B
1
rw
1
Afterwards, we calculate a new reference value for the next inter-action:
Brefi+1=Brefi∗(1−pi) (5)
The attenuation correction factorciis obtained as follows:
ci=
Brefi
Brefi+1
(6)
In this way, the attenuated received waveform can be corrected by stepwise increasing the amplitudes with the appropriate cor-rection factorci. The deconvolution of emitted waveform and
corrected received waveform results in the enhanced differential backscatter cross section, which is corrected for attenuation ef-fects and can be inverted to the biophysical structure. Our cor-rection method is based on the (in fact only confinedly valid) as-sumption that all surfaces, which interact with the emitted laser pulse, have a similar reflectance. Strictly speaking, this applies only on synthetic data because the reflectance of leaves, branches and forest floor differ from each other. The results in section 4, however, show that the quality of the volumetric forest recon-struction is nevertheless considerably improved.
3.4 Reference Selection
As described in section 3.3, we have to estimate the proportion
piof the signal which was reflected at the first sample to
calcu-late the attenuation correction factorci. To estimate the reflected
proportion, information on the energy of the incoming laser pulse is required. Although the emitted waveform is recorded, a calcu-lation of the incoming signal is not possible due to the unknown amplification of the receiver channels. Therefore, another ref-erence value is needed. We assume that the maximal possible backscattered signal corresponds to the received waveform re-sulting from a propagation through the canopy without any in-teractions. The synthetic data set contains such a reference case (Figure 2) which make the reference value available. In case of real world data, a suitable reference value has to be derived from the recorded data set itself. For this purpose, we automatically detect all waveforms which fulfill the following requirements:
• laser pulse penetrates to the ground without any canopy
in-teractions (one peak on the ground)
• waveform is located between vegetation waveforms (to
ex-clude waveforms originating from forest tracks, clearings or fields)
• waveform is recorded close to the nadir of the scan lines
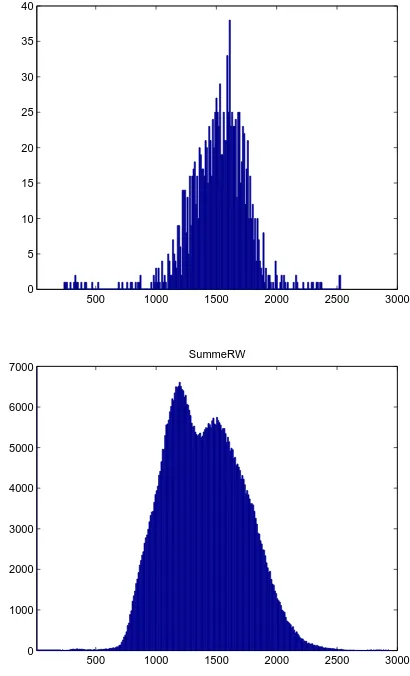
As can be seen in the histogram of all eligible reference wave-forms in Figure 5 (top), the integrals considerably differ. One might either choose the mean value rvmeanof the areas under all
eligible waveforms (for this data set 1516,σ= 251) or the max-imum value rvmax (here 2531) as a reference value. The
refer-ence value should actually be larger than the integrals of all other vegetation-waveforms because those are influenced by attenua-tion effects. The comparison with the histogram of all received waveforms in figure 5 (bottom) shows that this is not the case. The value derived in this way is more likely too small because the forest floor has mostly a lower reflectance than the leaves. Alternatively, the waveform with the highest integral (rvmax all=
500 1000 1500 2000 2500 3000 0
500 1000 1500 2000 2500 3000 0
Figure 5: Histogram of the integrals of all eligible reference waveforms (top), histogram of the integrals of all waveforms (bottom)
2900), which results from the interaction with vegetation and for-est floor, could be used. We have to take into consideration that the size of the correction factor significantly depends on the selec-tion of the reference value. If it is too low, the correcselec-tion factor becomes too large, and vice versa. In the process of validation we investigated the different variants for reference selection. The results are presented in section 4.
4. RESULTS AND DISCUSSION
4.1 Validation with synthetic data
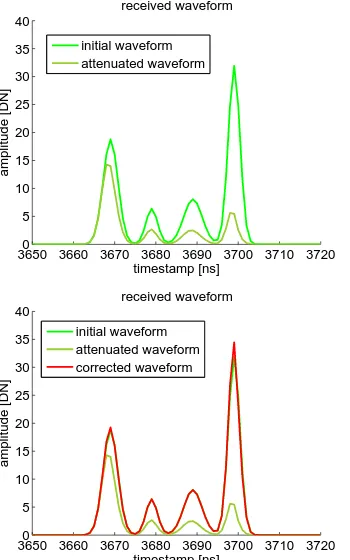
We generated the synthetic data as described in section 3.2. Fig-ure 6 (top) shows the initial received waveform resulting from the convolution of synthetic emitted waveform and synthetic differ-ential backscatter cross section as well as the received waveform after consideration the attenuation. The results of the attenua-tion correcattenua-tion are presented in figure 6 (bottom). Herein, initial waveform and the corrected waveform lie in top of each other, proving that they are identical (as expected).
4.2 Validation with real world data
3650 3660 3670 3680 3690 3700 3710 37200
3650 3660 3670 3680 3690 3700 3710 37200 5
Figure 6: Initial and attenuated waveform (top), received wave-form after applying the integral correction method (bottom)
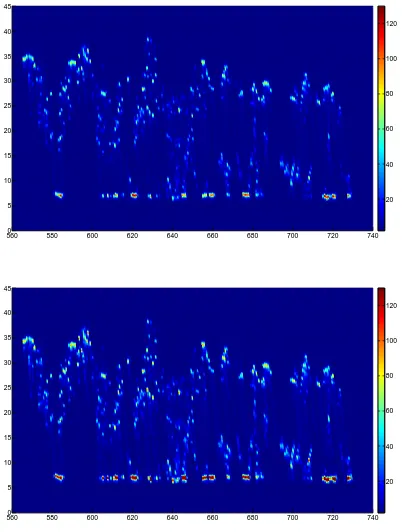
The comparison of the raw data and the corrected data after ap-plying the integral correction method shows the benefit of the de-veloped correction method. As an example, the data of a section of one scan line is visualized as a vertical view with color coded waveforms (Figure 7). An improvement of the forest structure representation in the lower parts of the canopy can clearly be rec-ognized.
Assessing the quality of the attenuation correction method, we have to take into consideration that the result of the correction sig-nificantly depends on the proper selection of the reference value
Bref. Figure 8 shows the comparison of raw data and corrected
data based on the different reference selection variants. For com-pleteness, the correction result of the discrete correction method (Richter et al., 2014) with rvmaxas reference value is also shown.
In general, the integral correction method provides a stronger cor-rection than the discrete method. The data is only weak corrected with the discrete method. The chosen example highlights a ma-jor advantage of the integral method: the independence of peak detection. An important factor (and a weakness) in the discrete method is the reliability of the peak detection. The used min-ima/maxima search algorithm provides a simple and fast detec-tion of peaks but is not able to find entirely every one.
Depending on the selected reference value, the correction results of the integral method vary in strength. Selecting rvmean, the
cor-rection turns out to be stronger than expected for many wave-forms, even though this effect is not very distinctive in the chosen example. In some cases, the corrected amplitude of the ground reflection becomes higher than the amplitude of the reference waveform (that also result from ground reflections). Assuming a homogeneous reflectance of the forest floor, the amplitudes of both ground reflections should actually be equal. Obviously, the reference value is set too small in such a case. It is therefore
8600 865 870 875 880 50
100
timestamp [ns]
amplitude [DN]
integral correction rvmean
8600 865 870 875 880 50
100
timestamp [ns]
amplitude [DN]
integral correction rvmax
8600 865 870 875 880 50
100
timestamp [ns]
amplitude [DN]
integral correction rvmax all
8600 865 870 875 880 50
100
timestamp [ns]
amplitude [DN]
discrete correction rvmax
Figure 8: Comparison of raw data and corrected data with dif-ferent correction methods and reference values (rvmean/rvmax =
mean/maximum value of the areas under all eligible waveforms, rvmax all= highest occurring integral considering all waveforms),
green: attenuated waveform, red: corrected waveform, black: de-tected peaks
recommended to prefer a larger reference value to avoid over-correction. However, with rvmean allas reference value, the data
remains rather weakly corrected for the majority of waveforms. As a compromise, the solution with rvmaxseems most plausible.
This statement has to be verified with further tests.
5. CONCLUSION
In this study, we developed an integral correction method to com-pensate for attenuation effects caused by reflections in higher re-gions of the canopy. Generating volumetric forest stand repre-sentations from corrected waveform data leads to a significant improvement of the radiometric quality of voxel data. Thus, the accuracy of forest parameters derived from the volumetric repre-sentation will improve, especially for applications extracting in-formation on the vertical structure of the lower canopy parts. In-evitably, the presented correction method is based on confinedly valid assumptions. Nevertheless, accepting those assumptions will usually lead to a better result than determining forest param-eters from uncorrected data.
Further experimental investigations are needed to assess which correction approach conforms best to the physical reality. For this purpose, a recreated tree model of exactly known geometry will be scanned with a terrestrial full waveform laser scanner to evaluate the functionality of the correction methods. Addition-ally, better insight about the selection of the reference value can be derived from these measurements.
ACKNOWLEDGEMENTS
5600 580 600 620 640 660 680 700 720 740 5
10 15 20 25 30 35 40 45
20 40 60 80 100 120
5600 580 600 620 640 660 680 700 720 740
5 10 15 20 25 30 35 40 45
20 40 60 80 100 120
References
Allouis, T., Durrieu, S., V´ega, C. and Couteron, P., 2011. Ex-ploiting fullwaveform lidar signals to estimate timber volume and above-ground biomass of individual trees. In: Geoscience and Remote Sensing Symposium (IGARSS), 2011 IEEE Inter-national, IEEE, pp. 1251–1254.
Buddenbaum, H., Seeling, S. and Hill, J., 2013. Fusion of full-waveform lidar and imaging spectroscopy remote sensing data for the characterization of forest stands. International Journal of Remote Sensing 34(13), pp. 4511–4524.
Cawse-Nicholson, K., van Aardt, J., Romanczyk, P., Kelbe, D., Krause, K. and Kampe, T., 2013. A study of energy attenuation due to forest canopy in small-foorprint waveform lidar signals.
H¨ofle, B. and Pfeifer, N., 2007. Correction of laser scanning in-tensity data: Data and model-driven approaches. ISPRS Jour-nal of Photogrammetry and Remote Sensing 62(6), pp. 415– 433.
Hofton, M. A., Minster, J. B. and Blair, J. B., 2000. Decompo-sition of laser altimeter waveforms. Geoscience and Remote Sensing, IEEE Transactions on 38(4), pp. 1989–1996.
Hosoi, F., Nakai, Y. and Omasa, K., 2013. Voxel tree modeling for estimating leaf area density and woody material volume using 3-D LIDAR data. pp. 103–108.
Jutzi, B. and Stilla, U., 2006. Range determination with wave-form recording laser systems using a wiener filter. ISPRS Jour-nal of Photogrammetry and Remote Sensing 61(2), pp. 95– 107.
Lawson, C. L. and Hanson, R. J., 1974. Solving least squares problems. Vol. 161, SIAM.
Leiterer, R., Morsdorf, F., Torabzadeh, H., Schaepman, M. E., Mucke, W., Pfeifer, N. and Hollaus, M., 2012. A voxel-based approach for canopy structure characterization using full-waveform airborne laser scanning. In: Geoscience and Remote Sensing Symposium (IGARSS), 2012 IEEE Interna-tional, IEEE, pp. 3399–3402.
Lindberg, E., Olofsson, K., Holmgren, J. and Olsson, H., 2012. Estimation of 3d vegetation structure from waveform and dis-crete return airborne laser scanning data. Remote Sensing of Environment 118, pp. 151–161.
Liu, D., Sun, G., Guo, Z., Ranson, K. J. and Du, Y., 2010. Three-dimensional coherent radar backscatter model and simulations of scattering phase center of forest canopies. Geoscience and Remote Sensing, IEEE Transactions on 48(1), pp. 349–357.
Lucy, L. B., 1974. An iterative technique for the rectification of observed distributions. The astronomical journal 79, pp. 745.
Pang, Y., Lefsky, M., Sun, G. and Ranson, J., 2011. Impact of footprint diameter and off-nadir pointing on the precision of canopy height estimates from spaceborne lidar. Remote Sens-ing of Environment 115(11), pp. 2798–2809.
Persson, ˚A., S¨oderman, U., T¨opel, J. and Ahlberg, S., 2005. Vi-sualization and analysis of full-waveform airborne laser scan-ner data. International Archives of Photogrammetry, Remote Sensing and Spatial Information Sciences 36(part 3), pp. W19.
Reitberger, J., Schn¨orr, C., Krzystek, P. and Stilla, U., 2009. 3D segmentation of single trees exploiting full waveform lidar data. ISPRS Journal of Photogrammetry and Remote Sensing 64(6), pp. 561–574.
Richter, K., Stelling, N. and Maas, H.-G., 2014. Attenuation correction of full-waveform airborne laser scanner data for improving the quality of volumetric forest reconstructions by simplified waveform history analysis. In: Proceedings of the 34th EARSeL Symposium - 2nd International Workshop of Special Interest Group on Forestry, 17-18 June, Warsaw, Poland.
Romanczyk, P., Kelbe, D., van Aardt, J., Cawse-Nicholson, K., McGlinchy, J. and Krause, K., 2012. Assessing the impact of broadleaf tree structure on airborne full-waveform small-footprint lidar signals. Silvilaser Proceedings pp. 16–19.
Romanczyk, P., van Aardt, J., Cawse-Nicholson, K., Kelbe, D., Strahler, A., Schaaf, C., Krause, K. and Ramond, T., 2013. Quantifying the attenuation due to geometry interactions in waveform lidar signals. In: AGU Fall Meeting Abstracts, Vol. 1, p. 07.
Roncat, A., Bergauer, G. and Pfeifer, N., 2011. B-spline deconvo-lution for differential target cross-section determination in full-waveform laser scanning data. ISPRS Journal of Photogram-metry and Remote Sensing 66(4), pp. 418–428.
Sun, G. and Ranson, K. J., 2000. Modeling lidar returns from forest canopies. Geoscience and Remote Sensing, IEEE Trans-actions on 38(6), pp. 2617–2626.
Wagner, W., 2010. Radiometric calibration of small-footprint full-waveform airborne laser scanner measurements: Basic physical concepts. ISPRS Journal of Photogrammetry and Re-mote Sensing 65(6), pp. 505–513.
Wagner, W., Roncat, A., Melzer, T. and Ullrich, A., 2007. Wave-form analysis techniques in airborne laser scanning. Interna-tional Archives of Photogrammetry and Remote Sensing 36(3), pp. 413–418.