USE OF GREENDRONE UAS SYSTEM FOR MAIZE CROP MONITORING
Ahmad Kamal Nasir, Mohbat Tharani
Electrical Engineering Department, School of Science and Engineering, LUMS, Pakistan (email: {ahmad.kamal, 16060073}@lums.edu.pk)
KEY WORDS: UAS, Remote Sensing, Multispectral Images, Orthomosaic, NDVI, Precision Agriculture, GreenDrone
ABSTRACT:
This research work presents the use of a low-cost Unmanned Aerial System (UAS) – GreenDrone for the monitoring of Maize crop. GreenDrone consist of a long endurance fixed wing air-frame equipped with a modified Canon camera for the calculation of Normalized Difference Vegetation Index (NDVI) and FLIR thermal camera for Water Stress Index (WSI) calculations. Several flights were conducted over the study site in order to acquire data during different phases of the crop growth. By the calculation of NDVI and NGB images we were able to identify areas with potential low yield, spatial variability in the plant counts, and irregularities in nitrogen application and water application related issues. Furthermore, some parameters which are important for the acquisition of good aerial images in order to create quality Orthomosaic image are also discussed.
1. INTRODUCTION
The use of UAS for civilian applications such as precision agriculture and forestry as remote sensing device is increasing owing to the availability of low-cost sensors and system (Nebiker, S. et al. 2000; S. A. Aziz, et al.2004). ResearchMoz, in a Jan 2014 report, projected that the agricultural robot market size to grow from $817 million in 2013 to $16.3 billion by 2020. The use of farm inputs, particularly of fertilizers, is inadequate and the fertilizer delivery methods are very inefficient. With the increasing cost of agriculture inputs, it is essential for sustainable farming that the agriculture inputs should be efficiently used to increase the crop production.
The qualitative and quantitative report of site-specific farm soil and crop help the farmer to make best use of fertilizers, pesticides and water. Variable rate application based on site-specific field information is the key to reduce input cost and to increase yield. The farm management zones, ground gradient, relative biomass, high resolution color and health map are some of the site-specific field information required by the farmer to control and properly apply the agriculture inputs.
A “management zone” is a sub-region of a field that expresses a relatively homogeneous combination of yield limiting factors for which a single rate of a specific crop input is appropriate. The ground gradient provides information regarding field irrigation plan and ground laser levelling. The high-resolution crop vigor helps to precisely identify unhealthy areas without manual field scouting. Unmanned Aerial Vehicle (UAV) equipped with a Multi-spectral cameras (Khanna R. et al., 2015; D. Anthony et al., 2014) assist in achieving this goal in minimum amount of time and provides much more detailed information about the farm as compared traditional scouting technique. The advantages of using such system are low temporal resolution, independence from weather conditions such as cloud covers and very high resolution maps for site specific advice.
Fertilizers are not cheap and therefore, it is essential that they should be efficiently and effectively used to produce maximum increase in crop yields so that farmers receive the best possible outputs from their expenses. However, the increased in the usage of fertilizer is not delivering optimum yield because of not using standardized practices. The fertilizer consumption (Kg/ha of
arable land) for US is 131.9 while for Pakistan is 135.25 (World Bank, 2016). On the contrary US is having three times more cereal production using almost similar amount of fertilizer per hectare. There are several problems which are impeding the balance and efficient use of fertilizers (Juliane et. al., 2015). These are commonly not providing fertilizers at the right time at the right place in the field, improper application methods and time and lack of knowledge among farmers about the need for balanced fertilizer applications (Agüera, F. et al., 2011). It is not a static but a dynamic concept. An Optimum fertilization strategy is the only way to ensure a sustainable agriculture that can provide the world population with high quality food while minimizing the impact on the environment. The scarcity of water and increasing prices of agricultural inputs needs proper study of crops especially for under developing countries such as Pakistan. We monitored winter maize crop using a UAS in order to improve crop production, which is the main source of fodder for dairy farms.
2. STUDY AREA AND DATA COLLECTION
The study was conducted at Sar-Sabz Nestle-Pakistan Farms Renla-Khurd, Pakistan (30.9167 N, 74.7165 E) where the ground elevation varies from 180m to 190m as shown in the figure 1.
Figure 1. Study-site of Nestle-Pakistan’s Sar-Sabz Farms Renla-Khurd
The study site has a total area of 135 acres and divided into two regions as shown in the figure 2. The first region is of 95 acres while the other is 40 acres. Each region is further subdivided into blocks of area 2.5 acres for management purpose. The figure overlays the NDVI orthomosaic of the study site and each acre’s boundary over the satellite map of the area. The study site is used to grow maize crop three times in a year.
Figure 2. NDVI Orthomosaic of the study-site overlaid on the satellite map
The study site is surveyed five times during the winter season, each time at different heights in order to access the quality of orthomosaic image. The first flight was conducted on 12th
November, 2016, at a height of 100m above ground level at 1400 hours. Two weeks after the first flight, on 26th November, 2016,
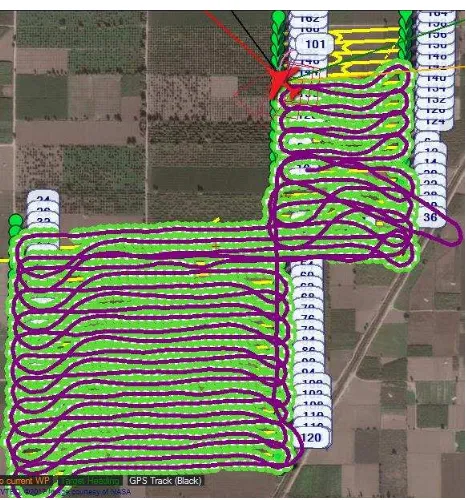
two more flights were conducted at the height of 100m and 50m at 1330 and 1430 hours, respectively. Four weeks after the second flights, two more flights were conducted at the height of 80m and 60m at 1245 and 1345 hours, respectively. During each flight the UAV cruise speed was set to 10 m/sec. The flight was planned in such a way that there is 80 percentage lateral image overlap. During each flight the UAV took-off autonomously after being thrown in the air, as shown in the figure 3, and followed a series of way-points, as shown in figure 4.
Figure 3. Automatic take-off of the GreenDrone UAV
The UAV has flown along the planned waypoints taking images at locations scheduled by the mission planner software. Different
Figure 4. Planned and logged trajectory of a flight
3. MATERIALS AND METHODS
3.1 Hardware
The aerial survey is conducted using a custom long endurance fixed wing platform developed at LUMS. The system was developed to overcome the limitation to survey large areas using low-cost systems. The use of fixed wing topology is mainly for the long endurance and to decrease vibration, without the use of motorized gimbal, which is an essential consideration for large area mapping mission. The UAV is equipped with a custom modified NDVI camera in order to create a dense 3D point cloud map. The complete system consist of a fixed wing UAV with on-board electronics and NDVI camera, a pilot RC transmitter and a ground control station as shown in figure 5. The ground control station consist of a mission planner software along with a tele-metery module for real-time flight management. The wingspan of the UAV is 1.72m and the length of the UAV is 1.18m. The weight of the fully assembled system is 3Kg and the payload capacity is about 1Kg. The maximum cruise speed of the plane is 90 kph and has a flight endurance of 60-90 minutes.
The UAV is equipped with a modified 12.1 mega pixel canon SX260HS camera for image acquisition. The internal IR filter is replaced with a custom NGB (Near-Infrared, Green, Blue) band-pass filter glass to block red light and instead record near-infrared light above 700nm wavelength. Furthermore, the camera is installed with Canon Hacker’s Development Kit (CHDK) to automatically capture images every second. The camera has an internal GPS which records the geographic coordinate of the area along with each image. A special UAV camera mounting is designed and fabricated using a 3D printer in order to reduce camera vibration.
The flight height, camera shutter speed and focus do have an effect on results of 3D point cloud generation.During a test flight the images were analysed and it was found out that the image time-stamp was varying between 3-10 second. It was further investigated and found to be caused by the autofocus setting of the camera. During the second test flight autofocus was disabled and the focus was manually set to infinity. This resulted into blurred images but the software was able to stitch the images together. The blur effect was investigated and found to be caused by the auto shutter time. In the third test flight, the shutter time was also fixed to 1/2000 second.
3.2 Photogrammetry
It is a science of making measurements from images. Photogrammetry process involves pre-processing of input images followed by the ortho-rectification of the images. Now a days, because of the availability of cheap computational power, many free and commercial software are available which have automated the photogrammetric process. The images acquired during aerial survey have a resolution of 4000x3000 pixels while the camera’s CMOS sensor has a width of 6.17mm and height of 4.55mm. The images were captured in camera’s nadir position. The image data were later processed independently using two different software namely visualSfM (Wu, C., 2011) and Pix4D (Christoph S, 2017). The visualSfM is a GUI based free tool that automate the SfM (Structure from Motion) process on input images on a multicore system with GPU installed. It is developed by university of Washington and Google Inc. The software uses bundle adjustment with Levenberg-Marquardt algorithm (K. Levenberg, 1944) to determine camera’s intrinsic and extrinsic parameters.
Pix4D is a commercial tool which is able to make 3D models from input images. The software detects salient features in input images followed by feature matching and thereafter constructing 3D dense point cloud from matched features along with camera poses. Furthermore, the software can generate an ortho-rectified mosaic from the input images. The ortho-rectified image has a Ground Sample Distance (GSD) which is dependent on the UAV flight height.
A quick comparison has revealed that Pix4D creates a denser point cloud compared to VisualSfM. Both of the software are run on an Intel Core i5, 3.3 Ghz, Quad-core PC with 16GB RAM installed and SSD hard disk.
4. RESULTS
The following table presents the results of flights and post processing details on the acquired imagery. There were five
flights conducted during three different days. Flight images were post processed using Pix4D software to create orthomosaic images and 3D point clouds. The software offers different settings (Low, Medium, and High) for images alignment, feature matching, dense point cloud creation, digital surface model and orthomosaic creation. Each flight data was processed using different photogrammetric settings of the software. For each flight data different settings were tested and the optimum settings which resulted in the correct alignment of images are used to create the orthomosaic image. The different settings are presented in table 1.
Table 1. Flights and post-processing details (*without orthomosaic creation)
To achieve a higher GSD, the flights must be conducted at a low altitude but this reduces the coverage area and increases the number of images and flight duration. Furthermore, due to smaller field of view, at lower altitude, crop canopy appears to be flat and similar which generated some voids and at some areas misaligned point cloud. These artifacts were manually removed by removing some low quality images. A view of the generated 3D point cloud is shown in the figure below.
Figure 6. 3D point cloud of the test site The International Archives of the Photogrammetry, Remote Sensing and Spatial Information Sciences, Volume XLII-2/W6, 2017
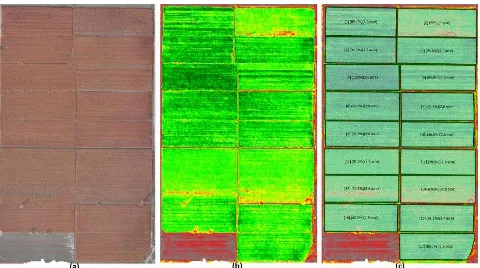
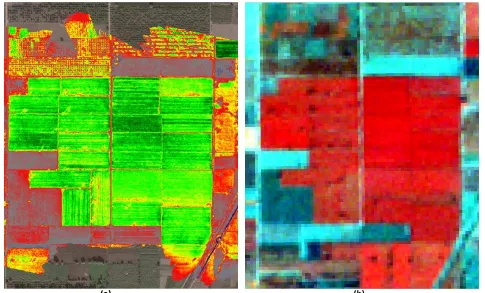
Figure 7. Resultant NDVI Orthomosaic of (a) 12th November (b) First flight of 26th November (c) First flight of 17th December 2016
Figure 8. Resultant (a) NGB (b) NDVI Orthomosaic of first flight
Figure 7 presents three NDVI vigour map of the study site captured on 12th November, 26th November and 17th December,
2016. The green colour indicates healthier crop whereas the red colour indicates relatively low health of plants. From the figure 7 the relative maize crop health is clearly visible. During the initial phase of the crop cycle the crop health is almost uniform except some areas in the top-right corner and middle. Figure 8 shows detailed NGB and NDVI map of the the right half of the figure 7(a). There were total 18 management zones in the figure 8(c), 17 zones contain the maize crop and one contains bare soil. All management zones were labelled with zone numbers, relative NDVI and the zone areas. Each zone has area of about 2.5 acres. Out of 17 zones, zone five has the highest relative NDVI index (100%), whereas zone 14 has relatively lowest NDVI index (69.9%). The crop health is represented as a percentage with respect to the most vigorous zone. This relative health map can
4.1 Water-Logging
Zone 2, 13 and 14 in figure 8(c) were identified as weak zones and the information was provided to the farm management team. It was identified that the low crop vigor in these zones were due to rain water logging a few days before the flight was conducted. This also highlighted the fact that the water logging was due to uneven ground level in these zones, therefore, laser land-levelling is required before the next crop cycle. Due to rain water logging some plants were damaged which resulted relatively smaller plant density. The lesser number of plants were observed in the logged region which are highlighted in figure 9. This caused a significant decrease in the yield of zone 2.
Figure 9. Low plants count problem due to water logging
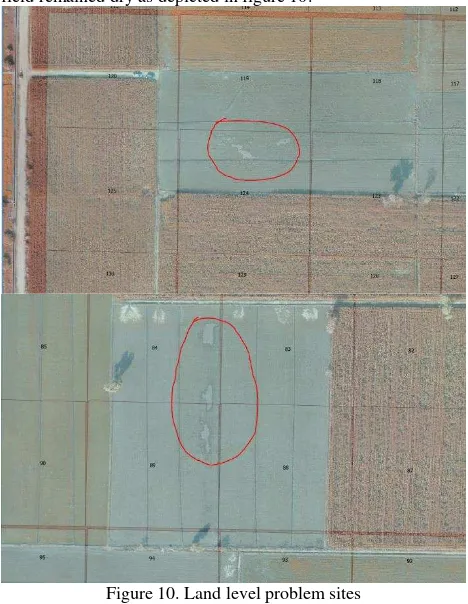
4.2 Improper ground levelling
Along with water logging, we also observed on the un-cultivated parts of the study-site that the farm needs laser levelling as there was no proper water levelling. Due to not having proper water levelling, some parts did get more water whereas some parts of field remained dry as depicted in figure 10.
Figure 10. Land level problem sites 4.3 Non-Uniform Sowing
The maize seeds were sown manually by the farm labor. The areas with non-uniform plant density were also clearly identifiable from the ortho-rectified mosaic image, as shown in the figure 11, which indicates that an aerial survey a few days after sowing is necessary so that plant density can be made uniform by seeding more plants.
Figure 11. Non-Uniform sowing pattern by labor
4.4 Non-uniform application of Nitrogen
The fertilizers were supplied to soil by mixing in water. However, due to flood irrigation there was irregular supply of Nitrogen in the field, as shown in figure 11. The areas nears water inlet showed more nitrogen concentration which implies that nitrogen is not uniformly distributed throughout the field.
Figure 12. Nitrogen Concentration problem due to flood irrigation
5. DISCUSSION
During the previous winter cycle of the maize crop, the average yield was reported to be 15 ton/acre while the average yield for the studied cycle was reported to be 14 ton/acre. Thus, we attribute the decline in yield due to improper supply of water, fertilizers, improper land levelling, flood irrigation and three crop cycles in a year which decreases soil nutrients. This has also demonstrated the effectiveness for the use of GreenDrone UAS system for better crop management and production.
To validate the accuracy of calculated NDVI images, we have compared the NDVI of our collected data on November 12th
2016, with the calculated NDVI image of Sentinel-2A Satellite of November 14th 2016. By qualitative analysis we find them
quite similar as shown in the figure 13, though there is noticeable difference in pixel resolution i.e. 3 cm/pixel in UAV data and 10 m/pixel in the satellite data.
In the future, we aim to work on yield estimation from the 3D point cloud and soil analysis and weed detection (Peña et. al., 2013) using GreenDrone.
Figure 13. NDVI Image comparison (a) UAS image (b) Satellite (Sentinel-2A) image
ACKNOWLEDGEMENTS
The author would like to thank Nestle-Pakistan for the arrangements of the test flights and the support from their staff for the data collection.
REFERENCES
Agüera, F., Carvajal, F., and Pérez, M.: MEASURING
SUNFLOWER NITROGEN STATUS FROM AN
UNMANNED AERIAL VEHICLE-BASED SYSTEM AND AN ON THE GROUND DEVICE, Int. Arch. Photogramm. Remote Sens. Spatial Inf. Sci., XXXVIII-1/C22, 33-37, doi:10.5194/isprs archives-XXXVIII-1-C22-33-2011, 2011.
D. Anthony, S. Elbaum, A. Lorenz, and C. Detweiler, “On crop height estimation with uavs,” in Intelligent Robots and Systems (IROS 2014), IEEE/RSJ International Conference on. IEEE, 2014, pp. 4805–4812
Khanna R., Möller M., Pfeifer J., Liebisch F., Walter A., Siegwart R. (2015a): Beyond Point Clouds - 3D Mapping and Field Parameter Measurements using UAVs. Int. Conf. on Emerging Technologies and Factory Automation, vol. 20th. Luxembourg: IEEE; 2015.
K. Levenberg, A Method for the Solution of Certain Non-Linear Problems in Least Squares, Quarterly of Applied Mathematics vol2, 164-168, 1944.
Nebiker, S., Annen, A., Scherrer, M. and Oesch, D., 2008. A light-weight multispectral sensor for micro uav opportunities for
Christoph S, Pix4D, https://pix4d.com/, (accessed March 30, 2017)
Researchmoz Global Pvt Ltd, Agricultural Robots: Market Shares, Strategies, and Forecasts, Worldwide, 2014 to 2020, Winter Green Research Inc., Jan 2014.
S. Gao, Z. Niu, G. Sun, D. Zhao, K. Jia, & Y. Qin, Height Extraction of Maize Using Airborne Full-Waveform LIDAR Data and a Deconvolution Algorithm IEEE Geoscience and Remote Sensing Letters,12(9), 1978-1982, 2015.
S. A. Aziz, B. L. Steward, S. J. Birrell, D. S. Srestha, and T. C. Kaspar, “Ultrasonic sensing for corn plant canopy characterization,” in In proceedings of ASAE/CSAE Annual International Meeting, 2004.
The World Bank, Food and Agriculture Organization, electronic
files, 2016,
http://data.worldbank.org/indicator/AG.CON.FERT.ZS, (accessed December 20, 2016)
Wu, C., 2011, VisualSFM: A Visual Structure from Motion System, http://ccwu.me/vsfm/, (accessed March 30, 2017)
Peña, J.M., Torres-Sánchez, J., de Castro, A.I., Kelly, M. and López-Granados, F., 2013. Weed mapping in early-season maize fields using object-based analysis of unmanned aerial vehicle (UAV) images. PLoS One, 8(10), p.e77151.
Juliane Bendig, Kang Yu, Helge Aasen, Andreas Bolten, Simon The International Archives of the Photogrammetry, Remote Sensing and Spatial Information Sciences, Volume XLII-2/W6, 2017