Página 1 de 32
11
thInternational Junior Science Olympiad
Experimental Test: Answer Sheet
Experimental Test:
Answer Sheet
December 8
th, 2014
Time: 4 hrs
Marks: 40
[Section 1: 25.0 Marks, Section 2: 15.0 Marks]
Complete the following:
NAME:
1. ________________________________________________
2. ________________________________________________
3. ________________________________________________
SEAT N°:
COUNTRY:
SIGNATURE
1. ________________________________________________
2. ________________________________________________
SECTION 1: ALCOHOLIC FERMENTATION
[25.0 Marks]D.
Recording experimental data of fermentation.
D.3.
Table 1.1: Recording fermentation data
[8.5 Marks=7.0 (Record data) + 1.5 (Flow calculation)]Initial temperature of warm water for preparing suspension A and solution B:
Initial Temperature of suspension A+B (inside reaction flask):Time [min]
E. Recording Experimental data of fermentation reactivation
[2.5 Marks=2.0 (Record data) +0.5 (Flow calculation)]E.7. TABLE 1.2. Time [min]
Accumulated gas volume Va(t); [ml]
F. Identification of the gaseous product
F.1 Reaction with Ca(OH)2.F.1.3. Choose the correct answer by ticking the appropriate box. [0.5 Marks]
White precipitate is observed
Black precipitate is observed
Precipitate is not observed
F.2.Reaction with bromthymol blue indicator
F.2.2.1.. Choose the correct answer by ticking the appropriate box. [0.2 Marks]
Yellow color is observed
Blue color is observed
Red color is observed
White color is observed
F.2.2.2. What can you deduce from the observation of the bromothymol blue solution? (Mark the correct answer). [0.2 Marks]
An increase in pH
A decrease in pH
No change in pH
G. Data processing and analysis
G.2. Plot the data of Table 1.1.and Table 1.2. [2.5 Marks]
G.3.1. Amount (in grams) of metabolized glucose at t=40 min. [1.0 Marks] Resolution
G.3.2.2. Natural logarithm (ln) calculation. Fermentation stage corresponding to a decrease rate of gas production .
Table 2.1.[0.5 Marks]
G.3.2.3. Plot the data of Table 2.1 [1.0 Marks] GRAPH C: ln F vs. time [min]
G.3.2.5. Data fitting
Calculation of the slope of the calibration curve (A) [0.3 Marks] Resolution
Answer
Calculation of the intercept of the calibration curve (B) [0.3 Marks] Resolution
Table 2.2: Linear equation of calibration curve
[0.1 Marks for equation]
G.3.2.6. Hypothetical volume (Vh) of fermentation. [0.2 Marks]
Resolution
Answer
Linear equation
Slope(A)
G.3.2.7. Mass of glucose that corresponds to the volume Vh of CO2 [0.4 Marks]
Resolution
G.3.2.8. Total Mass of Glucose fermented during the 40 min fermentation [0.2 Marks] Resolution
Answer
G.3.2.9. Total Mass of CO2 produced by the glucose consumed [0.4 Marks]
Resolution
G.3.2.10. Mass of CO2released to the graduated cylinder during the 40 min fermentation [ 0.4 Marks] Resolution
Answer
G.3.2.11. Mass of CO2 dissolved in the reaction flask. [0.2 Marks]
Resolution
G.3.2.12. Solubility of CO2 (g/L) in the reaction flask. [0.3 marks] Resolution
Answer
G.3.3. Moles of ethanol produced at t=40 min. [0.4 Marks]
Resolution
G.3.4. Concentration of ethanol ( % w/v) produced at t=40 min. [0.5 Marks]
Resolution
Answer
G.3.5. Justification of the fermentation process stopping. Choose the primary reason by ticking the
appropriate box. Consider alcohol concentration calculated previously (G.3.4) , and toxic concentration threshold for yeast, which is 14 g/100 ml (w/v). [0.5 Marks]
a. Death yeast
b. Inhibition of yeast due to the concentration of alcohol.
SECTION 2: REFRACTOMETRIC DETERMINATION OF SUCROSE
CONCENTRATION
[15.0 Marks]B.
PREPARATION OF CALIBRATION CURVE
B.1. Preparation of standard solutions of different concentration
B.1.1. Calculation of sucrose solution volume (62.5 g/100 ml) for preparation of standard solutions.[1.2 Marks]
Solution A
Solution E
Table 3.1:
Summary of standard solutions data
Solution identification
Initial Concentration [g/100 ml]
Initial Volume [ml]
Final Concentration [g/100 ml]
Final Volume [ml]
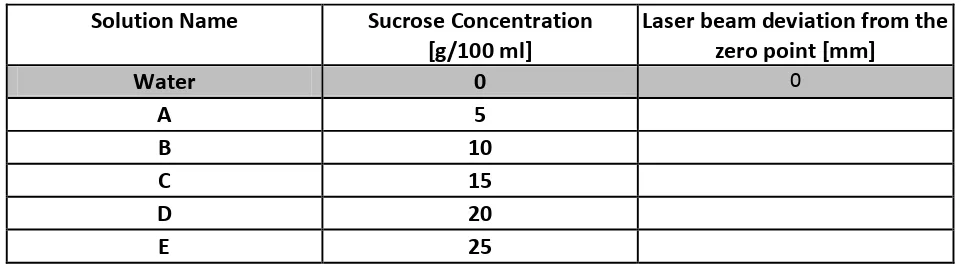
Table 3.2:
Calibration curve data [4.0 Marks]
Solution Name Sucrose Concentration
[g/100 ml]
Calculation of the slope of the calibration curve (A)
Answer
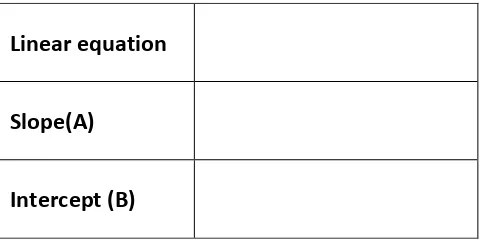
Table 3.3:
Linear equation of calibration curve
Linear Equation
Slope
Intercept
C. Samples analysis
C.1.7.
Data of samples with unknown sugar concentration
Table 3.4:
Data of analyzed samples
[2.1 Marks]
Unknown Samples Millimeters deviation
[mm] ID # X
C.2. Determine the sucrose concentration of the samples
[2.3 Marks]
Table 3.5. Graphical and analytical determination of sucrose concentration in analyzed samples Unknown
Samples
Sucrose concentration graphically obtained
[g/100 ml]
Sucrose concentration analytically obtained
[g/100 ml]
Concentration Difference [%]
ID # X ID # XI
ID # XII
C.2.2.
Analytical determination
Resolution ID# XAnswer
Resolution ID# XII
Resolution ID# X
Answer
Resolution ID# XI
Resolution ID# XII
Answer
D: Additional calculations and data analysis of samples XI and XII
D.1:
Sucrose concentration in original honey sample
[0.3 Marks]
Table 3.6.
Unknown Samples Sucrose original
concentration in honey [°Brix]
Resolution
Answer
D.2. Safe preservation of honey
Table 3.7.
[0.2 Marks]
SAFE NOT SAFE
Resolution
Answer
Table 3.8.: Theoretical deviation of the laser beam [mm] for a solution 8.5g/100 ml sucrose concentration
Calculation Theoretical deviation of the laser beam [mm]
Resolution
Answer
Table 3.9.: Analysed beverage specification according to the statement on the package label
![Table 1.1: Recording fermentation data [8.5 Marks=7.0 (Record data) + 1.5 (Flow calculation)]](https://thumb-ap.123doks.com/thumbv2/123dok/1589504.1074185/3.612.37.510.270.768/table-recording-fermentation-data-marks-record-flow-calculation.webp)
![Table 2.1.[0.5 Marks]](https://thumb-ap.123doks.com/thumbv2/123dok/1589504.1074185/9.612.36.491.257.737/table-marks.webp)
![Table 3.4: Data of analyzed samples [2.1 Marks]](https://thumb-ap.123doks.com/thumbv2/123dok/1589504.1074185/25.612.23.575.35.624/table-data-analyzed-samples-marks.webp)
![Table 3.8.: Theoretical deviation of the laser beam [mm] for a solution](https://thumb-ap.123doks.com/thumbv2/123dok/1589504.1074185/31.612.107.464.503.568/table-theoretical-deviation-laser-beam-mm-solution.webp)
