METHODS
Sustainability assessment of development scenarios:
methodology and application to Thailand
Peter Nijkamp, Ron Vreeker *
Department of Spatial Economics,Free Uni6ersity,De Boelelaan1105,1081HV Amsterdam,Netherlands
Received 22 February 1999; received in revised form 4 August 1999; accepted 6 October 1999
Abstract
This paper aims to offer an applicable evaluation framework for assessing sustainable development strategies at the regional level, with a particular view on the treatment of uncertain information. After a survey of various regional sustainable development studies, several methodological issues pertaining to regional sustainability are presented and discussed, which lay the foundation for the central approach in this paper, viz. the use of critical threshold values. Based on a multidimensional indicator system, a systematic multicriteria model is proposed by employing the recently developed and user-friendly flag model. This model is able to take into consideration various relevant classes of (non) compliance with critical threshold values. By means of this model an empirical case study is undertaken for the Songkhla/Hat Yai area in southern Thailand. Three policy scenario’s (decentralization, sectoral and regional promotion and environmental protection) are systematically evaluated using a blend of the above-mentioned critical threshold value and the flag approach. It is concluded that in general the decentralization policy is slightly more preferable than the sectoral and regional development scenario and significantly more preferable than the environ-mental protection scenario for the region concerned. The analytical tools used (a qualitative systems approach, the use of critical threshold values and the flag model) appeared to yield a satisfactory contribution to sustainability assessment, even in case of qualitative information. © 2000 Elsevier Science B.V. All rights reserved.
Keywords:Decentralised policy; Regional development; Environmental protection
www.elsevier.com/locate/ecolecon
1. The regional dimension of sustainability
The sustainability debate is already more than a decade old. It has generated a wealth of research and policy discussion on the meaning, measurabil-ity and feasibilmeasurabil-ity of sustainable development (Van Pelt, 1993). Despite some intrinsic ambiguity
* Corresponding author. Tel.: +20-444-6088; fax: + 20-444-6004.
E-mail address:[email protected] (R. Vreeker)
in the concept of sustainability, it has prompted policy-makers to formulate new strategies for achieving a balanced economic and technological pathway that would safeguard our precious envi-ronment, not only here and now, but also else-where and in the future.
For economists, the notion of sustainable devel-opment has meant a new major challenge, as they were forced to broaden existing analytical frame-works towards the domain of ecological systems or even international negotiation tables (van den Bergh, 1996). Up until now, many economic stud-ies were rather abstract and theoretical in nature (seeking for optimal trajectories or game theoretic equilibria), but an increasing number of studies can be found which offer interesting applied work.
At the same time we observe also a rising interest in research which moves away from global sustainability analysis towards empirical policy-relevant research at the regional and urban level (Giaoutzi and Nijkamp, 1994; Capello et al., 1999). This new interest in regional sustainability analysis is caused by several factors: a region is a properly demarcated area with some degree of homogeneity which allows for a more operational empirical investigation; a region is usually also subject to properly regulated administrative com-petence and control, so that there is more scope for a relevant policy analysis of sustainability issues; and finally, the statistical data base at a regional level is often more appropriate for moni-toring, analyzing and modeling the economy and ecology of an area (Nijkamp, 1999).
A wide range of recent studies can be found which address explicitly the regional aspects of sustainability issues. Some illustrative examples are: a sustainability analysis of communal range-lands by Abel (1997), regional resource investiga-tion by van den Bergh (1996), sustainability analysis of agricultural pesticide policies by Dou-ven (1996), value function approach on regional solid waste management by Beinat (1997), study on soil degradation and economic development in Ghana by Knut et al. (1997), an economic analy-sis of deforestation in Mexico by Barbier and Burgess (1996), study on wildlife management, land use and policy conflicts by Schulz and
Skon-foft (1996), study on environmental economics in poor countries by Dasgupta and Ma¨ler (1996), case study on natural resource degradation effects of poverty and population growth by Heath and Binswanger (1996), study on the operational defi-nition and measurement of sustainability by
Mu-nasinghe and Shearer (1996), analysis of
sustainable land use by Finco and Nijkamp (1997), dynamic input-output analysis of sustain-able logging in Indonesia (Hamilton, 1997), a case study on a sustainable fishery by Charles (1997), study on the development of an ecological eco-nomic simulation model of mountain fynbos ecosystems (Higgins et al., 1997), and a study on sustainable agricultural development options for Greek islands by Nijkamp and Ouwersloot (1998). It should be noted that the openness of a regional system may create a complication, as externalities may be imported or exported via trade or dispersion of pollution. Consequently, some authors make a distinction between internal and external sustainability, where external sus-tainability takes also into consideration the spillover effects to and from other areas (cf. the notion of the ecological footprint; (Wackernagel and Rees, 1996). Clearly, seen from this perspec-tive, sustainability is context-specific and may hence be co-determined by needs and opportuni-ties in a given region as part of a broader spatial system.
The above concise overview is by no means representative nor exhaustive, but highlights sev-eral important research issues. There appears to be an increasing empirical and policy orientation in regional sustainability analysis. Next, the range of subjects is vast, although there is some clear bias towards agricultural and land use studies. It is also noteworthy that the theoretical frameworks and the methodological foundations do not ex-hibit a high degree of commonality. Apparently, the research undertaken at the regional level is largely driven by case study orientation, without the explicit goal of developing a more widely applicable analytical framework for assessing re-gional sustainable development.
studies on spatial sustainability. The paper is or-ganized as follows. In Section 2 some specific methodological reflections on sustainability analy-sis will be offered, followed by the presentation of an operational framework for assessing sustain-able development at the regional level by means of a so-called critical threshold value approach, which is put in the context of a decision support method by using the recently developed flag model. The remaining part of the paper is devoted
to a case study on the Songkhla/Hat Yai area in
Southern Thailand. After a concise description of the natural and regional economic development problems in this area (Section 3), the analysis proceeds with the presentation of an empirical impact assessment approach for the area, sustain-able development by the design of various devel-opment scenarios (Section 4). The application of the flag model and its empirical findings are pre-sented in Section 5. The paper is concluded with a final evaluative section.
2. A decision support method for regional sustainability assessment
Sustainable development can be defined in nu-merous ways (Pezzey, 1989). In this paper we will adopt the simple view that sustainability means that the development of an economy (national, regional) has to take place within a set of
pre-spe-cified normative constraints or pathways. Accord-ing to Van Pelt et al. (1992, 1995) a sustainability constraint has at least four attributes: (i), it is expressed in one or more measurable parameters; (ii), these parameters are linked to sustainability targets; (iii), the parameters have a proper geo-graphical scale; (iv), these parameters have also a relevant time dimension. Ideally, such constraints should be mapped out in quantitative factors, but in reality we are often confronted with qualitative, fuzzy and incomplete information. In general, there may be various ways to identify such con-straints (e.g. safe minimum standards, quality standards, carrying capacity, ecocapacity, maxi-mum sustainable yield, critical loads, vulnerability (or fragility), environmental utilization space, etc.). All such concepts may be useful for a policy analysis. We will in our approach encapsulate them under the general heading of critical
threshold values (Nijkamp and Ouwersloot,
1998). These values will form an important ingre-dient in a decision support model.
In the regional sustainability assessment pre-sented here, we will distinguish the following steps in a decision support approach (Fig. 1).
Clearly, various feedback mechanisms and/or
iterative steps may also be envisaged and included in this stepwise approach. It goes without saying that the above simplified and schematic general framework for a regional sustainability assess-ment study is fraught with various difficulties of
both a theoretical/methodological and empirical/
policy nature (Bithas et al., 1997). Case study research is then necessary to test the framework on its scientific merits and policy relevance. To obtain a proper level of information for a sustain-ability test in the various steps of a policy process is, of course, a major challenge.
The evaluation of options or alternative choice possibilities for sustainable development will be undertaken in this paper by using normative refer-ence values in the form of critical threshold
val-ues. We will in particular adhere to the
description of RMNO (1994) that ‘sustainable development implies that the environment impact of human activities stay well within limits of how much environmental impact the biosphere can take’. The specification of such limits provides a testable framework for policy decisions.
In this context the notion of ‘environmental utilisation space’ offers an interesting and useful orientation, as it refers to the amount of environ-mental pressure or the source exhaustion a life support system can bear on both economic and ecological grounds. The environmental utilization space takes for granted that the environment has some regenerative capacity so that also a distinc-tion between renewable and non-renewable re-sources can be made
Clearly, one needs to define and specify mean-ingful and measurable indicators for sustainable development. There are no unambiguous sustain-ability indicators; they are always context and site-specific. Taking for granted the existence of a set of such indicators, a critical threshold value (CTV) for sustainable development is then defined as the numerical normative value of a sustainabil-ity indicator that (at the margin) ensures a com-pliance with the carrying capacity of the regional environmental system concerned. Exceeding a CTV means unacceptably high social costs to the environment or socioeconomic system concerned. Clearly, such a CTV may originate from the above-mentioned concept of environmental uti-lization space, critical loads, carrying capacity, sustainable yield, etc. (Weterings and Opschoor, 1994). It should be added that the introduction of such normative values is not entirely new in envi-ronmental management. Since the path-breaking
contribution of Von Ciriacy-Wantrup (1952) on resource conservation, there has been an ongoing flow of scientific contributions on the use of such normative standards. What is novel here is that the CTV approach is cast in the framework of a decision support approach.
It is, of course, an interesting question how a CTV can be assessed. Clearly, it has to be based on solid scientific research concerning, e.g. re-source availability or human health effects. This means that scientific information and expert opin-ion are of critical importance. In additopin-ion how-ever, it ought to be recognised that several CTVs have by definition a policy meaning, (e.g. on the acceptable level of access to resources), so that there is, of course, a policy involvement in the specification and numerical assessment of CTVs. Thus, the concept of CTVs must be used with great caution. It is based on existing knowledge which may be specific for a given area, for local socio-economic and natural conditions, and for
particular local/regional policy ramifications.
Fur-thermore, some changes in natural conditions may exhibit a resilience, so that after a temporary time span of violating critical threshold conditions a return to a sustainable development or an envi-ronmental security pathway may take place.
Clearly, for each sustainability or security indi-cator — be it environmental or socio-economic — a separate CTV has to be determined, so that the entire set of CTVs may act as a reference system for judging actual states or future out-comes of scenario experiments. If, for example, an indicator holds ‘a lower value is better’, then its corresponding value means that a level above the CTV signifies a dangerous or threatening develop-ment which is in a strict sense unacceptable. Clearly, a value of a sustainability or security indicator that is lower than the CTV is in princi-ple acceptable or desirable. The reverse reasoning applies to benefit indicators. We will use here in our interpretative analysis — for the sake of sim-plicity — only cost indicators, as benefit
indica-tors can easily be transformed into cost
indicators.
circumstances, different experts and decision-makers may have different views on the precise level of a CTV. It may even happen that a CTV is fuzzy in nature, so that then fuzzy assessment methods have to be used (Munda, 1995). A rela-tively simple and manageable approach to the above uncertainty problem is to introduce a band width for the corresponding value of the CTV,
defined as CTVminand CTVmax, respectively. This
band width mirrors the minimum and maximum range of CTV values expressed by experts or
policy-makers. CTVmin indicates a conservative
estimate of the maximum allowable threshold of the corresponding sustainability or security
indi-cator (min – max condition). CTVmax on the other
hand refers to the maximum allowable value of the sustainability or security indicator beyond which an alarming development will certainly start (max – max condition). This can be repre-sented as follows, assuming that the original CTV has an index value of 100:
The line segments can now be interpreted in the following imaginative way:
1. Area A: ‘green’ flag; no reason for specific concern.
2. Area B: ‘yellow’ flag; be alert. 3. Area C: ‘red’ flag; reverse trends.
4. Area D: ‘black’ flag; stop immediately further growth.
It should be noted that deviations from the
average can also be denoted by + +,+, + / −,
−, − −, as will be illustrated later on.
This flag model is a visually appealing way to confront decision-makers with the environmental state of affairs in a certain area. It can also be represented in a computerised way by colour graphs (Hermanides and Nijkamp, 1998). In this way, the basic information for making trade-offs
between conflicting objectives in a sustainability assessment is available in a systematic data base. The evaluation of various policy options for sustainable development, based on the flag model, can utilize a recently developed software pro-gramme (Nijkamp and Ouwersloot, 1998). This programme analyses the degree to which a choice possibility can optimise multiple objectives like socioeconomic progress or environmental quality. It is evident that for each sustainability indicator related to a given policy objective, a CTV has to be specified (Hermanides and Nijkamp, 1998).
Once the data base and the set of CTVs have been collected, one may use policy experiments (scenarios, visioning methods, forecasting tech-niques, delphi-types of communicative procedures) to generate a series of ‘alternative futures’ which then may be judged on the basis of a multi-dimen-sional set of relevant policy criteria, while taking into account the importance and existence of CTVs in identifying policy decisions. In this context, also
multicriteria analysis may be an important analyt-ical tool. This will be further discussed in our paper on the basis of a case study for Thailand.
3. A case study on Songkhla/Hat Yai (Thailand)
Thailand consists of a compact heartland, or mainland, and a long southern peninsular exten-sion of the Malay Peninsula. It has a maximum north-south length of about 1700 km and a maxi-mum east-west width of about 800 km. Forests
occupy :28% of the land area, while farmland
covers :39%. Four topographical regions are
low-lands of the Chao Phraya river, Thailand’s ‘rice bowl’. This central region is the historical core of Thailand, and all but one of the former capitals have been located on the banks of the Chao Phraya. Thailand’s three other distinct topograph-ical areas are the northern region (a mountainous and forested area), the northeastern, or Khorat Plateau, region (an area poorly endowed with resources with unproductive lateritic soils) and the southern, or peninsular, region on the Malay Peninsula (rich in rubber and tin). Our case study
on Songkhla/Hat Yai concerns the latter area.
Songkhla is a city located in the south of Thai-land (950 km distance from Bangkok) close to Malaysia. The city is situated on a long and narrow peninsula stretching 9.3 km between the Gulf of Thailand on the east and the Songkhla Lake, a fresh water lagoon, on the west. Songkhla has an urban population of 86 000 people within its municipal boundary. Together with Hat Yai, a
city of :140 000 inhabitants at 25 km distance to
the south, Songkhla serves as the regional center for the south of Thailand. Songkhla is the capital city of the Songkhla province and it is the admin-istrative, educational and cultural center of the region. Hat Yai is the commercial part of both
cities. The major commercial activities in
Songkhla are related to fisheries. The city pos-sesses a big deep sea port for fishing ships. Tourism is another source of income and is likely to become more important in the near future. Together with Hat Yai, Songkhla is the third most important destination for foreign tourists in
Thailand. The other economic activities in
Songkhla are related to government services and activities in the private sector.
Since Hat Yai is also a part of the defined research area, we will give a short description of this influential city. Hat Yai is southern Thailands commercial center and one of the kingdom’s largest cities, though it is only a district of Songkhla province. A steady stream of customers from Malaysia keeps Hat Yai’s central business district booming. Hat Yai is very much a Chinese town in its center, although also a substantial muslim minority is concentrated in certain sec-tions of the city. Since the city shares several common features with Bangkok, Hat Yai is often called ‘little Bangkok’.
We will give here a concise overview of the main economic activities in this area. In terms of agriculture, the region possesses the country’s largest rubber plantation fields. About 44% of the households in the region are engaged in pare-rub-ber plantation. Next, fishing is an important activ-ity; it is mainly related to the black tiger shrimp culture. Shrimp culture in Songkhla has a high development potential caused by the large suitable area around the coast lines and the technological developments made in the past five years. Fur-thermore, there are great opportunities for the production of fruits such as oranges, coconuts, limes, flowers and decorative plants, and vegeta-bles for export, while certain areas within the region are endowed with water and soil resources, and are thereby suitable for orchards.
Traditionally, the industry in Songkhla
province consisted mainly of agro-industries, or industries and services related to this sector. Rely-ing on indigenous resources includRely-ing pare-rubber and fishing, they are mostly labour-intensive. Most industries are located in or near areas equipped with good basic infrastructure like the city of Songkhla and the city of Hat Yai. Most industries profited from the governmental policy to redistribute growth and welfare to the regions. Many investors were encouraged to invest in Songkhla. Industries like pare-wood furniture and frozen sea foods expanded, and the international position of some industries improved, influenced by these investments.
Songkhla has diverse tourist attractions. They include natural attractions, historical sites, enter-tainment areas, and various shopping centers. The favourable connections (e.g. the airport) and com-munication networks with various cities in the neighbouring countries have contributed to the growth of the number of tourists who see Songkhla as a temporary destination. About 60% of the tourists are Thai, the remaining ones are foreigners, mainly from Asian countries like Malaysia and Singapore. Increasingly more Eu-ropeans and Australians come to visit the province on their way to Malaysia or Indonesia.
In general, the Thai governmental policy can be summarized under six themes: decentralization policies, policies related to agriculture, industrial policies, policies related to tourism, Indonesia – Malaysia – Thailand trade-triangle policies (IMT-triangle) and environmental policies.
For Songkhla and Hat Yai it is important to take into account the development guidelines set for the southern region. The main development guidelines are related to conservation and rehabil-itation of natural resources, and the promotion of tourism (Phuket, Samui-Pha Ngan and Ang Thong Islands), investments in infrastructure (communications and transport) and the promo-tion of coastal cities and border provinces to form a gateway in order to stimulate trade with neigh-bouring countries. Industrial estate development will be promoted to serve industrial requirements, particularly agro-industries such as rubber, palm oil and sea food. Several regional urban centers in southern Thailand are supported in order to re-distribute development efforts to the region. We will in Section 4 describe in more detail various sustainability options for the region
4. Design of development scenarios for the Songkhla/Hat Yai region
Key issues in applying the concept of sustain-ability to Thai areas are the organization of pro-duction and consumption (the socio-economic system), the quantity and quality of environmen-tal functions, and the interaction between the socio-economic and environmental system in the
short and in the long term. An application of the sustainability concept will, of course, lead to dif-ferent analytical problems and outcomes depend-ing on location-specific circumstances. This holds especially for the application of the sustainability concept in developing countries. In general, devel-oping countries have other environmental systems than most developed countries. Climatic circum-stances and geographic conditions have a distinct impact on the features of ecosystems. Many devel-oping countries possess highly diversified but fragile ecosystems. Moreover, developing coun-tries are still predominantly rural, whereas the developed world is largely urbanized. Socio-eco-nomic systems in developing countries also differ from those in developed countries. These loca-tion-specific circumstances should be taken into account in the operationalization of the sustain-ability concept and the assessment of
sustainabil-ity in the Songkhla/Hat Yai area.
In this section of the paper, the policy aspects, which are of critical importance for the
assess-ment of sustainable developassess-ment in the Songkhla/
Hat Yai area, will be presented. The three scenarios used in the sustainability assessment will also be described in this section. These scenarios are based on the six policies described in Section 3, which consisted of decentralization, industrial, agricultural, tourism, IMT-triangle and environ-mental policies. A framework will be designed and presented here, through which the various development scenarios will be judged on their sustainability impacts.
Table 1
Decentralization scenario
Objectives Measures
Redistribution of income and development benefits to the regions Implementation of monetary, fiscal and capital market development policies
and rural areas in order to reduce income disparities
Implementation of fiscal and public expenditure policies Decentralization of fiscal and budgetary power to the
provinces and local authorities
Dispersion of property ownership to enable those involved in Land reform programs, issuance of land titles, housing agriculture to have legal ownership of land or security in credit provision for low-income groups
farmland
Enable people to have their own dwellings, or to have security in Promulgation of the Slum Improvement Act rental agreements
Development of regional centers, to be accomplished by Development of regional centers to serve as an economic and
creating basic infrastructural networks in and around employment base in a region, in order to take advantage of the
decentralization of economic activities these regional centers
The dispersion of growth to towns surrounding these centers by linking those towns to the basic infrastructure networks in and around the regional centers
Upgrading the quality of life of rural people; Decentralization of authority, procedures and budgets
Policies to emphasize income increase, upgrading of Upgrading the quality of life of the urban poor
housing, provision of welfare and basic social services
The provision of infrastructural services in order to meet the Infrastructural investments in regions (communication services and transportation)
demand for infrastructural services
Development of infrastructural networks in regional cities Construction of ring roads and bypasses, and
improvements in the efficiency of urban and inner-city systems.
A key question now is whether and how the impacts of the above-mentioned policy scenarios can be assessed in order to subject them to a sustainability test by means of the flag model. For that purpose, our analysis treats the socio-eco-nomic and environmental subsystems in the
Songkhla/Hat Yai area as a complex system. Due
to lack of (time series or cross-section) data the quantitative relationships within this complex sys-tem can unfortunately not be presented by a formal, empirically estimated econometric model. Such problems concerning the availability of data are typical of many research projects executed in developing countries and present a major research challenge.
In our research the complex system of the
Songkhla/Hat Yai area is presented by means of a
qualitative systems model using graphs or arrows
Table 2
Promotion of sectoral and regional development scenario
Measures Objectives
Industries and ser6ices(including tourism)
Restructuring regional economies into more industrial and Dispersion of industries and services to regions by strengthening regions with a strong potential to serve as service-based economies, instead of agrocultural base
regional centers in the development of industries economies
Industrial development in the new economic zones such as the southern seaboard
Acceleration of industrial decentralization to regional urban centers
Investments in industrial real estate to meet industrial requirements and demand
Promotion of agro-industry within the area (rubber, palm oil Support of agro-industries by setting up agricultural and sea food processing) production zones to provide raw materials for the
agro-industry
Dispersion of social infrastructural services to the region, The Songkhla/Hat Yai area should serve as one of the nine
industrial centers in Thailand; the southern seaboard should especially educational services serve as a long-term economic base within Thailand
Industrial sites should be set up in the region Investments in labour training
Supporting local entrepreneurs to enhance their managerial efficiency and their use of technology
Industrial credit will be granted on a wider basis
Establishment of small and medium-size industrial zones in inland areas which have a high industrial potential
A more competitive internal market environment Reducing protection of domestic industries
Supporting oil-refining, petrochemical/petroleum industries Influx of more high-tech industries in the area
and related industries, by investments in infrastructure
Encouragement of the private sector to invest in new Songkhla/Hat Yai should be the center of tourism in the lower
tourism activities south
Environmental conservation Investments in infrastructure
Investments in training and quality of personnel
Agriculture
Agricultural restructuring Rise in agricultural incomes
Improvements in cultivation systems and farming methods Increase in agricultural productivity
Protection of agricultural workers to ensure their income Formulation of land use policies to bring agricultural activities in line with the potential of the land Policies should encourage the private sector to invest in Maintenance of stable commodity prices
research and development activities
Investment in basic services to support the transition in the Agriculture and agro-industries should play a more important
production structure of Thai farmers role in gross domestic product
Agricultural land use patterns should be more diversified Establishment of agricultural markets in regional urban centers
IMT-triangle
Investments in infastructural networks (communication and Southern Thailand (Songkhla/Hat Yai) should function as a
gateway for trade with neighboring countries transportation networks)
Investments in road networks, Songkhla seaport and Hat Songkhla/Hat Yai will be the center of trade and services in the
Yai airport to strengthen the position of the twin cities in lower south of Thailand
southeast Asia
The southern seaboard will be developed as an ‘economic Linking Songkhla and Hat Yai with other border trade points, by investments in infrastructure
Table 3
Environmental protection scenario
Objectives Measures
Conservation and rehabilitation of natural resources Establishment of environmental administrations Preservation of historical sites
Together with the development of infrastructure within the region, Increase of managerial efficiency to reduce losses in resources (water and electricity transmissions) there will be also a careful environmental monitoring
Relieve congestion in rapidly expanding urban areas Improvements in town planning
Investments in public transport systems to solve congestion problems in urban business districts
Investments in waste water treatment systems More control over areas facing critical environmental problems
(local authorities)
Local authorities will be encouraged to improve their land use planning and accelerate the formulation of plans to preserve historical sites and recreational areas Specific zones will be demarcated for pollution generation
industries in order to facilitate more control over pollution, as well as to economize on the costs of pollution control
Internalization of environmental costs in commodity Enforcement of the polluter-pays principle
prices
an overall response of the given indicator. If first-order intermediate impacts are taking place, directly-related second-order intermediate elements may change as well. These impacts can then be assessed in the second step. In the third step, the resulting changes in other elements are assessed, and so on. This procedure can be repeated for higher order impacts until they become small or the information content becomes very unreliable. A detailed description of this approach applied to India can be found in Nijkamp and Van Pelt (1987). A complete presentation of the various subsystems used for our Thai case study will be given in Section 5, where also the sustainability indicators per subsystem will be defined.
The above approach leads directly to a numerical (or at least a qualitative) assessment of the impact matrix where, the outcomes of all indicator scores (criteria) for all scenarios are mapped out. Because the impact matrix is an input variable in our flag model, it is an important part of the sustainability analysis. This impact matrix is thus the result of a systematic assessment analysis, in which the conse-quences of the different scenarios are presented. Thus, in this impact assessment the complex system alluded to above must be analyzed step by step in
order to trace the effects that the different scenarios will likely have on the system at hand.
An additional empirical problem appeared to arise in our case when the above-mentioned methodology was applied to obtain CTVs for the
Songkhla/Hat Yai area. Due to the lack of reliable
quantitative and expert information, it was not possible to specify with sufficient precision the entire socio-economic and environmental system nor the conditions and relationships between the various subsystems. As a consequence, an
unam-biguous estimate of CTVmin and CTVmaxwas not
possible. To overcome this problem, the CTVs used in our assessment were obtained by constructing three auxiliary visions for approximating these values. This will also be discussed in Section 5.
5. Sustainability assessment of the study area
In this part of the paper the development scenar-ios mapped out in Section 4 will be assessed in terms of their sustainability consequences. In order to
evaluate these scenarios, sustainability
in-dicators and the effect these scenarios have on these indicators, need to be measured. Therefore, the
com-plex regional system. For this comcom-plex system sustainability indicators are next identified, while next the consequences of these development sce-narios for these sustainability indicators are traced by means of this complex system. The result of this assessment is thus based on a quali-tative impact matrix. We will follow here the successive steps described in Fig. 1.
5.1. Step 0:design of complex regional system for the Songkhla/Hat Yai area
In the first part of our analysis the economic, social and environmental subsystems within the
Songkhla/Hat Yai area are seen and represented
as a multi-faceted, interlinked system. As
men-tioned already, due to lack of quantitative
infor-mation the complex system of the Songkhla/Hat
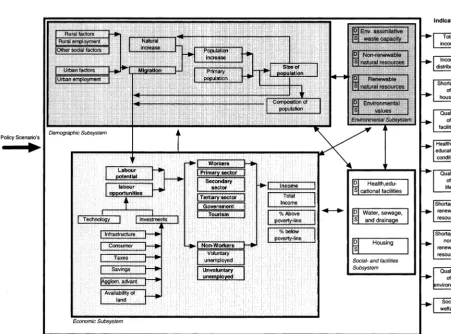
Yai area will be mapped out in a graphical way by means of graphs and arrows. The design of this system is made in a modular fashion. This means that the main components of the regional system (economic, social, demographic and envi-ronmental) make up the architecture of the sys-tem, while next in a systematically nested way the various interlinked sub-components are depicted.
The design of this system for the Songkhla/Hat
Yai region is based on extensive field work in close consultation and cooperation with several regional and local experts. The presentation of this complex system can be found in Fig. 2. By following a stimulus-response approach it is in
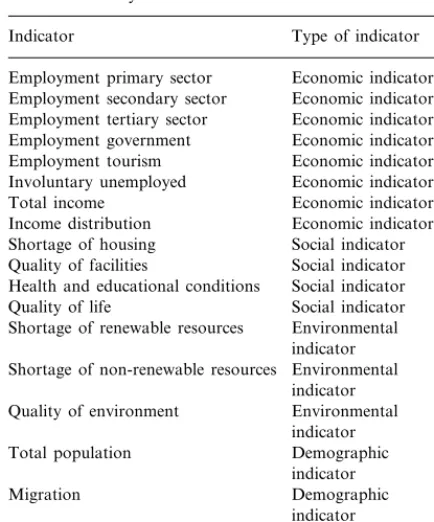
Table 4
The sustainability indicators used
Indicator Type of indicator
Employment primary sector Economic indicator Employment secondary sector Economic indicator Economic indicator Employment tertiary sector
Economic indicator Employment government
Employment tourism Economic indicator Economic indicator Involuntary unemployed
Economic indicator Total income
Income distribution Economic indicator Social indicator Shortage of housing
Quality of facilities Social indicator Social indicator Health and educational conditions
Quality of life Social indicator Shortage of renewable resources Environmental
indicator Environmental Shortage of non-renewable resources
indicator
Social welfare Aggregated indicator
In our empirical research the expected value of the indicators is assessed on the basis of the likely influence a scenario exerts on these indicators. In a purely qualitative sense, two binary possibilities concerning the variables can be used in our
ap-proach: a minus sign (−1) is used when an
increase in the value of the indicator has a
nega-tive effect on social welfare; a plus sign (+1) is
used when an increase in the value of the indica-tor influences social welfare positively. As men-tioned above, the final judgement concerning the impact of scenarios on regional sustainability is made with the help of the CTVs, in particular in terms of the frequency of occurrence of green, yellow, red and black flags (Table 4).
5.3. Step 2:estimation of regional impact matrix
After the presentation of the complex regional system and the selection of sustainability indica-tors, it is now possible to estimate empirically the implications of various policy scenarios. In mea-suring the effects a policy scenario has on the sustainability indicators, the impact matrix plays a crucial role. This can be pursued by tracing the consequences of a policy measure, step by step through the whole of the complex system de-signed. As mentioned above, a distinction will be made between first, second, third and higher order effects. These influences determine the total effect a scenario has on the indicator concerned. All effects are standardized, and each possible effect
can be described by qualitative symbols (+ +,
+, + / −, −or − −). Several of these qualita-tive expressions have an underlying quantitaqualita-tive value, but for the sake of uniformity we will present all effect values in qualitative terms (see for a concise presentation the left-hand part of the matrix in Table 5).
These empirically-based values will be deployed in the final assessment with the help of the flag model. By means of this computer model the values will be compared to a set of a priori formulated CTVs (see below). Clearly, each sce-nario A, B and C has different effects. A short description of the effects of each separate scenario on the indicators will follow, where the assess-ment is largely based on expert opinion in the area under study.
principle possible to estimate the implications of distinct policy scenarios for various relevant sus-tainability indicators.
5.2. Step 1:identification of measurable sustainability indicators
By means of systematic field work in the
Songkhla/Hat Yai area, a rather extensive data
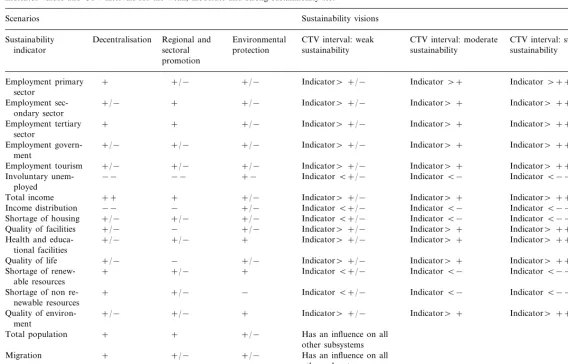
P
Indicator values and CTV intervals for the weak, moderate and strong sustainability test
Sustainability visions Scenarios
CTV interval: weak CTV interval: moderate
Regional and CTV interval: strong
Decentralisation Environmental Sustainability
sectoral sustainability
indicator protection sustainability sustainability
promotion
Indicator\+ Indicator\++
+/− +/−
+ Indicator\+/−
Employment primary sector
Indicator\+ Indicator\++
Employment sec- +/− + +/− Indicator\+/−
ondary sector
Indicator\+ Indicator\++
+/−
+ Indicator\+/−
+ Employment tertiary
sector
Indicator\+ Indicator\++
Employment govern- +/− +/− +/− Indicator\+/−
ment
+− IndicatorB+/− IndicatorB− IndicatorB−−
Involuntary unem- −− −−
ployed
Income distribution IndicatorB+/−
IndicatorB−−
+/− +/− IndicatorB+/− IndicatorB−
Shortage of housing +/−
+/− − +/−
Quality of facilities Indicator\+/− Indicator\+ Indicator\++
Health and educa- +/− +/− + Indicator\+/− Indicator\+ Indicator\++
tional facilities
Indicator\+/− Indicator\+ Indicator\++
+/−
Quality of life − +/−
IndicatorB− IndicatorB−−
IndicatorB+/−
+
Shortage of renew- + +/−
able resources
IndicatorB−
Shortage of non re- + +/− − IndicatorB+/− IndicatorB−−
newable resources
Indicator\+ Indicator\++
+
+/− Indicator\+/−
+/− Quality of
environ-ment
Total population + + +/− Has an influence on all
5.3.1. Decentralization scenario
The decentralization scenario has a slight to substantial positive influence on employment, to-tal income and income distribution. Slightly posi-tive effects on the social indicators may also be distinguished. These effects were to be expected because this scenario was developed to redis-tribute welfare from Bangkok to the regional centers and the surrounding areas. In this respect the scenario seems successful. But it also has a shadow-side, as it is accompanied by undesirable environmental effects, which take up an extra amount of renewable and exhaustible resources. The assimilative capacity of the environment is also negatively affected. These combined effects may nevertheless slightly improve regional wel-fare. The extent to which this scenario meets the pre-defined CTVs, and hence to which extent it meets the conditions for sustainability, is dis-cussed in Section 6.
5.3.2. Promotion of sectoral and regional de6elopment scenario
This scenario has also a positive influence on employment, total income and the income distri-bution. The effects on total income are less
sub-stantial, probably because of the measures
concerning the treaty on the IMT-growth triangle. These initiatives will mainly have positive effects in the long term; in the first instance they will be focused on the primary sector, which was already under some pressure in Thailand. The effects on the social indicators are approximately the same as the effects on the social indicators in the former
scenario. Decentralization, however, has a
broader effect on the supply of housing. This seems a logical consequence since this scenario focuses on the decentralization of income and prosperity. On the other hand, the promotion of sectoral development has a less negative effect on the environment. This is mainly caused by mea-sures which are focused on the restructuring of the agricultural sector and which emphasize im-provements in cultivation systems and farming methods, the formulation of land use policies in order to bring agricultural activities in line with the potential of the land, and the higher accessi-bility to water resources. Measures which concern
the promotion of tourism also have a positive influence on the environment, especially with re-gard to natural environment conservation. The total effect on social welfare is likely not very different from the effect the decentralization sce-nario has on this indicator.
5.3.3. En6ironmental protection scenario
The final scenario seeks to ensure an improve-ment of environimprove-mental quality in the area. With regard to this scenario it is plausible that it will have a positive effect on all environmental indica-tors, and this is indeed shown in the impact matrix. This scenario however, has only a very slightly positive influence on employment and the income distribution. An improvement in environ-mental protection results clearly in the
improve-ment of the quality of life in the Songkhla/Hat
Yai area.
5.4. Step 3:specification of CTVs for sustainability
The extent to which the sustainability condi-tions for the area concerned are stringent depends on a priori unknown value judgements. Compen-sation measures may also be incorporated in or-der to cope with conflicts between priori specified social welfare objectives.
It is clear that the establishment of CTVs is not immediately straightforward. In our case, there was not direct and sufficient export knowledge available. Therefore, as part of the policy strategy assessment we decided to introduce three virtual visions which may function as three options for establishing a CTV, which might generate a
varia-tion around an average value in terms of CTVmin
and CTVmax. Thus, three auxiliary visions on
CTVs are constructed to overcome these empirical problems in specifying a set of normative
refer-ence values for the Songkhla/Hat Yai area.
In the impact matrix, the effects on the sustain-ability indicators are represented by standardized qualitative values originating from the impact ma-trix; these values can also be used to develop different CTVs for each sustainability indicator. Within the ‘weak progress’ vision, CTVs are set less stringently than in other visions on CTVs. Sustainability in this vision is defined as ‘non-neg-ative’ impacts on the sustainability indicators, and sustainability is thus achieved when the effects of
a development scenario has at least a + / − sign,
(i.e. no further environmental decay). So, this vision contains the minimum CTVs for the sus-tainability indicators.
Within the other two visions (moderate and strong progress) the CTVs appeared to become more stringent; this is useful to identify the most sustainable development scenario. If, for example, scenario A is sustainable within the ‘strong pro-gress vision’, and if the other two scenario’s (B and C) meet only the requirements for sustainabil-ity within the ‘weak progress vision’, one can conclude that scenario A is the most sustainable one.
For each sustainability indicator the relevant CTV is represented here in a qualitative sense, although in most cases quantitative information does exist (Vreeker, 1997). Therefore, the CTVs in our assessment procedure have been set as the following values as shown in Table 6.
In Section 6 the results of the sustainability assessment will be given, while also the results of the comparison of the effects with the visions on CTVs will be analyzed for all sustainability indi-cators (for a brief representation of the values of the 11 sustainability indicators and their corre-sponding CTVs we refer to Table 5).
5.5. Step 4:e6aluation of sustainability strategies
or scenarios
In the sustainability assessment, by means of the flag model, the outcomes of sustainability indicators are compared to the CTVs. After the comparison of a sustainability indicator with its CTV, a coloured flag is assigned to (the value of) this indicator (see Section 2). The set of sustain-ability indicators is evaluated in a separate model of the flag computer programme. Due to lack of quantitative information a qualitative approach is necessarily used here. The qualitative approach only takes into account the colour of the flags (see Section 2). Only flag counts and cross-tabulation
(when two scenarios are compared) are
allowed. The outcomes can also be visualized by means of pie charts and stack bars. The results of the comparisons will now be presented in Section 6.
6. Interpretation of the results of the Thai case study
We will now concisely interpret the results of the above-mentioned three auxiliary visions for assessing tentative values for the CTVs, viz.
the weak, moderate and strong progress
vision, respectively. Here we will present in Tables 7 – 18 the results of the flag model in terms of the frequency of flags for each of the three scenarios and for the three distinct visions on CTVs.
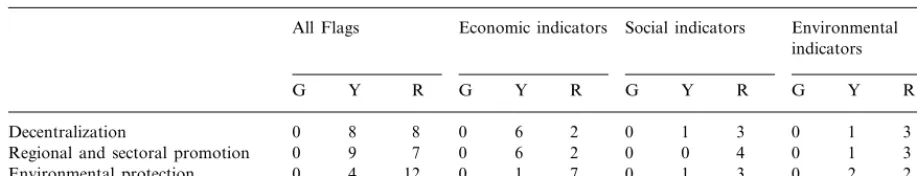
6.1. Weak progress 6ision
It seems plausible that the environmental pro-tection scenario is the most sustainable, based on CTVs in the weak progress vision. The influence the environmental protection scenario has on the economic indicators is limited; it is, in fact, sur-prising that eight yellow flags are counted for these indicators. Thus, the environmental protec-tion scenario is not in all cases very convincing. Clearly, the environmental protection scenario
Table 6
The CTVs in our assessment procedure
Table 7
Frequencies of flags for weak progress visiona
Economic indicators Social indicators
All flags Environmental
Regional and sectoral promotion 0 3
12 4 0 8 0 0 1
0 3
Environmental protection 0 3 1
aG, ‘green’ flag: no reason for specific concern; Y, ‘yellow’ flag, be alert; R, reverse flag: reverse trends.
has more yellow flags counted for environmental indicators; this was, however, expected.
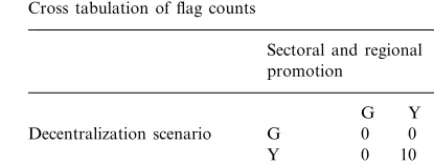
6.1.1. Results from the cross tabulation of flag counts
We will now interpret some pairwise results of the scenario comparison (Tables 8 – 10). After comparing the decentralization vision with the sectoral and regional promotion scenario, we can see that both scenarios have identical scores on the sustainability indicators. There are no indica-tors for which the decentralization scenario gives a better score than the sectoral and regional pro-motion scenario.
The results show that there are three indicators for which the environmental protection scenario gets a better score than the decentralization sce-nario. The decentralization scenario has only one indicator, for which the score is better than for the environmental protection scenario. We can conclude that, with the application of the weak progress scenario, the environmental protection scenario is favoured over the decentralization scenario.
There are three indicators for which the envi-ronmental protection scenario obtains a better score than the sectoral and regional promotion scenario. We may conclude that the environmen-tal protection scenario is favoured over the decen-tralization scenario. After the comparison of the different development scenarios we can conclude that the environmental protection scenario is the most favoured scenario within the context of the weak progress scenario vision on CTVs, followed by the decentralization scenario and the sectoral and regional promotion scenario.
6.2. Moderate progress 6ision
Next, we will analyse the consequences of the moderate progress vision (Table 11). With the application of this vision on CTVs, the differences between the development scenarios become more significant. The environmental protection scenario
Table 8
Cross tabulation of flag counts
Sectoral and regional
Cross tabulation of flag counts
Environmental protection
G Y R
G 0
Decentralization scenario 0 0
Y 0 9 1
R 0 3 3
Table 10
Cross tabulation of flag counts
Environmental protection
G Y R
G 0
Sectoral and regional promotion 0 0 1 9 0 Y
Table 11
Frequencies of flags for moderate progress vision.
Economic indicators Social indicators Environmental All Flags
especially becomes less sustainable. Twelve red flags were counted for this scenario; most of them were assigned to the economic indicators. Rela-tively positive scores were found on the social and environmental indicators (three yellow flags in total). It seems that economic development is
sacrificed in order to achieve ecological
sustainability.
Although the decentralization and sectoral and regional promotion scenario displays a large num-ber of red flags (8 and 7), they are more sustain-able than the environmental protection scenario. The relative positive scores (yellow flags) are mainly seen for the economic indicators. The ob-jectives of these scenarios, viz. redistribution of income and the strengthening of regional-eco-nomic sectors, seem to be well achieved with the use of the policy measures. But these scenarios compromise economic growth for social and envi-ronmental sustainability.
The comparison the decentralization scenario with the sectoral and regional promotion scenario makes clear that the decentralization scenario is slightly more sustainable than the sectoral and regional promotion scenario (Tables 12 – 14). There are two indicators for which the decentral-ization scenario obtains a better score than the sectoral and regional promotion scenario. The sectoral and regional promotion scenario scores better on indicator better than the decentraliza-tion scenario.
There are six indicators for which the decentral-ization scenario obtains a better score than the environmental protection scenario. The environ-mental protection scenario has two indicators for which the score is better than for the decentraliza-tion scenario. We can thus conclude that the
decentralization scenario is more favoured than the environmental protection scenario.
There are also seven indicators for which the sectoral and regional promotion scenario obtains a better score than the environmental protection scenario, while there are four indicators for which the environmental protection scenario obtains better results than the sectoral and regional
pro-Table 12
Cross tabulation of flag counts
Sectoral and regional promotion
G Y R
Decentralization scenario G 0 0 0 0
Y 6 2
R 0 1 7
Table 13
Cross tabulation of flag counts
Environmental protection
Cross tabulation of flag counts
Environmental protection
G Y R
G 0
Table 15
Frequencies of flags for strong progress vision
Economic indicators Social indicators
All flags Environmental
Sectoral and regional promotion 0
0 16 0 0 8 0 0 4 0 0 4
Environmental protection 0
motion scenario. We may thus conclude that the sectoral and regional promotion scenario is
fa-voured over the environmental protection
scenario.
The conclusion is that with the application of the moderate progress vision on CTVs, the decen-tralization scenario is the most favourable sce-nario, followed by the sectoral and regional promotion.
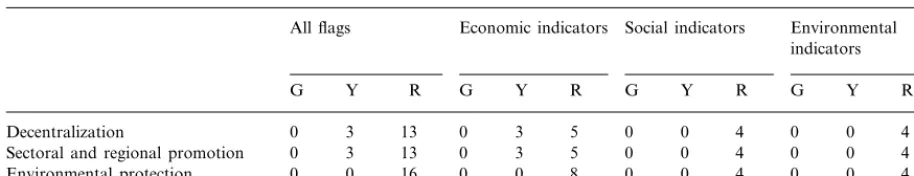
6.3. Strong progress 6ision
Finally, we will analyse the results of the strong progress vision on CTVs. Under these conditions, none of the scenarios can meet the sustainability conditions in all respects. Although the decentral-ization scenario and sectoral and regional promo-tion scenario have some yellow flag scores for the economic indicators, reverse trends occur for the social and environmental indicators. The environ-mental protection scenario is unsustainable with respect to the economic variables; there are no yellow flags scored for the social and environmen-tal indicators. This scenario is with respect to all types of indicators, clearly unsustainable.
6.3.1. Results of the cross tabulation of flag counts
The cross tabulation of flag counts shows no differences in sustainability between the decentral-ization scenario and sectoral and regional promo-tion scenario (Tables 16 – 18). Both scenarios have the same scores on the sustainability indicators. The environmental protection scenario has the most unsustainable scores on the indicators. This is caused by the severe negative effects on the economic indicators, such as total income, income
distribution and employment. The other two sce-narios show some ‘yellow’ scores on these indica-tors and therefore their overall sustainability is slightly better. All three scenarios have the same negative effects on the environmental indicators.
In conclusion, the assessment of sustainability
of the Songkhla/Hat Yai area shows that
sustain-ability is only achieved at the lowest defined levels
Table 16
Cross tabulation of flag counts
Sectoral and regional
Cross tabulation of flag counts
Environmental protection
G Y R
G 0
Decentralization scenario 0 0
Y 0 0 3
R 0 0 13
Table 18
Cross tabulation of flag counts
Environmental protection
G Y R
G
of the CTVs (‘weak progress development’). If CTVs are set more stringently, none of the devel-opment scenarios is able to achieve sustainability scores on the social and environmental indicators. Some relatively positive scores on the economic indicators are shown by the decentralization and sectoral promotion scenarios. The influence of the environmental protection scenario on the eco-nomic indicators is neither positive nor negative, and therefore this scenario becomes less sustain-able when strict CTVs are applied. It can be concluded that the decentralization scenario is the most favourable development scenario; this sce-nario is followed by the sectoral and regional promotion scenario. According to our assessment the environmental protection scenario is the least favourable scenario, mainly because its positive effect on the economic indicators is marginal.
7. Summary and conclusion
The aim of this study was to analyze various development scenarios in relationship to the spa-tial economic development of the Thai city of Songkhla and its adjacent areas. The main focus was on the assessment of sustainable development of this area. The strategic policy findings are briefly summarized here.
7.1. The decentralization scenario
The decentralization scenario has a slight to substantial positive influence on employment, to-tal income and income distribution. Slightly posi-tive effects on the social indicators can also be traced. These effects were to be expected because this scenario was developed to redistribute welfare from Bangkok to the regional centers and the surrounding areas. The scenario also has a shadow-side, as it is accompanied by undesirable environmental effects as a result of the use of additional renewable and exhaustible resources. The assimilative capacity of the environment is also negatively affected. These combined effects therefore, mean only a slight improvement in the total effect on the welfare function of the region under investigation.
7.2. The scenario on the promotion of sectoral and regional de6elopment
This scenario also has a positive influence on employment, total income and income distribu-tion. The effects on the social indicators are ap-proximately the same as the effects on the social indicators in the former scenario. This scenario, however, has a less negative effect on the environ-ment. This is mainly caused by measures which are focused on the restructuring of the agricul-tural sector. The total effect on the social welfare in the area is not significantly different from the effect the decentralization scenario has on this indicator.
7.3. The en6ironmental protection scenario
In regard to this scenario it was expected that it would have a positive effect on the environmental indicators, and the impact matrix correctly shows this. This scenario, however, has only a very slightly positive influence on employment and in-come distribution. An improvement of the envi-ronment clearly results in the improvement of the
quality of life in the Songkhla/Hat Yai area, but
to the detriment of economic growth.
Our assessment of sustainability for the Thai region under consideration shows that sustainabil-ity is only achieved at the lowest defined levels of the CTVs (‘weak progress’). If the CTVs are set more stringently, none of the development scenar-ios are able to achieve sustainability in terms of social and environmental indicators. Some rela-tively positive scores on the economic indicators are shown by the decentralization and sectoral and regional promotion scenarios. The influence of the environmental protection scenario on the economic indicators is neither clearly positive nor negative, and therefore this scenario becomes less sustainable when strict CTVs are applied. It can thus be concluded that the decentralization nario is the most favourable development
sce-nario, followed by sectoral and regional
Finally, it is important to critically judge the methodological tools employed in our sustainabil-ity analysis. There are three critical points which deserve our attention. Firstly, the development of a complex regional system model is of critical importance, even though often by necessity a qualitative assessment has to take place. Secondly, the use of CTVs appears to offer an operational framework for sustainability analysis at the re-gional level, although lack of quantitative and reliable information may force researchers to re-sort to adjusted qualitative methods, (e.g. the auxiliary visions introduced by us). And finally, the flag approach has demonstrated its feasibility, even in cases like ours where no unambiguous expert information was available.
Acknowledgements
The authors wish to recognize the constructive comments made by two anonymous referees on a previous version of the paper.
References
Abel, N., 1997. Mis-measurement of the productivity and sustainability of African communal rangelands: a case study and some principles from Botswana. Ecol. Econom. 23 (2), 113 – 133.
Barbier, A.B., Burgess, J.C., 1996. Economic analysis of defor-estation in Mexico. Env. Dev. Econom. 2 (1), 203 – 239. Beinat, E., 1997. Value Functions for Environmental
Manage-ment. Kluwer, Dordrecht.
Van den Bergh, J.C.J.M., 1996. Ecological Economics and Sustainable Development. Edward Elgar, Cheltenham, UK.
Bithas, K., Nijkamp, P., Tassapoulos, A., 1997. Environmen-tal impact assessment by experts in cases of factual uncer-tainty. Proj. Apprais. 12 (2), 70 – 77.
Capello, R.P, Nijkamp, P., Pepping, G., 1999. Urban Sustain-ability and Energy Policies. Springer – Verlag, Berlin. Von Ciriacy-Wantrup, S., 1952. Resource Conservation,
Eco-nomics and Policies. University of California Press, Berke-ley and Los Angeles.
Charles, A.T., 1997. Towards sustainability: the fishery experi-ence. Ecol. Econom. 11 (3), 201 – 211.
Dasgupta, P., Ma¨ler, K.G., 1996. Environmental economics in poor countries: the current state and a programme for improvement. Env.Dev. Econom. 1, 3 – 7.
Douven, W.J.A.M., 1996. Improving the accessibility of spa-tial information for environmental management: an appli-cation to pesticide risk management, Ph.D. Dissertation, Free University, Amsterdam.
Finco, A., Nijkamp, P., 1997. Sustainable Land Use: Method-ology and Application, Research memorandum. Dept. of Economics, Free University, Amsterdam.
Giaoutzi, M., Nijkamp, P., 1994. Decision Support Models for Regional Sustainable Development. Avebury, Aldershot, UK.
Hamilton, C., 1997. The sustainability of logging in Indone-sia’s tropical forests: a dynamic input-output analysis. Ecol. Econom. 21 (3), 183 – 195.
Heath, J., Binswanger, H., 1996. Natural resource degradation effects of poverty and population growth are largely pol-icy-induced: the case of Columbia. Env. Dev. Econom. 1 (1), 65 – 83.
Hermanides, G., Nijkamp, P., 1998. Multicriteria evaluation of sustainable agricultural land use :a case study of Lesvos. In: Beinat, E., Nijkamp, P. (Eds.), Multicriteria Analysis for Land Use Management. Kluwer, Dordrecht, pp. 61 – 78.
Higgins, S.I., Turpie, J.K., 1997. An ecological economic simulation model of mountain fynbos ecosystems: dynam-ics, valuation and management. Ecol. econom. 2, 155 – 169. Knut, H.A, Turstein, B., Solvieg, G., et al., 1997. Soil degra-dation and economic development in Ghana. Env.Dev. Econom. 2 (2), 119 – 143.
Munasinghe, M., Shearer, W., 1996. Defining and measuring sustainability — the biogeophysical foundations. Env. Dev. Econom. 1 (4), 489 – 493.
Munda, G., 1995. Fuzzy Information on Multicriteria Envi-ronmental Evaluation Models. Physika-Verlag, Heidelberg. Nijkamp, P., Van Pelt, M.J.F., 1987. Spatial impact analysis
for developing countries. Int. Reg. Sci. Rev. 10.
Nijkamp, P., 1999. Environment and regional economics. In: van den Bergh, J.C.J.M. (Ed.), Handbook Environmental Economics. Edward Elgar, Chetenham, UK.
Nijkamp, P., Ouwersloot, H., 1998. A decision support system for regional sustainable development. In: van den Bergh, J.C.J.M., Hofkes, M.W. (Eds.), The Flag model, Theory and Implementation of Sustainable Development Model-ing. Kluwer, Dordrecht, pp. 255 – 273.
Van Pelt, M.J.F., 1993. Ecological Sustainability and Sustain-able Development. Avebury, Aldershot, UK.
Van Pelt, M.J.F., Kuyvenhoven, A., Nijkamp, P., 1994. Envi-ronmental sustainability: issues of definition and measure-ment. Int. J. Env. Poll. 5 (2/3), 204 – 223.
Van Pelt, M.J.F., Kuyvenhoven, 1992. Defining and Measur-ing Sustainability, Research memorandum. Free Univer-sity, Amsterdam.
Pezzey, J., 1989. Economic Analysis of Sustainable Growth and Sustainable Development. The World Bank, Washing-ton DC.
RMNO, 1994. Het Begrip Duer-Zaomheid, Report, Rijswijk. Schulz, C.E., Skonfoft, A., 1996. Wildlife management,
Vreeker, R., 1997. Sustainability Assessment in Southern Thai-land, Master thesis. Dept. of economics, Free University, Amsterdam.
Wackernagel, M., Rees, W., 1996. Our Ecological Footprint: Reducing Human Impact on Earth, The New Catalist
Bioregional Series, vol. 9. New Society Publishers, Gabri-ola Island, BC and Philadelphia; PA.
Weterings, R.A.P.M., Oopschoor, J.B., 1994. Environmental utilisation space and reference values for performance eval-uation. Milieu 4 (9), 221 – 228.