Autonomous choice in the learning process of a turtle
Chinemys ree
6
esii
Shusaku Nomura
a,*, Yukio-Pegio Gunji
a,b aGraduate School of Science and Technology,Kobe Uni6ersity,Nada,Kobe657-8501, Japan
bDepartment of Earth and Planetary Sciences,Faculty of Science,Kobe Uni
6ersity,Nada,Kobe 657-8501, Japan Received 2 June 1999; received in revised form 11 January 2000; accepted 21 January 2000
Abstract
We studied animal’s learning of spatial discrimination in an experimental environment. Turtles,Chinemys ree6esii,
were employed for the study. We focused on two independent aspects: (1) turtle’s success rate in the task, which is the most common criterion to estimate the ability of the animals, and (2) the statistical properties of the time interval of the task, which is independent on the spatial criterion. For a statistical analysis, we employed the scheme of power law distributions which was recently used to estimate animal behaviors in relation to the idea of the fractal. We addressed the basic problem of whether these two criteria, or any other criteria for this matter, could or could not exclude an observer who studies the animal behavior. To demonstrate inseparability of an observer and the object, we conducted three different learning experiments: (1) complete spatial discrimination, (2) incomplete spatial discrimination, (3) another, different, complete discrimination, in this order. The incomplete one was taken to mean incomplete only for an observer. Our experiments reveal that the same result (success rate) was perceived differently by the animal if the attitude of the observer to the experiments differed. This observation comes to suggest that the notion of autonomous choice on the part of an animal is contingent upon the inseparability between an observer and the object. © 2000 Elsevier Science Ireland Ltd. All rights reserved.
Keywords:Autonomous choice; Discrimination learning; Zipf analysis; Power law
www.elsevier.com/locate/biosystems
1. Introduction
An idea currently prevailing in ethology is that animal learning processes are based on instinct, thus determined by genetic codes, and are subject to stimuli in the animal’s environment (Gould and Marler, 1987). On the other hand, many psycho-logical studies have also been conducted to
un-derstand the ability of an animal. In the latter, the issue has been whether the animal can acquire a particular behavior to accomplish a task. The animal behavior has generally been evaluated by referring to the success rate of a given task, such as the decrease of the time interval necessary to achieve the goal. Especially in discrimination learning experiments, scientists evaluate animal behaviors from a spatial point of view, for in-stance, recording which way an animal took, ei-ther left or right.
* Corresponding author.
In these studies the learning process is consid-ered to be algorithmic, in which an animal is supposed to manipulate some specific codes, ei-ther genetic or neuronal. This sort of algorithmic paradigm upon manipulating specific codes, how-ever, does not take into account, the notion of animal autonomy or decision-making property. Earlier behaviorist theories attempted to account for animal behaviors in term of stimulus-response (S-R) associations (Hull, 1943, 1952). Cognitivist initially appealed to the notion of cognitive maps as differing from behaviorist (Tolman, 1948). But recently, like in the notion of ‘place-cell’ in the hippocampus (O’Keefe and Dostrovsky, 1971), both come to hold basically a common frame-work assuming a one-to-one mapping between an input and an output.
We now want to examine the notion of animal autonomy and the aspect of learning process, as shedding some critical remarks upon such a framework. Our issue will be a critical examina-tion of the role of the observer necessarily intro-duced into the framework.
One implication of behaviorism is that behavior should be observed as a phenomenon, without making any conjectures about what might be going on within the subject’s mind. It is viewed as a ‘black box’. However, what does matter more in behaviorism is the notion of ‘external observers’ who could definitely observe, describe and encode animal external behaviors. Consider, for instance, the following learning experiment: An observer cannot understand animal’s internal processes in the ‘black box’, but can definitely prepare a prob-lem as an input to an animal and observe the consequential animal behavior, for instance, in terms of success or failure. It implies that the observer knows the answer to the problem, while the animal does not. In other words, the observer can give an animal a problem which is uniquely defined, and ‘the problem’ is not only for the animal but also for the observer. Note that it remains to be seen whether the animal regards the problem set by the observer as an appropriate problem to the animal itself. It is just the idea of anthropomorphism. The external observer who sets the problem and anticipates its a priori unique solution is an anthropomorphic artifact at best.
Despite that, the role of the external observer cannot be wiped out of the study of animal be-haviors. Imagine, for instance, an animal put in a maze having no exit. The observer cannot formu-late a well-defined problem of learning the incom-plete maze to the animal. This observation suggests that we cannot separate the results of learning from the definition of learning, demon-strating inseparability of an observer and an ob-ject (Mizukami et al., 1999). If an animal behavior is uniquely encoded by an input-to-output map-ping of a one-to-one, critical examination of the role of the external observer would be suspended. This situation is quite resembled to the Frame problem in AI (McCarthy and Hayes, 1969). When one tries to construct a robot which can react to even unknown situations with a one-to-one correspondence scheme, the artifacts originat-ing in the assumption of external observer would become inevitable. Bickhard and Terveen (1996) deal with the fundamental and issues that are intrinsic to encoding in AI and cognitive science. According to their view, encodingism restricts learning by limiting it to the combinatoric space defined by the encoding atoms. It simply means that no new representations are possible, and that the encoding atoms must successfully anticipate all possible contingencies in their space of combi-nations. However exactly the very reason for what leaning is functionally intended for. There would be no need of learning if anticipation succeeds.
The animal used in our experiments is com-monly called reeves’ pond turtles (Family
Emydi-dae). It lives in shallow-freshwater ponds,
marshes, or lakes. Its habitat and ecology are reported, for example, in Ernst and Barbour, 1989 and Parmenter and Avery, 1990. The species belonging to this family is used most often
in learning experiments (Burghardt, 1977;
Macphail, 1982; Suboski, 1992; Papini and Ishida, 1994).
2. Methods
2.1. Experimental strategy
We focused on the working hypothesis that may allow the observer to describe animal behav-iors unambiguously in a one-to-one mapping mat-ter. Our objective was to find a framework enabling the observer to describe animal behav-iors uniquely. We conducted an incomplete learn-ing experiment in addition to ordinary complete learning experiments. In the incomplete learning experiment, animals were forced to fail or succeed by the observer, whereby the observer cannot distinguish whether the animal actually failed or succeeded. The reason why the observer cannot make such a distinction consists in an ill-suited nature of the problem. We then paid attention to differences in evaluating the same result, that is, differences in the observer’s attitude to those ex-periments. We first conducted a pre-experiment with turtles, C. ree6esii that is the ordinary and
classical spatial discrimination experiment using the most common apparatus, often called a Yerkes’ discrimination apparatus (Yerkes, 1907). A turtle was put into the experimental box with two lanes, right and left. The one was the correct lane in that the turtle choosing this lane was rewarded with food, and the other was the wrong one in that if chosen the turtle was punished physically. After 100 trials, the turtle tended to choose the correct lane. So the success rate of choosing the correct lane in the latest 8 trials was 100%. We also conducted another experiment, in which the correct lane was changed to the wrong
one and vice versa in every trial. The success rate of one turtle over 100 trials was found to be roughly 50%. Actually the turtle gradually stuck to one particular lane and got reward and punish-ment alternatively. From this experipunish-ment, how-ever, we cannot expect any definitive observation on the animal behavior with respect to the ability of learning.
We then tried to unveil the role of the external observer more clearly and reconstructed the no-tion of animal autonomy or decision-making. For
this purpose, we conducted an incomplete
experiment.
We attempted three different types of experi-ments with in the following order: (1)
complete-discrimination learning experiment, (2)
incomplete-discrimination learning experiment,
and (3) another complete-discrimination learning experiment. Experiment (1) and (3) are ordinary experiments in which the observer can definitely identify whether the animal succeeded or failed as practiced in behaviorism. In contrast, the incom-plete-discrimination learning experiment was
per-formed in a situation with incomplete
experimental conditions, in which the notion of success or failure had no special meaning for estimating the ability of animal behaviors. In this sense, experiment (2) is studied outside the behav-iorist’s framework.
2.2. Subjects
We used 17 experimentally naı¨ve turtles (C.
ree6esii) obtained from a commercial dealer in
Kobe. Among them, 10 turtles completed all the experiments and were used in the analysis. The turtles measured 21 – 31 mm in length and 16 – 24 mm in width. From the date of their arrival to the laboratory till the end of all the experiments, they
were all housed in the same tank (60 cm long×30
cm wide×35 cm high) made of transparent
plastic and filled with water (28 – 32°C) to a depth of approximately 2 cm. During the day time
they were exposed to natural sunlight for
2.3. Apparatus
The animals were trained in a 30×33×25 cm
box with a gentle wooden slope of 22.2° (training box; Fig. 1). On the upper part of the slope, there were two trapdoors side by side. The slope
(in-cluding the trapdoors) was 36 cm long×30 cm
wide, and each trapdoor was 10 cm long×14.5
cm wide. Narrow path named the ‘safety path’ (1 cm wide) was arranged between the trapdoors. The slope was covered with a mesh net to provide friction for making the turtles climb easily. The right and left trapdoors were called ‘Trapdoor-R’ and ‘Trapdoor-L’, respectively, and could be opened manually to make an animal fall to the bottom of the training box. The bottom of the training box was covered with a soft mat to reduce physical damage when an animal fell down into the training box.
2.4. Procedure
At the end of a one-month adaptation period, all 17 turtles were put to three different types of experiment.
2.4.1. Complete LR-discrimination learning experiment (‘I-R’, ‘I-L’)
The LR-discriminating learning experiment was designed to test if the turtles have an ability to solve alternative problems. First, we decided which Trapdoor would be the correct one, where the turtle could walk through without falling down to the bottom. An individual turtle was first moved to the starting point of the training box (the lower and the central parts of the slope), and left alone. When the correct door was Trapdoor-R, and a turtle climbing up the middle line over Trapdoor-L (Fig. 1), was forced to fall due to opening of Trapdoor-L. The turtle was then im-mediately moved back to the starting point again. Such a response was called an ‘F’ (false) response. If a turtle climbed up over Trapdoor-R, the trap-door was not opened, After reaching the top of the slope, the turtle was returned to the home tank for staying there for 3 min and the back to the staring point again. This response was called a ‘T’ (true) one. One trial continued until a turtle climbed up the slope and finished or fell down. If a turtle did not accomplish the task within 30 min, the trial was suspended and was called an ‘S’ trial. The trials for each day ended when the turtle finished with either 10 T responses or 2 S trials. In addition, the maximum duration of the whole experiment per day was 90 min. These trials were named LR-discrimination experiment I-R (the right trapdoor was always opened by the ob-server). These were performed for all the turtles. TheI-R experiment was considered to be com-pleted when the turtle accomplished one of the following two learning conditions: (i) The propor-tion of T (the total number of correct trials made in a day) was 100%, or (ii) the proportion of T was over 80% for two successive days. After the I-R period was completed, the experiment was switched to I-L (the left trapdoor was opened) on the next day. The difference between the I-L and I-R was the change in the correct door from the right to the left. All the other conditions were kept the same as in the I-R. These two LR-dis-crimination experiments were carried out for a total of 9 days, and then suspended irrespectively whether or not each experiment was completed. Fig. 1. The training box. There are two trapdoors on the slope
Table 1
Schedule of experimentsa
Training l Interval (days) Training 2 Interval (days) Training 3 Group Sample (turtle)
I-R, I-L 12
T l II-T 5 III
2 I-R, I-L 12 II-T 5 III
I-R
3 12 II-T 5 III
I-R, I-L 12 II-F
4 5
F III
5 I-R, I-L 12 II-F 5 III
6 I-R, I-L 12 II–F 5 III
I-R, I-L 12 II-F
7 5 III
N 8 I-R, I-L 12 – – III
I-R, I-L 12 –
9 – III
I-R, I-L 12 – – III
10
aEach group of turtles was tested in the order shown. Group N was not tested in Training 2. See text for explanation of differences in training.
2.4.2. Incomplete-discrimination experiment
(‘II-T’,‘II-F’)
The 10 turtles who finally completed the LR-discrimination experiments were divided into three groups: ‘GroupT’ (intentionally true con-trolled) (n=3), ‘GroupF’ (intentionally false
con-trolled) (n=4), and ‘GroupN’(non-controlled)
(n=3). The meaning of ‘intentionally true/false controlled’ will be explained below. Each group was tested with three types of problem in different order (Table 1). All experiments started 12 days
after the LR-discrimination experiment was
finished.
The ‘II-T’ and ‘II-F’ experiments were not dis-crimination learning experiments. During each ex-periment, the ‘correct’ trapdoor was not decided in advance, but it was dependent on the turtle’s choice of the way to go. The rate of success (T) per day was scheduled in advance for each exper-iment, whatever door a turtle chose (R- or L-trap-door) in each trial. For example, if the rate of T is
assigned in advance as 100% (or 0%), a turtle will not be (or will be) made to fall down in the trials, independently of a turtle’s choice of R- or L-trap-door. This strange experiment conflicts with the fundamental assumption in a discrimination ex-periment that the ‘correct’ trapdoor must not be altered during the experiment, and can be re-garded as an ill-suited experiment with incomplete experimental conditions. In this experiment, T, F and S responses were defined the same as for the first experiment, while in this experiment T (or F) did not imply that an animal chose the correct (or false) answer. Each experiment ‘II-T’ and ‘II-F’ was lasted for 7 days. Table 2 shows the succes-sion of T or F schedule. The proportion of T per day were kept constant for II-T, 77% (10 ‘T’ trials in 13 trials total) in the first 5 days, 91% (10 ‘T’ trials out of 11 trials) in the next 2 days, and 23% for the whole period (7 days) for II-F. All other conditions (for example, the 3 min interval for a finishing a T trial, and no interval for an F trial)
Table 2
The arrangement of ‘T’ and ‘F’ codes in two intentional experimentsa II-T code Trial no. (13 or 11 trials per day)
1 2 3 4 5 6 7 8 9 10 11 12 13
T T
Initial 5 days T T T T T T F T F T F
T F T T T
Last 2 days T T T T T T
T T F
II-F code F F F F F T F F F F
were the same as those in the LR-discrimination experiment. In the II-T experiment, each individ-ual could achieve the learning condition for the LR-discrimination experiment.
2.4.3. Complete-discrimination learning experiment (‘III’ experiment)
The ‘III’ experiment was a different complete discrimination learning experiment lasted for 10 days, but it was more difficult to achieve the correct answer than in the LR-discrimination ex-periment. We defined the correct behavior only when the turtle climbed up along with the ‘safety path’ and reached the top of the slope. All the other procedures were the same as in the LR-dis-crimination experiment. The III experiment was started for Group T and Group F 5 days after the ‘II-T’ or ‘II-F’ experiment. The III experiment for Group N was started 12 days after the LR-dis-criminate experiment (See Table 1).
During all trials in each experiment, the ani-mals were recorded by a video recorder and were observed only on a video monitor. Attention was paid not to disturb them, while they were moved by our hand to the tank or the starting point.
3. Results
In all the trials of each experiment, most turtles tended to start climbing the slope as soon as they were placed to the starting point. Each turtle
climbed the slope 464602 times in a whole set
of experiments. The number of climbs depended on whether a turtle succeeded in a given trial within a prespecified period. Therefore, the exper-iment was not completed when an animal contin-ued to fall down through the trapdoors. In all the experiments, the turtles accomplished T or F (sometimes S) responses for each trial. Ten trials were regarded as one ‘block’, and the ratio of T responses in one block was called as the success
rate (0.01.0). The length of each trial (total
time) was calculated from the video recordings. The two-dimensional plane of the slope was
di-vided into a grid of squares (5×6=30 squares),
and the number of visits to each square a turtle demonstrated (‘steps’) during a trial was counted.
The indicator of the efficiency of climbing the slope is defined by
transition time
=total time of climbing/the number of steps
which means the average time for one step. The transition time decreases as the animal’s speed increases. The faster an individual animal moves, the lower is the transition time.
3.1. Complete LR-discrimination learning experiment (‘I-R ’, ‘I-L ’)
Ten of the initial 17 individuals achieved at least one of learning conditions, so they seemed to have the ability of solving the alternative-choice problem. The other 7 individuals failed to achieve either conditions. The failed individuals tended to stay at the bottom of the slope, so they were recorded as S many times. The number of turtles that did not achieve the I-L conditions was greater. The LR-discrimination experiment I-L was a reverse learning experiment, because it was made immediately after theI-R experiment. All the turtles had already learned that the left trap-door was false, which seemed to be the reason for fewer turtles to be successful in I-L. As for the speed of learning (that is, the number of times the turtle climbed up the slope until it learned the correct trapdoor I-R), Turtle 4 was the fastest: only 28 attempts. The other turtles’ speed of learning ranged from 40 to 164 trials.
3.2. Incomplete-discrimination experiment (‘II-T’,
‘II-F’)
We arranged 10 turtles in ascending order, de-pending on the number of days required to ac-complish the II-R experiment. Then we divided them into three groups: Group T (Turtles No 1, 4, 7, 10), Group F (Turtles No 2, 5, 8), Group N (Turtles No 3, 6, 9). Each group contained turtles of all learning speeds to balance the abilities of individual turtles.
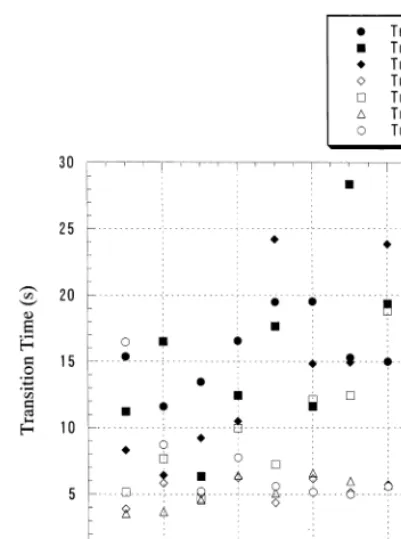
Fig. 2. Time taken for II experiment. Closed symbols: the individual animals of Group T (n=3). Open symbols: Group F animals (n=4).
The major difference between Group T and Group F was in the range of the transition time. Fig. 2 shows the average transition time per block in II-T and II-F. It shows that the individuals in Group F had moved up the slope significantly faster than those in Group T (mean transition
time: Group T tT=15.0192.22, Group F tF=
6.9191.41, PB0.05). In Group F the speed of
movement, which is the inverse of the transition time in II-F, was approximately seven times the speed in I-R (mean transition time in I-R: Group
F tF=50.07927.5, PB0.05). Other significant
differences were not observed.
3.3. Complete-discrimination experiment (‘III’
experiment)
To judge objectively if an individual turtle had the ability to solve the problem of the third experiment, we divided all trials in experiment III into three successive parts with equal number of trials and counted the number of T responses. Table 3 shows the rate of T trials in each part. In Table 3 ‘Trials’ is the number of all the trials throughout III experiment. We defined the turtle successful and having the ability to solve the
conditions of the experiment III if DR and 3rd –
part values were comparatively large (Turtle 1, 3,
5, 6, 8;DR=0.160.36, 3rd –part=0.400.58).
On the contrary, turtles with smaller values ofDR
and 3rd –part values were defined as unsuccessful and not able to solve the problem (Turtle 2, 4, 7;
DR= −0.120.06, 3rd –part=0.160.39).
From estimating the difficulty of III experiment, trials. Whichever trapdoor, R or L, the turtle
climbed over, the correct trapdoor was temporar-ily determined after the turtle touched either trap-door. In contrast, in II-F, we made the turtles fall down a trapdoor in any trial. Turtles belonging to Group T were tested in II-T experiment, and those in Group F were tested in II-F.
Table 3
The rate of successful trials (the rate of T code) at every part of the trials during Training IIIa
Procedure Trials 1st-part 2nd-part 3rd-part
Group Sample (turtle) A R
0.36 success 0.55
0.40 0.19
234 l
T
−0.12
2 156 0.37 0.31 0.25 failure
0.33 success
3 231 0.25 0.48 0.58
0.06 0.39
0.34
0.33 failure
282 4
F
5 243 0.31 0.37 0.47 0.16 success
348
6 0.15 0.34 0.40 0.25 success
failure −0.01
0.16 0.17
0.17
7 396
Fig. 3. Typical results and fitting lines of transition time against rank on double logarithmic plots at LR-discrimination experiment.
three kinds of experiments as a whole, we ana-lyzed another aspect of animal’s behavior which does not include the notion of success rate and allows to detect changes in statistical properties of the turtles’ motion, the dependence of the transi-tion time upon its rank.
The values of transition time in each trial were sorted in descending order (rank). For example, the transition time of rank 1 was the longest, that of rank 2 the second longest, and so on. Fig. 3 shows some typical results and fitting lines of the dependencies (1, 2) for the transition time versus rank in double logarithmic plots corresponding to LR-discrimination experiment. For experiments II and III the corresponding plots look similar. The success rate of almost all turtles in the experiment III did not show a smooth curve, and fell down to a low level (between 0 and 10%) at least once in about 100 trials. We divided experiment III into two parts where the success rate first decreased to such a low level, III-fh (the first part of III) and II-sh (the second part of III), and analyzed the
dependencies of the rank versus transition
time for both parts independently. Table 4 shows the value (M1) of a regression line, calculated from
Y=C1×X
(M1) (1)
where C1 is a constant, and Y is the transition
time and X is the rank. Each regression line was
calculated by neglecting high ranks. The values in Table 4 in parentheses are not significant because of the low value of square value of a correlation such a definition might be reasonable. All
individ-uals belonging to Group N fulfilled these success criteria.
Rank×transition time analysis
(power law distribution)
We could not estimate the success rate in II-T and II-F because the success rate in each experi-ment had no meaning in terms of standard dis-crimination experiment. To understand what happened to a turtle throughout the series of
Table 4
The results of the rank transition time analysis
III-1h III-fh
II-F II-T
I-L I-R
Leaning Sample (turtle)
Group DM1
(DM2) Success −0.48 (−0.91) −0.37 –
T l −0.64 −0.35 0.29
Failure (1.54) −0.47 −0.47 – −0.49 −0.47
2 0.02
0.35 −0.24
−0.26 –
3 Success −0.45 – −0.59
Failure −1.40 −0.18 – −0.28 −0.29 −0.24
F 4 0.05
5 Success −0.34 −0.40 – −0.68 −0.70 −0.44 0.26
0.17 −0.13
−0.30 −0.29
– −0.26
6 Success (−0.35)
coefficient R2. The values accompanied by
the symbol c show the value (M2) calculated
from
Y=C2×e
(M2×X) (2)
where C2 is a constant. The DM1 (or DM2)
means the absolute value of the difference between the largest and the lowest of M1 (or M2) in II, III-fh and III-sh.
The change of M1 (or M2) is strongly relevant to the results of III experiment. Strictly speaking, the change in M1 (or M2) of the turtles that were
defined as ‘failure’ was clearly small (DM1=
0.020.05,DM2=0.02). In contrast, the change
in M1 of the turtles defined as ‘success’ was much larger (DM1=0.170.35).
4. Discussion
We extracted the statistical properties of the behavior in each experiment by sorting the transi-tion times of all trials in descending order without making the distinction of whether an animal climbed up the right-hand or left-hand side of the slope. Such way of analysis was first proposed by Zipf (1949) for the statistical approach to linguistic
analysis of texts. Generally, fractal dimension D
was calculated from Zipf plots. In our study, D
was the inverse of the slope M1; and most of M1
value for each individual were M1B1, and thus
D\1. According to Mandelbrot (1982),D\1 can
not be interpreted as fractal dimension, which is only met in cases where a discourse is unnaturally limited by extraneous means (e.g. Latin inserts in a non-Latin text). But, generally speaking, Zipf’s law is emergent in the sense that there are no obvious consequences of the underlying dynamical rules.
Shimada et al. (1995) analyzed the food dwelling
time of Drosophila, a fly, from the fractal view
point. According to their study, the fractal behav-ior emerges statistically when the animal is placed into a new environment (or a complex situation) that requires complex information processing by the animal. Other behavior expressed by ex-ponential or the Gaussian distribution may indi-cate rather simple information processing for
reflex behavior or after adaptation has been attained.
In the second experiment, the observer cannot decide if a turtle can solve a problem, while the proportion of successes is more than 70%. Only the first and third experiments can be estimated. If no correlation exists between the success of the second and third experiments, then the second experiment is regarded as an erroneous process or perturba-tion, whether or not the turtle can achieve success in the third experiment. We, however, found that a statistically significant power-law distribution of intermittent walk realized in the second experiment was a key to success in the third experiment. This distribution is independent of the result of the first experiment, that is, the choice of either left or right.
We conclude that a turtle autonomously chooses a particular behavioral pattern independently of external observer’s evaluation in terms of success or false. In other words, we cannot evaluate or encode animal behaviors throughout the whole series of experiments in terms of a one-to-one mapping framework. Our animals had apparently
solved the difficult situation of the third
experiment, which is beyond the traditional
frame-work of simple behaviorism. Autonomous
choice on the part of the animal certainly goes beyond a one-to-one mapping between the input and output.
In summary, the notion of inseparability of an observer and the object entails autonomy of learn-ing and decision-maklearn-ing. What should be rejected
is only the one-to-one causal relationship,
while causality remains intact. The idea of auton-omy is just a dual concept to the mechanical thinking, instead of being something smacking of vitalism.
Acknowledgements
References
Bickhard, M.H., Terveen, L., 1996. Foundational Issues in Artificial Intelligence and Cognitive Science; Impasse and Solution (chapter 1, 2, 3, 4, 6, and 12). Elsevier, New York.
Burghardt, G.M., 1977. In: Gans, C., Tinkle, D. (Eds.), Learn-ing Process in Reptiles: The Biology of Reptiles, vol. 1. Academic Press, New York, pp. 555 – 681.
Crutchfield, J.P., 1994. The calculi of emergence: computation, dynamics, and induction. Physica D. 75, 11 – 54.
Ernst, C.H., Barbour, R.W., 1989. Turtles of the World. Smithsonian Institution Press, Washington, DC.
Gould, J.B., Marler, P., 1987. Learning by instinct. Sci. Am. 256 (1), 62 – 77.
Gunji, P.-Y., 1995. Global logic resulting from dis-equilibra-tion process. BioSystems 3B, 33 – 62.
Gunji, P.-Y., 1996. Behavioral Plasticity of hermit Crabs. Rivista di Biologia; Biology Forum 89 (1996), pp.69 – 78. Gunji, P.-Y., Toyoda, S., 1997. Dynamically changing
inter-face as a model of measurement in complex systems. Physica D. 101, 27 – 54.
Hull, C.L., 1943. Principles of Behavior: An Introduction to Behavior Theory. Appleton-Century-Crofts, New York. Hull, C.L., 1952. A Behavior System. Yale University Press,
New Haven.
Kitabayashi, N., Kusunoki, Y., Guniji, P.-Y., 1999. The emer-gence of the concept of a tool in food-retrieving behavior of the antsFormica japonicaMotschulsky. BioSystems 50, 143 – 156.
Macphail, E.M., 1982. Brain and Intelligence in Vertebrates. Clarendon Press, Oxford.
Mandelbrot, B., 1982. The Fractal Geometry of Nature. Free-man, San Francisco, pp. 341 – 348.
Matsuno, K., 1989. Protobiology: Physical Basis of Biology. CRC Press, Boca Raton, FL.
McCarthy, J., Hayes, P.J., 1969. Some philosophical problems from the standpoint of artificial intelligence. Mach. Intell. 4, 463 – 502.
Mizukami, I., Gunji, Y.-P., Migita, M., 1999. Self-similar pattern in conceptualization by goldfish. BioSystems 54, 91 – 104.
O’Keefe, J., Dostrovsky, J., 1971. The hippocampus as a spatial map: preliminary evidence from unit activity in the free-moving rat. Brain Res. 34, 171 – 175.
Papini, M.R., Ishida, M., 1994. Role of magnitude of rein-forcement in spaced-trial instrumental learning in turtles. Quart. J. Exp. Psych. 47B (1), 1 – 13.
Parmenter, R.R., Avery, H.W., 1990. In: Gibbons, J.W. (Ed.), The Feeding Ecology of the Slider Turtle: Life History and Ecology of the Slider Turtle. Smithsonian Institution Press, pp. 257 – 266.
Rossler, O., 1987. In: Casti, J., Karlqvist, A. (Eds.), Endo-physics: Real Brains-Artificial Mind. North-Holland, New York.
Shimada, I., Minesaki, Y., Hara, H., 1995. Temporal fractal in the feeding behavior ofDrosophila melanogaster. J. Ethol. 13, 153 – 158.
Suboski, M.D., 1992. Releaser-induced recognition learning by amphibians and reptiles. Anim. Learn. Behav. 20, 63 – 82. Tolman, E.C., 1948. Cognitive maps in rats and men. Psychol.
Bull. 50, 189 – 208.
Yerkes, R.M., 1907. The Dancing Mouse. Macmillan, New York.
Zipf, G.K., 1949. The Human Behavior and The Principle of Least Effort. Addision-Wesley Press, Cambridge, MA.