Generic take-up in the pharmaceutical market following
patent expiry
A multi-country study
John Hudson*
Department of Economics, University of Bath, Bath, BA2 7AY, United Kingdom
Abstract
This article analyzes for the pharmaceutical market in the United States, the United Kingdom, Germany, and Japan: (a) the determinants of generic entry; (b) the determinants of the entry lag when there is generic entry; and (c) the impact on original brand sales of generic entry. The results suggest that the larger the market, the greater is the probability of both generic entry and the subsequent impact on original brand sales. These results imply that the value of a patent does not end with patent expiry, as the literature commonly assumes, and estimates of patent postexpiry values are obtained. © 2000 Elsevier Science Inc. All rights reserved.
Keywords:Generics; Patent value; Pharmaceuticals
1. Introduction
What impact does patent expiry have on original brand sales in the pharmaceutical market? Despite the considerable work that has been done on pharmaceutical markets this remains a relatively unexplored area. There has been some work done on the impact of generic entry on the original brand, although this has mainly focused on the original brand’s price and market share in the United States. Thus, Hurwitz & Caves (1988) examined the impact of generic entry on market share, promotional spending, and the number of generic entrants. They found that the original brand market share is directly proportional to the age of the original brand, which they
* Corresponding author.
E-mail:[email protected] (J.R. Hudson).
interpret as a brand loyalty variable, and to own brand promotional spending and is negatively related to entrants’ potential spending and to the number of entrants. They also found that the number of new entrants was directly proportional to the total size of the market and the age of the original brand. This latter variable figures in several other studies and would appear to be of some importance, but we feel that its interpretation as a brand loyalty variable is open to question. The youngest original brand at patent expiry is unlikely to be less than 10 years old (dating age from the date the product first registered positive sales), and it seems somewhat unlikely that there is any significant difference in the brand loyalty of, e.g., a 15-year-old brand and a 10-year-old brand. We shall later put forward an alternative interpretation of this variable that is similar to a possibility discussed by Manning (1997), who argued that it may reflect life cycle effects as new products appear on the market.
Grabowski & Vernon (1992) analyzed the impact of generic entry following the intro-duction of the 1984 Drug Price Competition and Patent Restoration Act (The Waxman– Hatch Act) in the United States, which facilitated the entry of generics after patent expiry while restoring part of the patent life lost during the pre-market regulatory process for new introductions. In their empirical analysis, they showed that generics entered the market at a significant price discount, which then declined steadily over time. The price of the original brand actually increased, albeit in nominal terms, in the period following generic entry. As with Hurwitz & Caves (1988), they also analyzed generic entry in terms of the number of generic products, which they linked to a profitability variable and a set of brand loyalty variables, both of which are defined at the time of initial entry. More recently, Grabowski & Vernon (1996) specifically examined the impact of the Waxman–Hatch Act. They found generic competition intensifying in recent periods, with major brand names typically losing half of their market share within a year of patent expiry. On the other hand, they also found that the provision within the Waxman–Hatch Act for patent extension lengthened the effective patent life.
Caves, Whinston & Hurwitz (1991) analyzed the impact of generic entry in several therapeutic classes in the United States. They found that the price of the original brand declines over time as more generic entrants appear. Ellison, Cockburn, Griliches & Hausman (1997) modeled demand for four cephalosporins, again in the United States. They concluded that there was a fairly high demand elasticity between generic substitutes and a smaller, but sometimes significant, demand elasticity between therapeutic substitutes, i.e., chemically distinct drugs that can be used to treat many of the same conditions. Griliches & Cockburn (1994) concentrated on the impact of generics on pharmaceutical price indices but, in the process, analyzed the diffusion of generics and the impact on the original brand’s price of generic entry.
measured in revenue terms. Hence, analyzing market shares only gives a partial picture of the impact on the original brand. This article also differs from much of the previous work in its international emphasis, analyzing not just the US market but also those of Japan, Germany, and the United Kingdom. Unlike France, for example, generics take a significant market share in all of these markets, while, unlike Spain and Italy, all have had an effective system of patent protection in place throughout the sample period. But in other respects they differ significantly both in the extent to which the markets arefreefrom government intervention and the size of the market. Other characteristics are also very different. For example, in Germany generics appear as branded products in their own right with either a unique trademark or with the maker’s name specified, while, as has been mentioned already, in the United States the 1984 Waxman–Hatch Act facilitated generic entry by allowing generic entrants to demonstrate bioequivalence to the original brand rather than having to replicate many of the tests undergone by the original brand, as was originally the case.
In the next section, we shall briefly discuss some of the theoretical issues raised by patent expiry and generic entry. We then will discuss how the implications of this analysis are likely to differ in the contrasting market environments of the four countries. The results of the empirical work will follow, after which we will discuss some of the implications of our work for the valuation of patents. The literature on this subject typically assumes that patent benefits end with patent expiry. Our analysis emphasizes that they do not, and we obtain estimates of postexpiry patent values (PEPVs). Finally, there will be a brief concluding section.
2. Theory
A generic product may not be a perfect substitute for the original brand due both to subjective and objective factors, and it is these that allow the original brand to continue to sell despite the presence of low-price generic competition. The concept of bioavailability relates to how much of the drug’s active ingredients get into the bloodstream and to the site and rate of therapeutic action. Two drugs that have approximately equal bioavailability and are chemically identical are said to be bioequivalent. They are therapeutically equivalent if they are equally effective in treating a disease. However, even if two drugs are bioequivalent, there may still be objective reasons for regarding them as different. For example, Schwartzman (1976) argued that smaller generic manufacturers are likely to invest less in quality control than larger, branded manufacturers, although Hurwitz & Caves (1988) find the evidence somewhat contradictory. On the other hand, the survey evidence that physicians
believe this to be the case, in the United States at least, is quite strong. Concern about malpractice suits is one factor leading physicians to becoming relatively more reluctant to prescribe generics. This concern is then one factor that the branded manufacturer can exploit in promoting the product after patent expiry. More recently, there have been a number of drug scandals, for example, the alleged switching of brand name drugs for generics in bioequivalence tests. This prompted the Food and Drug Administration into retesting the most frequently purchased generic drugs for bioequivalence. The majority of these drugs subsequently were found to be safe (SFS, 1990)
from this that, if we assume a population of n generic firms, each with a probability p of entering the market after a period of l years where l;G(m,s2) and where G is some distribution function, then (a) the probability of generic entry and (b) the lag between patent expiry and generic entry are both linked to market size. This second conclusion is consistent with the analysis of Caves et al. (1991, p. 18). Their explanation for this is severalfold. First, even if all entrants begin their attempts to enter at the same time, the time needed to gain approval is “no doubt random.” Second, the equilibrium sequence of entry may be staggered, partly due to uncertainty surrounding market opportunities for generics and partly due to unanticipated growth in market size. This latter reason may be thought to be the most significant factor behind delayed generic entry. However, there are several other areas of uncertainty facing potential generic entrants relating to both the actual time of patent expiry and the marketing reaction of the original firm to patent expiry. The uncertainty surrounding the timing of patent expiry relates to both whether the firm will apply for a patent extension, which may be done very close to the time of patent expiry (Hansen & Hill, 1994) and to whether such an application will be successful. The uncertainty surrounding the original firm’s response to patent expiry relates to whether it will “defend” its market share by, for example, cutting its price. Both of these elements of uncertainty may cause potential generic entrants to delay planned entry until after the patent has actually expired.
Because new entrants will be interested in discounted future profits, the appropriate measure of market size should take account of both the current market size and its anticipated growth rate. The latter will be assumed to be inversely proportional to the age of the branded product at patent expiry. This will not be the same for all products. The nominal patent life is, with certain qualifications, the same for all pharmaceutical products within a given country, but the effective patent life is not. The effective patent life is the time between product entry and patent expiry as opposed to nominal patent life, which is the time between the patent being registered and expiring. The former differs from the latter as up to 10 years may be consumed in development before a marketing license is granted. In addition, there are options open for firms to apply for patent extensions. In the United States, this arises from the provisions of the Waxman–Hatch Act. In Europe, since 1993, supplementary protection certificates (SPCs) were introduced providing for the extension of patent life. SPCs differ between countries but are gradually being harmonized under European Union (EU) law (Hansen & Hill, 1994). In the United Kingdom and Germany, there are now no separate national laws, but the interpretation of EU laws may still differ between the two countries. Japan introduced the extension of term for pharmaceutical products in 1988. Similar to the United States, the patent term can be extended up to a limit of 5 years from the original expiration date. Hence, we initially conclude that the probability of generic entry is directly proportional to brand sales on patent expiry and is inversely proportional to the age of the product, while the observed lag between patent expiry and generic entry is inversely proportional to brand sales and is directly proportional to the age of the product.
First, generic products need to be registered and information provided on bioequivalence, bioavailability, and clinical trials. In Germany, for example, the law was amended in 1987 to forbid German generics manufacturers from using such data from the original product for a period of 10 years following the first registration of the copy product. If we assume (a) that the costs of registering the product, including those costs associated with uncertainty, increase with the speed of registration and (b) that the bigger the market (in terms of actual revenue sales) the greater the gains of rapid entry, then the more likely rapid entry costs are to be incurred andmwill be inversely related to the actual and potential market size. Apart from the size of the market and the age of the branded product at patent expiry, we will also include the price of the product to determine whether either the probability of generic entry or the entry lag are different for high-priced products than for cheaper ones. This could be the case if either unit profitability or the rate at which generics gain market share are increasing functions of price.
Once generic entry has occurred, the impact on sales can be gauged by comparing sales to those at generic entry. We assume that demand, in volume terms (D), is a function of price, relative to prices in general (P), the stock of advertising goodwill, and the age of the product (AGE). The impact of generic entry will be a function of the length of time since generic entry (GAGE), the promotional effort of the original manufacturer, the size of the market, in revenue terms, at patent expiry (Sp5DpPp), and the price of the product at patent expiry (PP). According
to our previous analysis, Spwill partly determine the number of generic entrants. Ppmay also
affect the number of generic entrants, but it also reflects the potential price advantage of generic entrants over the original brand, as the larger is Pp, the greater is the potential for absolute, and maybe also proportionate, price cuts. We further assume that by patent expiry the stock of advertising goodwill has stabilized at a long-run level and that it has no further impact in expanding the market. Hence, with a Cobb–Douglas demand function the demand equation becomes:
Dt5APtaAGEtbexp@~d01d1Pp1d2Sp!GAGEt#, (1)
Dt/DG5~Pt/PG!a~AGEt/AGEG!bexp@~d01d1Pp1d2Sp1d3SR1
1d4SR2!GAGEt#. (2)
Therefore, the log of the ratio of original brand revenue (in real terms, i.e., deflated by the consumer price index) to the revenue at generic entry is given by:
ln(PtDt/PGDG)5ln~St/SG!5~a 11!ln~Pt/PG!1bln~AGEt/AGEG!1d0GAGEt
1d1PPGAGEt1d2SpGAGEt1d3SR1GAGEt1d4SR2GAGE.
(3) We will proxy ln(Pt/PG) by a constant and a time trend (as, for example, in Grabowski & Vernon, 1992). The time trend will simply equate to generic age, and, hence, the coefficient
d0will pick up both the indirect impact of generic entry on sales via ln(Pt/PG) price and the direct impact as in Eq. (2) above. Hence, the actual regression equation we shall estimate is given by:
ln~St/SG!5a11b ln~AGEt/AGEG!1d0GAGEt1d1PpGAGEt1d2SpGAGEt
1d3SR1GAGEt1d4SR2GAGEt. (4)
3. The differing market environments in the four countries
Before a generic drug can be marketed, it needs to establish bioequivalence with a branded drug or, alternatively, engage in the same testing procedures as an original drug. If the generics’ firm can do the necessary tests and trialspriorto patent expiry, then generic entry should be more rapid than if they had to wait until after patent expiry. If in addition they can begin the appropriate registration procedures before patent expiry, then the lag will be shorter still. In the United States, the Waxman–Hatch Act gave this right to generic manufacturers. In Europe, the granting of SPCs that extend the patents of drugs in respect of delays in the initial registration process have also, since 1996, given the right to generic producers to conduct bioequivalence testsduring the period of patent extension, hence giving them rights that are similar to, although slightly fewer in number than, their American counterparts. However, prior to 1996, which is the period we shall be analyzing, they had no such rights. The situation in Japan is more confused. There are no such rights in Japan, although throughout much of the period we will be analyzing generic firms acted as if there were, which is reflected in the small lag between patent expiry and generic entry (see Table 2), which we shall shortly discuss. This paradoxical situation was highlighted by the March 1996 ruling by the Nagoya District Court that clinical testing of Synthelabo Groupe’s hydrochloric-tiapride medication prior to patent expiry did indeed constitute infringement of patent. Although this only confirmed earlier interpretations of the law, it has been followed by the filing of similar lawsuits by companies such as Glaxo and Bayer.
What will be the impact of these differences on the above model of generic entry? The impact of the Waxman–Hatch Act in the United States is not, as most commentators have implied, to facilitate earlier generic entry because the patent lives of the original brand will have been extended, and it may evendelaygeneric entry. Rather, the impact is to reduce the time gap between patent expiry and generic entry. This is important because the size of the market to the generic entrant is likely to be a function both of the age of the drug and the period since patent expiry, during which time marketing efforts by the originator may have been reduced in favor of other brands and the market may have declined as a consequence. Hence, for this reason the Waxman–Hatch Act should have the effect of encouraging generic entry. The impact of generic entry on the original brand also will tend to be greater in the United States because of the greater pressures on dispensers, noted above, to contain costs than in the other three countries. Hence, for both these reasons (i.e., the Waxman–Hatch Act and the prescribing environment) we would anticipate greater generic entry and a greater impact of this entry on original brand sales than in the other three countries.
4. The empirical findings
emphasis on larger products as opposed to smaller ones. The data relate to oral products, oral retard products, liquid products, and topical product forms and covers the period 1985–1996. The variables used in this study are defined in Table 1.
Table 2 shows the proportion of products with patent expiry that also saw generic entry. The United States sees the largest proportion of products, and the United Kingdom sees the smallest, clearly, even in the United States, generic entry following patent expiry is by no means universal. In order to test our initial hypotheses, we regressed generic entry on a constant, revenue sales and price at the time of patent expiry and the age of the original product (since its launch) using a binomial probit regression. Both sales and price are in real terms, i.e., they are deflated by the consumer price index. The sample excludes products where generic entry took place more than 12 months prior to patent expiry, as these were likely to relate to generic entry “condoned” by the originator. This might take the form of a “licensed generic” or a generic launched by the originator themselves to give them the advantage of being first into the generic market. Some “true” generics do appear prior to patent expiry with the generic company either risking prosecution or uncertain as to the exact date of generic entry. The database does not distinguish between these two types of generic drugs. The data also exclude instances where patent expiry occurred less than 5 years before the end of the sample period and no generic entry had occurred, as such products may well see generic entry in the future.
The results are shown in Table 3. The variable is coded as 1 if generic entry took place, and 0 if it did not. For three countries, sales are a significant factor in determining generic entry: at the 1% level of significance for Germany; at the 5% level for the United Kingdom; and at the 10% level for Japan. Although correctly signed, sales were insignificant for the United States. In
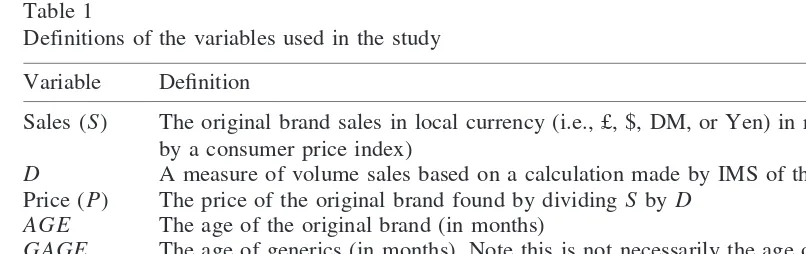
Table 1
Definitions of the variables used in the study
Variable Definition
Sales (S) The original brand sales in local currency (i.e., £, $, DM, or Yen) in real terms, (i.e., deflated by a consumer price index)
D A measure of volume sales based on a calculation made by IMS of the number of units sold Price (P) The price of the original brand found by dividingSbyD
AGE The age of the original brand (in months)
GAGE The age of generics (in months). Note this is not necessarily the age of a single generic but the number of months generics have been on the market
SR1 A binary variable taking a value of 1 if the product is an oral solid when a solid retard is also on the market
SR2 A binary variable taking a value of 1 if the product is an oral solid retard
Table 2
Characteristics of generic entrya
Characteristics United Kingdom United States Germany Japan
Proportion of generic entry (%) 37.3 70.4 56.8 65.1 Average lag of generic entry (yr) 2.58 2.57 3.40 1.26
none of the equations were either price or age significant. Hence, we can conclude that the major determinant of generic entry following patent expiry is the size of the market.
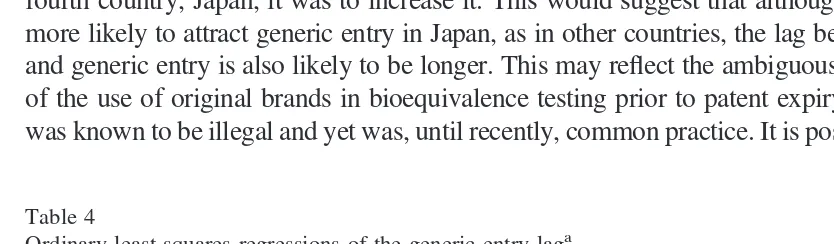
Table 4 shows the results of regressing the lag between patent expiry and generic entry for those products that saw generic entry on the same set of independent variables as in the previous regression. The coefficients on sales were significant at the 5% level for all four countries (and at the 1% level for the United Kingdom and Germany). Age was significant at the 10% level for Germany and Japan. In both cases, older products saw a greater generic entry lag. Price was significant only for Japan, and then with an unexpectedly positive coefficient. For three of the countries, the impact of increasing sales was, as expected, to reduce the lag length, but for the fourth country, Japan, it was to increase it. This would suggest that although larger markets are more likely to attract generic entry in Japan, as in other countries, the lag between patent expiry and generic entry is also likely to be longer. This may reflect the ambiguous state of the legality of the use of original brands in bioequivalence testing prior to patent expiry noted earlier. This was known to be illegal and yet was, until recently, common practice. It is possible that in making
Table 3
Probit regressions of the determinants of generic entrya
Regressions United Kingdom United States Germany Japan
Constant 21.805* 23.869 20.420 22.00
(1.92) (1.31) (0.47) (1.33)
Sales 0.000267** 0.000425 0.00013*** 0.0028*
(2.67) (1.41) (2.89) (1.82)
Price 0.772 3.535 0.0796 21.140
(0.30) (0.99) (0.68) (1.20)
Age 0.055 0.264 0.0481 0.150
(1.09) (1.31) (0.71) (1.58)
Log likelihood 215.60 26.88 233.64 29.46
Likelihood ratio 24.16*** 10.62*** 7.91*** 8.64***
n 40 33 63 25
* Significance at 10% level. **Significance at 5% level. ***Significance at 1% level.
aValues in parenthesis are
tstatistics.
Table 4
Ordinary least squares regressions of the generic entry laga
Regressions United Kingdom United States Germany Japan
Constant 36.63 57.49*** 25.29 242.46
(1.48) (3.68) (1.51) (1.10)
Sales 20.0070*** 20.000502** 20.00184*** 0.015**
(3.61) (2.12) (3.36) (2.41)
Price 22.760 21.20 20.026 61.71***
(0.56) (0.32) (0.08) (7.00)
Age 2.01 21.159 1.72* 5.19*
(1.26) (1.18) (1.75) (1.93)
R2 0.21 0.11 0.17 0.39
n 21 29 45 19
this decision generic firms took into account the likely reaction of the originator, calculating that the more profitable the drug is to them, the greater the likelihood of legal action with its associated costs and possible financial penalty. Japan apart, however, the entry lag is inversely related to market size, and this is the major factor in determining that lag.
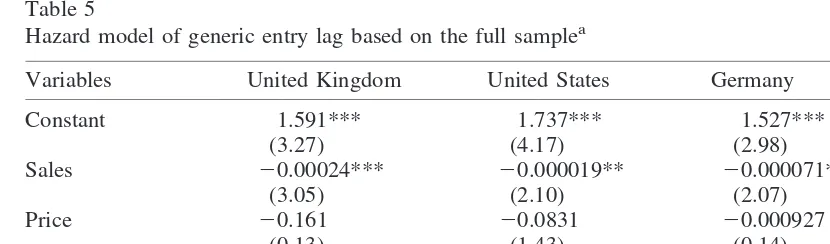
The regressions in Tables 3 and 4 suffer from potential bias because some products that have not yet seen generic entry may do so in the future, although this has partially been dealt with by restricting the sample to exclude products where both no generic entry has occurred and patent expiry was less than 5 years before the end of the sample. As an additional check, we estimate a set of hazard models where the dependent variable is the entry lag and the sample size extends to all the products, whether or not generic entry has occurred. This therefore combines in one regression the generic entry decision and the entry lag. We assume a log-linear survival function that is normally distributed (see Kalbfleisch & Prentice, 1980) and that gave, overall, a higher log likelihood than either the Weibull or exponential distributions, which are the main alternatives. The results are shown in Table 5 and largely confirm the combined results of the previous two tables. For the United Kingdom, the United States, and Germany, the coefficients on the sales of the original brand at patent expiry, representing market size, are all significant at the 5% level. No other variable is significant. For Japan, market size is insignificant, reflecting the conflicting impact of the two coefficients in Tables 3 and 4, whereby the probability of generic entry increases with market size, but the entry lag also increases.
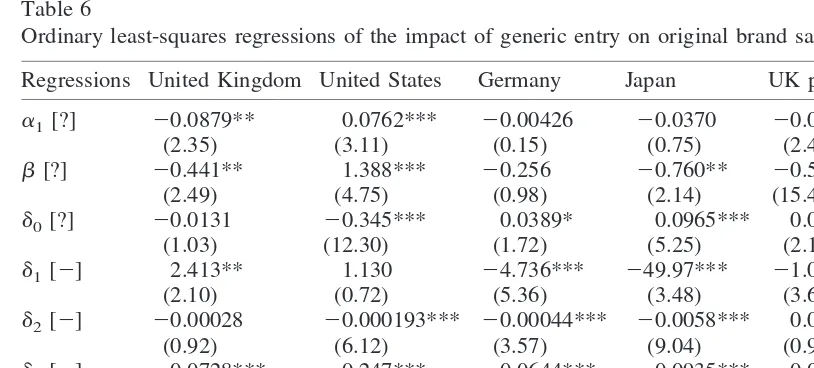
The final part of the study analyzes the impact of generic entry on original brand revenue. The results are shown in Table 6. For a product with average prices and sales at patent expiry, sales decline with generic entry. The impact of original brand price (d1) is significantly negative at the 1% level for Germany and Japan and significantly positive at the 5% level for the United Kingdom. Nothing can be directly inferred from the relative size of the coeffi-cients as both prices and sales are in local currency. The impact of the size of the market (d2) is significantly negative at the 1% level for the United States, Japan, and Germany and is negative but insignificant at the 10% level for the United Kingdom. The variations in the sign of d0, which is the constant term in the exponential expression in Eq. (1), partly reflect the variations ind1andd2, which are the other two parameters in this expression. Hence, the positive coefficient ford0for Japan is in part a reflection of the large negative coefficients on the other two
Table 5
Hazard model of generic entry lag based on the full samplea
Variables United Kingdom United States Germany Japan
Constant 1.591*** 1.737*** 1.527*** 0.895
(3.27) (4.17) (2.98) (1.18)
Sales 20.00024*** 20.000019** 20.000071** 20.000060
(3.05) (2.10) (2.07) (0.11)
Price 20.161 20.0831 20.000927 1.06
(0.13) (1.43) (0.14) (1.58)
Age 0.0390 20.0271 0.00931 0.019
(1.41) (0.88) (0.03) (0.35)
Log likelihood 241.82 239.43 272.84 228.32
n 53 40 70 26
variables.bis significantly negative for Japan and the United Kingdom (at the 5% level) but is significantly positive for the United States at the 1% level. This suggests that there is still growth potential in the US market at patent expiry, which is consistent with the linking by Hurwitz & Caves (1988) of age with market share. This may possibly be due to the larger and more heterogeneous nature of the US pharmaceutical market, either of which are attributes that may lead to a slower rate of product diffusion. The greater heterogeneity is partly a factor of size but also is related to the more reduced role for a state system compared with the other three countries. Finally, the dummy variable operative for oral solids when a solid retard is present (d3) is significantly negative at the 1% level for all four countries, and that for a solid retard (d4) is significant, and positive, at the 1% level for the United Kingdom and the United States but significantly negative, at the 5% level, for Germany. The latter results may possibly be linked to the system of “reference pricing” that was introduced in Germany in September 1989, which forced price reductions on certain off-patent drugs. The initial list of 10 drugs, which has subsequently been steadily extended, included five slow-release drugs, which is not surprising given that they tend to be more expensive than normal-release drugs.
To a considerable extent, these results confirm our initial expectations. The impact of generic entry on original brand sales is negative. In general, higher priced brands see a greater reduction in sales than lower priced ones following generic entry, which for Germany, Japan, and the United States is also true for market size. (It may also be true for the United Kingdom, but the coefficient, although negative, is insignificant at the 10% level.) Finally, sales decline more rapidly for oral solids when a solid retard is present, and, for the United States and the United Kingdom at least, solid retards see a smaller loss in sales. The overall impact ofd0,d1, andd2is, as we shall see later, that the impact of generics on original brand sales is greatest in the United
Table 6
Ordinary least-squares regressions of the impact of generic entry on original brand salesa
Regressions United Kingdom United States Germany Japan UK price UK volume
a1[?] 20.0879** 0.0762*** 20.00426 20.0370 20.0177** 20.0727**
(2.35) (3.11) (0.15) (0.75) (2.42) (2.10)
b[?] 20.441** 1.388*** 20.256 20.760** 20.578*** 0.139 (2.49) (4.75) (0.98) (2.14) (15.43) (0.90)
d0[?] 20.0131 20.345*** 0.0389* 0.0965*** 0.00645** 20.00711
(1.03) (12.30) (1.72) (5.25) (2.16) (0.62)
d1[2] 2.413** 1.130 24.736*** 249.97*** 21.023*** 3.508***
(2.10) (0.72) (5.36) (3.48) (3.64) (3.38)
d2[2] 20.00028 20.000193*** 20.00044*** 20.0058*** 0.000063*** 20.000334
(0.92) (6.12) (3.57) (9.04) (0.97) (1.29)
d3[2] 20.0728*** 20.247*** 20.0644*** 20.0935*** 20.000022 20.0723***
(3.71) (12.53) (4.41) (4.30) (0.01) (4.29)
d4[1] 0.0619*** 0.107*** 20.0475** 0.0206*** 0.0409***
(6.36) (5.39) (2.25) (4.01) (4.30)
n 321 303 457 169 321 321
R2 0.35 0.78 0.15 0.45 0.67 0.24
See Table 3 for explanation of symbols and values.
aThe dummy variable for oral solid retards in Japan was nonoperative. Symbols in brackets denote the expected
sign, if any, of the parameter. The equation is: ln(St/SG) 5 a1 1 b ln(AGEt/AGEG) 1 d0GAGEt 1
States. It is tempting to link this to the Waxman–Hatch Act, which, in allowing entry to the market nearer to the time of patent expiry, may have encouraged greater generic entry. But it is also possible that it is linked to the nature of the US system, which, as we saw in the Introduction, places greater responsibility on individuals meeting the cost of their drug care. They will, therefore, be less a factor in pushing for expensive drug treatment than in the other three countries where they are less likely to have to pay directly out of their own pockets. We will return to this and other issues in the concluding section. The one significant anomaly in the results concerns the United Kingdom, where it would appear that higher prices at patent expiry lead to slower deterioration in revenue for the original brand in contrast to both our expectations and the results for the other countries. In order to explore this further, we broke the revenue equation into its two component parts: price and volume. The results are shown in the final two columns of Table 6. The dependent variables are the ratio of original brand price to price at generic entry and the ratio of volume sales to those at generic entry. The price equation shows a largenegativecoefficient (significant at the 1% level) on price (d1) at patent expiry, suggesting that the larger the patent expiry price the greater is the scope for subsequent price cuts under generic competition. In the volume equation this is reversed, and we see apositivecoefficient, again significant at the 1% level. One possible explanation for this pattern of results is that on generic entry, significant price cuts, at least in real terms, are observed for high price brands. These price cuts stimulate volume sales to such an extent that, notwithstanding generic competition and the cut in price, we see revenue sales actually increase for these high-priced brands. The reason that this might happen in the United Kingdom rather than in the other three countries is that per capita spending is lowest in the United Kingdom, suggesting a greater degree of rationing, which is potentially inherent in all markets where the government is the major supplier, than in the other three countries.
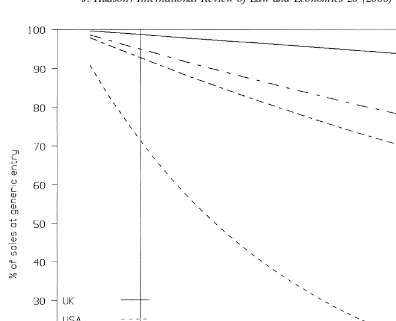
The estimated decline in original brand sales, in real terms as a percentage of sales at the time of generic entry is most rapid in the United States, where sales are just 70% of the total after 1 year of generic entry. The same figures for Japan, Germany, and the United Kingdom are 98%, 93%, and 98%, respectively. Fig. 1 shows the estimated impact of generic entry on high-revenue brands, i.e., those with twice the sample average for sales at patent expiry. Even for these, apart from the United States, the decline in original brand sales is not great. This could reflect low generic impact on the market. Alternatively, it could reflect the possibility that in these more regulated markets generic entry leads to a growth in the market and that generic sales, initially at least, come primarily from this growth, rather than from gaining sales from the original brand.
5. Postexpiry patent value
These results have implications for the literature on patent value. This calculates the value of the patent on the basis of benefits accrued during the patent’s lifetime. Thus, Schankerman (1998), for example, calculates it as
V5
O
t51
T*
bt~R
where Rtare the returns in period t from holding the patent, Ctis the patent renewal fee at
time t,bis a discount factor, and T* is the period when the patent expires. The summation is from the first year of the patent’s life to its expiry. However, our analysis indicates that the gains from holding a patent are likely to extend beyond the patent expiry date for three reasons. First, there is a probability (12p) that generics will not enter the market. Second, even if generic entry occurs, there is likely to be a lag between patent expiry and generic entry during which the full benefits of patent protection that are in effect continue. Third, even when generic entry occurs, the loss in market sales will not be immediate but will be spread over time, as Fig. 1 illustrates. Hence, to V in Eq. (5) we should add the three effects discussed above, which constitute PEPV, as in Eq. (6)
V5
O
t51
T*
bt~Rt2Ct!1~12p!
O
t5T*11
T*1N
bt~Rt2Ct!1p
O
t5T*11
T*1L21
bt~Rt2Ct!
1p
O
t5T*1L T*1N
bt~~R
t2Ct!dt!) (6)
wheredtis the proportion of sales retained by the original brand at time t, L is the number of periods after patent expiry when generic entry occurs, and N is the number of periods after patent expiry for which the firm plans to market the product. An estimate of these additional benefits without the discount factor can be calculated from our regression parameters of the equations in Tables 3, 4, and 6, which can be used to estimate L, p, anddtfor an original brand with average sales and prices in the relevant country and aged 12 years at patent expiry.
There are a number of problems that have to be resolved that primarily relate to estimating what sales would have been in the postexpiry period had no patent protection ever been given (Rb). The difference between this and actual sales in period t (whether prior to or after patent
expiry) then represents the gains from the patent. One approach is to approximate Rbby the
long-run level of sales after the patent has expired. This assumes that there are no long-run loyalty benefits or barriers to entry built up from having been the sole supplier during the period of patent protection. Hence, we do not take this option but instead assume that after 12 years (the period we will be assuming for patent expiry) original brand sales without patent protection and in the face of cheap generic competition would have been zero. This is clearly a lower bound and, hence, the estimated PEPV based on this is an upper bound. However, it should be noted that for the US market long-run sales after generic entry are close to zero, as can be seen from Fig. 1, and, hence, the two methods would give approximately the same answer. We shall, as is implicit in the above discussion, be focusing on revenue rather than profits as we have no direct data on costs.
A further problem occurs in deciding whether our measure of PEPV should be based on the market as it is expected to grow/decline or whether we should abstract from this. Clearly, other things being equal, the PEPV is likely to be greater in the United States, where, typically, the market appears to be still expanding at patent expiry, than in Japan, where market appears to be contracting. Nonetheless, in order to concentrate on the pure effect of patent expiry, the calculations reported in Table 7 will abstract from this and are based on the assumption that the market size stays at the level gained immediately prior to patent expiry. Finally, we need to assume a value for T*1N, the effective life of the product. This is difficult to estimate on the data available. Some products, particularly those that can move into the over-the-counter market, may have a lifespan measured in decades rather than years (e.g., aspirin). Others, where either the possibility of drugs becoming ineffective because of pathogenic reaction to them, as sometimes happens with antibiotics, or obsolescence due to the entry of more efficient products, will have a shorter life cycle. We will assume an effective lifespan of 22 years, i.e., in the calculations in Table 7 there are 10 full years following patent expiry. With the rapid decline in sales there is relatively little difference in
Table 7
Estimates of the value of post-expiry patent protectiona
Estimates United Kingdom United States Germay Japan
Average sales 3980 (2539) 2080 (1569) 3576 (2343) 3819 (2461) 25% of average 3990 (2554) 2309 (1706) 3709 (2409) 4018 (2557) 200% of average 3955 (2527) 1835 (1415) 3346 (2225) 3600 (2360)
aValues based on N510 years. Values are expressed as a percentage of sales in the quarter immediately prior
PEPV based on an effective lifespan of 22 years, 17 years, or 27 years in the United States, although there are large differences for the three other countries.
The results presented in Table 7 suggest that the advantages of patent protection, postex-piry, are similar in the United Kingdom, Germany, and Japan, but are very much smaller in the United States. This is primarily because of the rapid deterioration of sales following generic entry, but the higher probability of generic entry is also an important factor. Nonetheless, even here sales in the 40 quarters following patent expiry are estimated to total about 21 times the sales in the final quarter prior to patent expiry. On a discounted basis, assuming an annual discount rate of 10%, this reduces to 1569% of the pre-patent expiry sales. In all four countries, these continuing gains are greater for smaller products than for larger ones. If we were to allow the market to continue to change as reflected by the differing values for b, then the PEPVs would move closer together, but the United States would continue to have the smallest.
Of course, these are only thedirect benefitsof the patent. There also may be indirect ones. Zantac, the best selling antiulcer drug, established Glaxo as one of the major international pharmaceutical companies. The boost that this gave to the company’s brand image almost certainly increased sales of other products. In addition, following patent expiry Glaxo has launched Zantac on the over-the-counter market where brand image is a more important factor than in the prescription market.
6. Conclusions
The empirical research has given support and clarity to our initial speculations. First, both generic entry and the lag between patent expiry and generic entry are linked to the size of the market at patent expiry. Second, the speed with which the original brand loses revenue would appear to be directly proportional to both the size of the market and the price of the original brand prior to generic entry. The major exception to this would appear to be in the United Kingdom, but this is possibly explained by a powerful volume effectively responding to a cut in price following patent expiry. In addition, the United States sees a much greater impact on original brand sales of generic entry than do the other three countries, a feature that may be linked to the Waxman–Hatch Act, producing a more favorable regime for generic entrants than not only was the case in the United States before the Act, as others have concluded, but also when compared to other mature markets around the world.
great for this to be the only explanation. Second, there is a different market environment in the other three countries with there being little pressure on patients not to request expensive original brand name drugs and specific financial incentives for either pharmacists or doctors to dispense/prescribe branded drugs. In addition, in Germany the system of reference pricing, while potentially cutting the costs of branded drugs, may have hindered the development of the generics market. Hence, despite European generic companies being allowed since 1996 to use patented drugs for bioequivalence testing during the period when an SPC is valid, the impact on original brands post-SPC expiry may not be as great as might be imagined. In Japan, where there is no apparent intention to allow such use of patented drugs, and following a recent court decision to emphasize this, we can expect generics to continue to have a muted effect on original brand sales.
Our analysis complements rather than replicates previous research, but the results are consis-tent with those of Hurwitz & Caves (1988) and Ellison et al. (1997), which were noted earlier. The size of market loss following generic entry is large in the United States but is comparable with the estimates of Grabowski & Vernon (1992), although much smaller losses for the other countries put these findings in a new light. The results relating to the impact of oral solid retards also are consistent, at least for the United Kingdom and the United States, with the conclusions of Grabowski & Vernon (1992). Of course, it is seldom in any empirical analysis that all of the results are consistent with the theoretical predictions, but the major anomalies relating to the United Kingdom and Japan can be traced to market imperfections either in the form of rationing in the United Kingdom or in the somewhat ambiguous nature of the Japanese legal position regarding pre-expiry use of patented drugs in bioequivalence tests.
These results have implications for the effectiveness of patents in providing an adequate return to the innovating company. First, we see that the more successful a product is in terms of generating revenue to the original firm, the more likely it is to attract generic competition, and hence to lose sales, on patent expiry and the subsequent generic entry. This provides a safety device for the firm in that if its product is not very successful, it is less likely to meet generic competition and its revenue stream will be unaffected by patent expiry. If, however, it is successful, then generic attack is likely, but it should have earned large profits in the period up to patent expiry. The patent system therefore works as a risk-smoothing device where less successful products see profits being maintained for a longer time than more successful products.
With respect to the value of patents, the literature has tended to concentrate on the value of the patent during the period of patent protection (see Parr & Smith, 1994; Sullivan, 1994; Schankerman, 1998). Our analysis emphasizes the need to take account of the period after patent expiry. The firm will have used the period of patent protection to build up a position of market dominance. In the pharmaceutical market, patent expiry does not always lead to the entry of generics, and when it does, there is generally a lag of perhaps several years. Even then, following generic entry the firm will not lose all the sales it has built up immediately, but only over a period of time. Thus, the value of a patent extends beyond the actual period of patent protection. Similar comments apply to the literature on optimal patent width and breadth (e.g., Gilbert & Shapiro, 1990). Our results suggest that PEPV is smallest in the United States, but even there it is a sizable amount.
appear likely that our conclusions transpose to other industries where patent expiry sees entry by other large companies rather than by smaller generic companies. The entry lag may not be as great as in the pharmaceutical industry if only because there is unlikely to be a need to gain regulatory approval for the copy product, but the original firm is likely to retain a short-run marketing advantage from being the established presence in the market.
Acknowledgments
An earlier draft of this article was presented to a Conference on New Developments in Intellectual Property, St. Peters College, Oxford, UK, in March 1997. The author is grateful for the comments made at that conference as well as those made by Tina Lambert, Santanu Das, and an anonymous referee.
References
Caves, R. E., Whinston, M. D., & Hurwitz, M. A. (1991). Patent expiration, entry, and competition in the U.S. pharmaceutical industry.Brookings Papers on Economic Activity Microeconomics, 1— 48.
Ellison, S. F., Cockburn, I., Griliches, Z., & Hausman, J. (1997). Characteristics of demand for pharmaceutical products: an examination of four cephalosporins.Rand J Econ 28, 426 – 446.
Gilbert, R., & Shapiro, C. (1990). Optimal patent length and breadth.Rand J Econ 21, 106 –112.
Grabowski, H. G., & Vernon, J. M. (1992). Brand loyalty, entry and price competition in pharmaceuticals after the 1984 Drug Act.J Law Econ 35, 331–350.
Grabowski, H. G., & Vernon, J. M. (1996). Longer patents for increased generic competition in the US“
PharmacoEconomics 10, 110 –123.
Griliches, Z., & Cockburn, I. (1994). Generics and new goods in pharmaceutical price indexes.Am Econ Rev 84, 1213–1232.
Hansen, B., & Hill, C. (1994). Obtaining an SPC in Europe.Patents Licensing, 27–30.
Hurwitz, M. A., & Caves, R. E. (1988). Persuasion or information?: promotion and the shares of brand name and generic pharmaceuticals.J Law Econ 31, 299 –320.
IMS Pharma Strategy Group. (1997).Generic Insight.London: IMSWorld Publications.
Kalbfleisch, J., & Prentice, R. (1980).The Statistical Analysis of Failure Time Data.New York: John Wiley and Sons.
Manning, R. L. (1997). Products liability and prescription drug prices in Canada and the United States.J Law Econ 40, 203–243.
Parr, R. L., & Smith, G.V. (1994). Quantitative methods of valuing intellectual property. In M. Simensky & L. G. Bryer (Eds.),The New Role of Intellectual Property in Commercial Transactions(pp. 39 – 68). New York: John Wiley and Sons.
Schankerman, M. (1998). How valuable is patent protection? estimates by technology field.Rand J Econ 29, 77–107.
Schwartzman, D. (1976).Innovation in the Pharmaceutical Industry.Baltimore, MD: Johns Hopkins University Press.