Water Volume Detection System in Galon
using Arduino
Agustinus Noertjahyana
1, Denny Kuriando
2, Resmana Lim
31.2 Informatics Engineering Program Faculty of Industrial Technology Petra Christian University 3 Electrical Engineering Program Faculty of Industrial Technology Petra Christian University
Siwalankerto 121 - 131 Surabaya 60236 Tel. (031) - 2983455, Fax. (031) - 8417658
[email protected], [email protected]2 , [email protected]3
Abstract—Internet of things has a concept that aims to expand the benefits connected in a continuous internet connection on an ongoing basis. The method used by Internet of Things is automatic control without distance. Implementation currently gallon control of water is still done by looking at the state of gallons and then gallons turn when the water in the gallon is already empty. With the internet of things can be implemented a water volume detector that can monitor the state of the gallon from a distance through a smartphone. To make the manufacture of water volume detection required tools such as water flow sensors, microcontroller or other tools that are then connected to the internet.
For interaction relationship of water flow sensor, microcontroller, or other tool of help through internet used Android application. This Android application is used to facilitate users to access the internet anywhere. This Android application is made by using Android studio and microcontroller made with Arduino programming using C language. Microcontroller used is WeMos D1 R2 which has been contained ESP8266 in it.
The result of this water volume detection development is the microcontroller can transmit sensor data to the Ubidots server so that the application can retrieve sensor data on the Ubidots server. Users can view the gallon state in real time and are also given a notification when the gallon water volume is below alert level. Users can also view reports of gallons per month.
Keywords: Internet of things, Water volume detector, ESP8266 Microcontroller, Ubidots, Water flow sensor, Android.
1. INTRODUCTION
Internet of things has a concept that aims to expand the benefits connected in the internet connection on an ongoing basis. The method used by the Internet of Things is automatic control without distance. Implementation of the Internet of Things usually follow the developer's desire in developing an application he made.
The need for drinking water is needed by humans. Without drinking water must be the body feels weak, tired, lethargic, lackluster, and easy to tire even though not doing heavy activities. With the development of the era, many people are now turning to the use of gallons and dispensers as a storage and drinking water. Filling gallons is an activity that must be done when the contents of gallon water have run out. This is not separated from the habits of people who must see first run out or not the contents of water gallons.
The internet concept of things can be implemented in monitoring gallon content remotely and providing notifications on Android applications over the internet. In applying the internet of these things, the sensor tool used to
measure the volume of water that comes out must be able to communicate with Android smartphones. Currently only the implementation of the outflow water meter has been applied in article [2]. But for the technology of water volume detector can be monitored through the smartphone is still not applied in everyday life so there is no notice about the depletion of gallon water. With reference to the article [2], an Arduino-based gallon volume detection device that can be applied with an Android smartphone can monitor the volume of water per gallon from a distance and provide a notification when the volume of gallon water is lower than the minimum limit. This can be said to be a prototype in the future, this technology is expected to be useful for companies that have large numbers of employees such as factories, hospitals, offices, and others.
2. LITERATUREREVIEW 2.1. Internet of Things
The Internet of Things (IOT) is a concept and paradigm that considers absorbing presence in the environment of things through wireless and wired connections and unique addressing schemes can interact with each other and work with other things to create new applications / Services and achieve common goals. In this context research and development challenges to create a very large intelligent world. A world where real, digital and virtual get together to create a smart environment that makes energy, transportation, city and many other areas more intelligent.
2.2. Ubidots
2.3. Water Flow Sensor Module
Flow sensors are widely used for monitoring and control applications, to measure the flow of air or liquid. The water flow sensor consists of a plastic valve, a water rotor component, and a half-effect sensor. The pin wheel has a small magnet attached, and there is space-effect magnetic sensor on the other side of the plastic tube that can measure how many turns of a mill are done through a plastic wall. This method allows the sensor to remain safe and dry [2].
In this system can calculate the rotor flow surrounded by magnets along with the use of Hall Effect sensors. This is known as the G½ water flow sensor. The turbine that rotates on the resulting magnetic field and the result of the AC pulse will be converted into digital output with the help of Hall Effect sensor placed after the turbine. The number of pulses generated per liter can be calculated with the programming software. Thus, the pulse will produce a frequency output which is directly proportional to the volumetric flow rate / total flow rate through the meter.
2.4. Microcontroller and WiFi module ESP826
A microcontroller is a microprocessor that has additional parts that make it possible to organize or control other objects. Can be interpreted that the microcontroller run programs that have been made by the user and stored in memory. Microcontroller is a very useful tool that can help the designer to manipulate data obtained from input or output. Usually microcontroller is composed of microprocessor, memory and I / O. Microprocessor itself is composed of Central Processing Unit (CPU) and Control Unit (CU). CPU is the main brain that performs arithmetic and logic processes. While CU controls the operation of the microprocessor and sends signals to other parts of the microprocessor to perform instructions [3].
2.5. Arduino IDE
Arduino IDE is an open-source software that helps script creation or code and uploads scripts or code on board or microprocessor. Arduino IDE has an environment written in Java. The Arduino IDE also has a compiler for C or C ++ languages. Arduino IDE is intended to help create scripts or code for various boards or microprocessor [1].
3. DESIGN SYSTEM
3.1. Design of Volume Water Detector
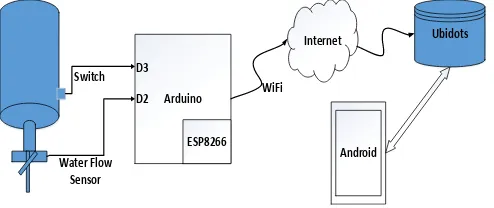
Figure 1 is an electrical circuit of a gallon water volume detector device in which this electrical circuit shows what electrical components are needed and how they are connected to other components. This circuit has 3 main components that have their respective functions - each. The main components are the WeMos D1 R2 microcontroller, water flow sensor, and switch. The additional components in the design are jumper and resistor cables.
Internet
Figure 1: Block Diagram System
3.2. Class Diagram
There is a class diagram described in this chapter that is a class diagram for SQLite. Figure 2 shows the class diagram for SQLite. There are 3 classes of user, gallon and gallon detail. Where in user class there are user id attribute, token and status. While in the gallon class there are ID Gallon, token, location name, description of location, ID flow, ID volume, ID datasource and alert level. While in the gall detail class there are attributes ID Detail of gallon, ID gallon, timestamp replace, less timestamp, water level which is the total flow of water out and last volume which is the last water volume total. Class user relates to the gallon class of one to many relations. The gallon class relates to the gall detail class of one to many relationships.
Galon display the home page as shown in Figure 3. This page will display all the gallon data in the SQLite database showing the condition of gallon water volume in the form of images. There are 2 buttons are the delete button to remove the gallon device and the "+" key for gallon device insert. And there is also a menu bar.
Figure 3: View Home and Menu Bar
4.2. Create Device
In the form, the user can fill in the location name, location description and alert level then press the insert data button, then the system will create a new variable that is Flow, Volume, and connection on Ubidots server then the system picks up each variable id then the system will store all Data form along with the variable id into the SQLite database. In the process of adding a gallon device the system will display the progress dialog as shown in Figure 5. After the data has been stored then the system will return to the home page as in figure 5.
Figure 4: Create Device View
Figure 5: Progress Dialog and Display After Insert Successful
4.3. View Update Device
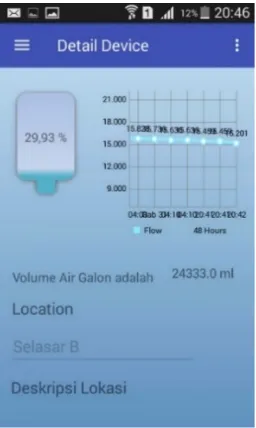
Users can also change existing gallon devices when needed by pressing the gallon images that are on the home page. When the user presses the gallon image, it displays the gallery detail form selected along with its value as shown in Figures 6 and 7. Then the user can change the location description and alert level then press update button.
4.4. Delete Device
Users can also remove a gallon device when it is no longer necessary by pressing the button next to the gallon image. The application will give alert dialog "Are you sure you want to delete this device?" As shown in Figure 8. Then
the system will request delete to the Ubidots server to remove the device according to the Datasource device ID.
Figure 6:Device Detail View
Figure 7:View After Device Update
Figure 8: Display Alert Delete Device
4.5. Alert Notification
will provide notification on the smartphone users and users can suppress the notification alert so that the application displays the gallon conditions as in figure 11 and 12. Notifications provided in the form of ringtones and vibrations. If the user does not change the setting of water level alerts at gallon details then the system gives notification for 2 minutes.
4.6. Gallon Replacement Test
Testing of this gallon turnover was done 2 times experiment. The first experiment is that the user presses the switch once only. In the first experiment, the gallon turns in the emphasis on the switch once experienced a hitch in the process of calculating the water flow. This is because the flow calculation process is not dismissed. The result is when the gallon of water is poured over the drinking water jar then the water flow is about the rotor in the water flow sensor so that the microcontroller will automatically calculate the water flow. The right solution in the second experiment is to push the switch button 2 times. For suppression of the first switch, the microcontroller will stop the flow calculation process. After the gallon of water has been replaced new, then the user press once again for the microcontroller will send a new water volume and run the flow calculation process.
Figure 9: Delete Progress Dialog and View After Delete Device
Figure 10: Notification View
Figure 11: Display After Pressing Notifications
4.7. View Report Usage Galon
When the user presses the usage gallon on the menu bar then the application will display the gallon usage report page as shown in Figure 13. This gallery usage report page has 2 charts of LineChart to display the conditions of gallons water depth and BarChart to display gallons per month.
Figure 12: Linechart and Barchart
4.8. Water Flow Sensor Accuracy Testing
Table 1
Comparison between Usage Volume and Sensor Reading Results Usage
Volume 1 Sensor Reading Results 2 3 4 5 1500 ml 1484.46 1502.24 1502.24 1497.79 1501.16
750 ml 762.22 755.32 752.4 750 750.8 330 ml 324.4 331.34 342.2 330.67 334.53
250 ml 260 250.79 240 251.12 253.33
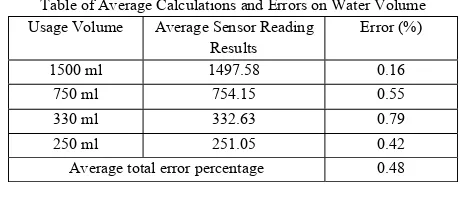
From the data obtained from table 1 this can be calculated average and the level of inequality in the form of percentage which can be seen in table 2.
Table 2
Table of Average Calculations and Errors on Water Volume Usage Volume Average Sensor Reading
Results Error (%)
1500 ml 1497.58 0.16
750 ml 754.15 0.55
330 ml 332.63 0.79
250 ml 251.05 0.42
Average total error percentage 0.48
5. CONCLUSION
From the results of the manufacture of water volume detector in the internet-based gallon of things by using Android and Arduino, can be drawn conclusions include:
Water flow sensor can communicate with microcontroller well and microcontroller can also send data to Ubidots server.
The Android app can monitor gallon states and can inform users via notifications when gallon water volume is below alert level.
Applications can allow users to find information such as monthly gallon replacement reports. Applications can display gallon state in real time. Based on the gallon replacement test the user must
press the switch button 2 times.
Based on the water flow rate accuracy test, the water flow sensor has a percentage error of 0.48%. Then the water flow sensor is feasible for use on the manufacture of water volume detector.
REFERENCES
[1] Arduino. 2015. Arduino - Environment. URI=https://www.arduino.cc/en/guide/environment
[2] Hosamani, R., & Bagade, R. 2015. Arduino based water billing system for domestic purpose. International journal of modern trends in engineering and research, 2(6), 424-432. [3] Ibrahim, D. 2002. Microcontroller based temperature
monitoring and control. Woburn: Biddles Ltd.
[4] Ubidots. 2016. REST API Reference. URI= https://ubidots.com/docs/api/#what-is-a-restful-api