Page
1
of 13
LAMPIRAN 1. PDRB Provinsi Babel berdasarkan lapangan usaha
Page
2
of 13
LAMPIRAN 2. Jumlah penduduk Provinsi Babel
Tahun Jumlah Penduduk (dalam ribu)
2006 1.090
2007 1.123
2008 1.156
2009 1.189
2010 1.223
2011 1.258
2012 1.287
2013 1.315
2014 1.344
2015 1.373
2016 1.402
Sumber : Prov Babel Dalam Angka 2008-2016 (BPS Prov Babel)
LAMPIRAN 3. Rasio Elektrifikasi Provinsi Babel
Tahun Rasio Elektrifikasi (%)
2006 48,24
2007 46,84
2008 46,20
2009 45,54
2010 44,29
2011 62,72
2012 72,76
2013 82,84
2014 91,98
2015 98,21
2016 99,78
Page
3
of 13
LAMPIRAN 4. Jumlah pelanggan PLN Provinsi Babel
Jumlah
Pelanggan Residential Commercial Public Industrial TOTAL
2006
LAMPIRAN 5. Konsumsi pemakaian energi listrik Provinsi Babel
Konsumsi Energi
Listrik (GWh) Residential Commercial Public Industrial TOTAL
Page
5
of 13
LAMPIRAN 8. Harga jual listrik PLN Provinsi Babel
Harga Jual Listrik
(Rp/kWh) Residential Commercial Public Industrial
2006 561,4 739,6 678,3 675,5
2007 555,1 728,0 655,7 677,6
2008 552,2 857,2 720,5 666,8
2009 548,8 951,2 709,8 661,9
2010 560,9 982,2 945,6 682,3
2011 649,2 1.018,3 846,8 828,8
2012 682,6 1.000,6 976,0 805,1
2013 752,0 1.127,3 1.106,3 869,6
2014 852,5 1.290,8 1.087,8 961,0
2015 932,1 1.315,8 1.173,2 1.133,1
2016 928,2 1.233,4 1.116,4 1.093,2
Sumber : PLN Bangka Belitung
LAMPIRAN 9. Kapasitas daya tersambung pelanggan PLN Provinsi Babel
Kapasitas Daya
Tersambung (MVA) Residential Commercial Public Industrial TOTAL
2006 104,0 21,6 11,1 10,2 146,8
2007 104,0 21,9 11,6 10,1 147,5
2008 104,3 22,3 13,7 10,2 150,5
2009 104,8 24,2 15,3 10,2 154,5
2010 119,6 34,6 17,7 10,2 182,1
2011 211,4 56,6 22,0 12,5 302,4
2012 259,9 68,4 30,0 17,7 375,9
2013 309,7 86,8 36,3 23,0 455,8
2014 347,2 96,0 40,8 27,8 511,8
2015 368,2 107,4 44,9 38,1 558,6
2016 391,1 122,1 49,1 51,5 613,8
Page
6
of 13
LAMPIRAN 10. Proyeksi pertumbuhan ekonomi atau PDRB Prov. Babel
1
2
3
4
5
6
7
8
9
Pertanian /
Agriculture
Pertambangan
& Penggalian
Industri Pengolahan
Listrik, Gas & Air
Bersih
Bangunan /
Construction
Perdangangan,
Hotel & Rest
Pengangkutan &
Komunikasi
Keuangan,
Sewa & Jasa
Jasa-Jasa /
Services
2017
3.654
1.807
2.935
98
1.203
3.149
633
640
1.299
15.418
2018
3.836
1.890
3.066
105
1.276
3.337
673
680
1.386
16.249
2019
4.050
1.988
3.221
114
1.361
3.555
719
727
1.486
17.220
2020
4.292
2.099
3.395
124
1.456
3.801
771
779
1.598
18.316
2021
4.547
2.215
3.579
134
1.558
4.064
827
835
1.719
19.479
2022
4.816
2.337
3.771
146
1.667
4.344
887
895
1.849
20.712
2023
5.101
2.466
3.973
158
1.783
4.642
951
958
1.987
22.018
2024
5.401
2.600
4.184
171
1.906
4.959
1.019
1.027
2.136
23.403
2025
5.717
2.742
4.405
186
2.038
5.297
1.092
1.099
2.295
24.870
2026
6.049
2.889
4.635
201
2.177
5.655
1.169
1.176
2.463
26.416
PDRB LAPANGAN
USAHA (miliar Rp)
Total PDRB
(ADHK 2000)
LAMPIRAN 11. Proyeksi penduduk dan rumah tangga Prov. Babel
Tahun Jumlah Penduduk
(dalam ribu) Jumlah Rumah Tangga
2017 1.431 364
2018 1.460 371
2019 1.489 379
2020 1.518 386
2021 1.546 393
2022 1.575 400
2023 1.603 408
2024 1.630 415
2025 1.658 422
2026 1.684 428
Page
7
of 13
LAMPIRAN 12. Target rasio elektrifikasi Prov. Babel
Tahun RE PLN (%) RE TOTAL (%)
2017 99,78 99,97
2018 99,78 99,97
2019 99,79 100,00
2020 99,79 100,00
2021 99,80 100,00
2022 99,80 100,00
2023 99,80 100,00
2024 99,80 100,00
2025 99,84 100,00
2026 99,84 100,00
LAMPIRAN 13. Uji koefisien proyeksi jumlah pelanggan Prov. Babel
JumlahPelanggan Ringkasan
Rumah tangga Definition;
P%(2006-2016/30,15/-9,18/,53) NRES=REPLN/100*RT
Komersil
LS: R,978; AR,972; DW1,07; F155;
DF7(p5%R,89/F3,48/t2,36)
LN(NCOM)=-30,474(-13.4)+ 2,6141(17,6)*LN(PDRBC)- 0,031209(-0,186)*LN(GPDRB)
Publik
LS: R,983; AR,979; DW1,33; F207;
DF7(p5%R,89/F3,48/t2,36)
LN(NPUB)=-9,549(- 10.4)+1,3545(20,3)*LN(PDRBP)-0,20542(-2,27)*LN(GPDRB)
Industri
LS: R,947; AR,934; DW1,61; F71;
DF8(p5%R,86/F3,19/t2,31)
Page
8
of 13
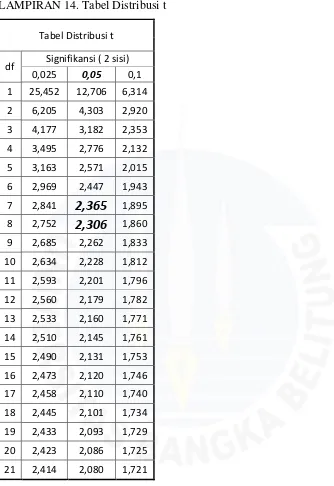
LAMPIRAN 14. Tabel Distribusi t
Tabel Distribusi t
df
Signifikansi ( 2 sisi)
0,025
0,05
0,1
1
25,452
12,706
6,314
2
6,205
4,303
2,920
3
4,177
3,182
2,353
4
3,495
2,776
2,132
5
3,163
2,571
2,015
6
2,969
2,447
1,943
7
2,841
2,365
1,895
8
2,752
2,306
1,860
9
2,685
2,262
1,833
10
2,634
2,228
1,812
11
2,593
2,201
1,796
12
2,560
2,179
1,782
13
2,533
2,160
1,771
14
2,510
2,145
1,761
15
2,490
2,131
1,753
16
2,473
2,120
1,746
17
2,458
2,110
1,740
18
2,445
2,101
1,734
19
2,433
2,093
1,729
20
2,423
2,086
1,725
Page
9
of 13
LAMPIRAN 15. Prakiraan jumlah pelanggan Prov. Babel
JumlahPelanggan Residential Commercial Public Industrial TOTAL
2017 363.149 25.498 10.234 314 399.196
2018 370.523 29.654 10.993 342 411.513
2019 377.872 34.959 11.827 373 425.031
2020 385.195 41.661 12.890 407 440.154
2021 392.467 49.722 14.237 444 456.871
2022 399.664 59.308 15.719 485 475.176
2023 406.783 70.702 17.347 531 495.363
2024 413.827 84.236 19.135 581 517.779
2025 420.888 100.303 21.100 636 542.927
2026 427.730 119.288 23.272 697 570.987
LAMPIRAN 16. Uji koefisien proyeksi daya tersambung Prov. Babel
DayaTersambung (MVA)
Ringkasan
Rumah tangga
LS: R,997; AR,996; DW1,45; F891;
DF7(p5%R,89/F3,48/t2,36)
LN(PRES)=-11,557(-3.54)+0,074699(0,27)* LN(PDRBR)+1,2766(12,1)*LN(NRES)+ 0,090149(3,25)*DUM.2011.2012
Komersil
LS: R,995; AR,994; DW1,29; F760;
DF8(p5%R,86/F3,19/t2,31)
PCOM=-42,914(-3.58)+0,000013005(2,68)* PDRBC+0,0044855(6,4)*NCOM
Publik
LS: R,992; AR,991; DW1,2; F522;
DF8(p5%R,86/F3,19/t2,31)
LN(PPUB)=-17,8(-7.82)+0,96455(3,03)* LN(PDRBP)+0,89816(3,59)*LN(NPUB)
Industri
LS: R,979; AR,974; DW1,65; F185;
DF8(p5%R,86/F3,19/t2,31)
Page
10
of 13
LAMPIRAN 17. Prakiraan daya tersambung Prov. Babel
Daya Tersambung(MVA) Residential Commercial Public Industrial TOTAL
2017 397,9 144,6 54,8 55,0 652,4
2018 409,9 167,7 62,2 61,0 700,8
2019 422,1 196,6 71,0 67,5 757,3
2020 434,6 232,5 82,4 74,7 824,2
2021 447,1 274,8 96,6 82,7 901,3
2022 459,7 324,4 113,3 91,6 989,0
2023 472,4 382,6 132,7 101,4 1.089,1
2024 485,0 450,8 155,3 112,3 1.203,5
2025 497,9 530,9 181,7 124,5 1.335,0
2026 510,5 624,5 212,5 137,9 1.485,5
LAMPIRAN 18. Uji koefisien proyeksi konsumsi energi listrik Prov. Babel
PenjualanTenaga Listrik (GWh)
Ringkasan
Rumah tangga
LS: R,995; AR,994; DW2,46; F509;
DF7(p5%R,89/F3,48/t2,38)
SRES=-203,58(-2.21)+0,000043279(4,54)*
PDRBR-0,077(-0,639)*TRES+0,70844(3,26)* PRES
Komersil
LS: R,991; AR,988; DW1,74; F267;
DF7(p5%R,89/F3,48/t2,38)
LN(SCOM)=-30,815(-4.12)+2,5263(4,01)*
LN(PDRBC)-0,45715(-1,43)*
LN(TCOM)+0,01282(0,0906)*LN(PCOM)
Publik
LS: R,995; AR,993; DW1,14; F472;
DF7(p5%R,89/F3,48/t2,38)
SPUB=-10,957(-4.15)+0,000046448(4,28)* PDRBP-0,0106(-1,51)*
TPUB+0,0033134(3,53)*NPUB
Industri
LS: R,994; AR,991; DW1,25; F385;
DF7(p5%R,89/F3,48/t2,38)
Page
11
of 13
LAMPIRAN 19. Prakiraan konsumsi energi listrik Prov. Babel
PenjualanTenaga Listrik (GWh)
Residential Commercial Public Industrial TOTAL
2017 671,7 189,6 75,5 76,0 1.012,8
2018 713,5 216,9 85,3 85,4 1.101,1
2019 761,5 251,6 96,4 96,1 1.205,6
2020 815,0 294,6 108,9 108,2 1.326,7
2021 871,3 344,8 123,0 121,3 1.460,4
2022 930,6 403,3 138,9 135,6 1.608,4
2023 993,1 471,4 156,8 151,1 1.772,4
2024 1.058,8 550,7 177,0 168,0 1.954,6
2025 1.128,1 643,1 199,8 186,4 2.157,4
2026 1.200,5 749,8 225,5 206,4 2.382,3
LAMPIRAN 20. Prakiraan produksi energi listrik per sistem Prov. Babel
Produksi EnergiListrik (GWh)
Sistem Pulau Bangka
Sistem Pulau Belitung
Prov. Bangka Belitung
2017 907 248 1.155
2018 985 270 1.255
2019 1.078 295 1.373
2020 1.185 325 1.510
2021 1.304 357 1.661
2022 1.435 393 1.828
2023 1.580 433 2.013
2024 1.742 477 2.219
2025 1.921 526 2.447
Page
12
of 13
LAMPIRAN 21. Prakiraan beban puncak per sistem Prov. Babel
Beban Puncak(MW)
Sistem Pulau Bangka
Sistem Pulau Belitung
Prov. Bangka Belitung
2017
149,2 40,9 190,0
2018
162,1 44,4 206,4
2019
177,3 48,6 225,9
2020
194,9 53,4 248,3
2021
214,4 58,7 273,1
2022
235,9 64,6 300,6
2023
259,8 71,2 330,9
2024
286,3 78,4 364,7
2025
315,7 86,5 402,2
2026