www.elsevier.com/locate/utilpol
A few things transport regulators should know about risk and the
cost of capital
Ian Alexander
a, Antonio Estache
b,*, Adele Oliveri
caWorld Bank 1818 H Street, NW Washington, DC 20433, USA
bUniversite Libre de Bruxelles, World Bank & ECARES, J3 143 Brussels, Belgium cfrontier economics, 150 Holburn London EC1N 2NS, UK
Received 10 May 1999; received in revised form 22 May 2000; accepted 27 June 2000
Abstract
In reviewing contracts, establishing price limits, or arbitrating conflicts, regulatory agencies and policy advisors face significant information asymmetry in determining the appropriate allowed rate of return, or discount rate. The information gap is especially important in determining the degree of market risk—often a critical component of the cost of capital demanded by operators.
Alexander, Estache, and Oliveri consider various methodological problems in the transport sector in establishing the link between regulatory regime and degree of market risk.
The results of quantitative studies confirm that even for the transport sector—where there is intermodal competition and where contracts are often shorter and regulatory decisions may be less pressing than for utilities—the choice of regulatory regime greatly affects the degree of market risk a company faces. This has important implications for regulatory agencies and actions.
When a regulatory agency undertakes a price review, or when issues arise about concession contracts, it is important that regulators assess correctly the required rate of return and cost of capital. They must also assess correctly the level of risk, which affects the required rate of return and the cost of capital.
Most regulators in developing countries have a problem: the regulated companies are unquoted or undertake many activities for a range of industries and even sectors. For them this methodology for measuring the cost of capital, calculating the measure of market risk, and estimating the impact of various regulatory regimes on market risk may be useful. 2001 Elsevier Science Ltd. All rights reserved.
Keywords: Regulation; Transport; Cost of capital
1. Introduction
Information on the link between the degree of market risk and the regulatory regime type is important to regu-lators of privatized utilities with strong residual mon-opoly powers. It allows a better understanding of what drives the main concerns of the regulated companies and in particular it quantifies these concerns. This is important not only for assessing the rate of return demanded by bidders for projects but to determine the level of profits for a project or company at the time prices have to be reviewed by the regulators as a part of a normal review or as part of a conflict resolution
* Corresponding author. Tel.:+202-458-1442; fax:+202-676-9874.
E-mail address: [email protected] (A. Estache).
0957-1787/01/$ - see front matter2001 Elsevier Science Ltd. All rights reserved. PII: S 0 9 5 7 - 1 7 8 7 ( 0 0 ) 0 0 0 0 6 - 0
process.1 Establishing the right level of forecasted,
allowed, profits is difficult and can easily lead to a situ-ation where either the company:
O will not want to invest, if too low a level of return
1 Although the need for price regulation is less in the transport
has been allowed as a result of a underestimation of the level of risk; or
O will either over-invest and/or make abnormal profits if too high a level of return has been allowed.
This paper considers the issue of market risk and regulat-ory regimes from the view point of transport sector regu-lators. It builds on an initial study undertaken by Alex-ander, Mayer and Weeds in 1995, which established a methodology for measuring market risk and also con-sidered a way in which regulatory regimes could be evaluated for utilities. The methodology followed to measure risk in the sector is summarized in Section 2. This section also considers a series of additional issues, some of which arise from the problems raised by the transport sector and others associated with expanding the analysis applied to the measure of market risk. Section 3 then presents the key quantitative results of the paper. Section 4 considers the link between the type of regulat-ory regime and the level of market risk while Section 5 concludes.
2. How to measure risk?
There are three areas where grasping the methodology and its constraints is important. They are:
O the measurement of the cost of capital;
O the calculation of the measure of market risk; and
O the estimation of the impact of alternative regulatory regimes on the measure of market risk.
2.1. Measuring the cost of capital
Before measuring risk, the first step is to agree on a benchmark that is comparable across firms and across sectors to which these risk measures will apply. The cost of capital is the most common benchmark used in developed countries by companies and regulators alike. Although the definition of the cost of capital is itself a challenging task that has generated a lot of literature, the key issue for many developing countries is to get it done somehow. Indeed, the regulators need to get a good handle on the costs as it drives the most common meth-odologies used to assess the market risks as perceived by operators and investors.
The standard approach adopted by regulatory agencies and governments is to use the weighted average cost of capital (WACC). Formally, WACC can be estimated by:
components of a price control, including the cost of capital, are avail-able from the Office of the Regulator General website—www.reg-gen.vic.gov.au. So, price reviews and other forms of behavioral regu-lation may be necessary for the transport sector.
WACC5[(12g)3re]1[g3rd]
where:
g is the level of gearing or leverage in a company, i.e. the proportion of debt in the total capital structure (i.e. debt+equity);2
rd is the cost of debt finance. This is simply
meas-ured as risk free rate, rf, plus a debt premium
over this rate, pd. The premium is either
meas-ured directly from the yield of a company’s bond or through comparator information— yields on new bonds are listed in the Financial Times at the date of issuance and are available from commercial information sources on a daily basis; and
re is the cost of equity finance. Its estimation raises
bigger problems, and yet for privatized infra-structure monopolies, it is quite important since access to debt finance can be quite restricted for many privatization projects in developing coun-tries.
The most serious challenge at this stage is to assess the cost of equity. One of the common approaches adopted to measuring the cost of equity is the Capital Asset Pricing Model (CAPM). This estimates the cost of equity as:
re5rf1be(rm2rf)
where:
re is the cost of equity finance;
rf is the risk-free return;
be is the equity beta;
rm is the level of market return; and
rm2rf is the market risk premium.
Establishing the values for each of these items is rela-tively straight-forward when developed capital markets exist and companies are quoted on a stock exchange. Approximations have to be used in most less-developed countries.
2.1.1. The risk-free rate (rf)
The risk-free rate of return is a benchmark figure against which all investments in an economy should be measured. Being risk-free requires the removal, or mini-mization, of repayment risk. Owing to the ability of a government to raise finance through taxation, govern-ment bonds are normally taken as the base value for the
2 Throughout the report gearing will be used to mean either gearing
calculation.3 For a regulator in a developing country
looking at what its concessionaire may be considering as a risk free rate, a good proxy may be to look at the US or UK interest rate on a Treasury Bond, for instance, rather than at local rates unless their government’s bonds are quoted in US dollars and the government is widely believed to repay all current and future debts.
2.1.2. The equity risk premium (rm2rf)
The second standard measure in the estimation relates to the level of additional return that is required to per-suade investors to hold equities in preference to the risk free instrument. There is much controversy surrounding the calculation of this element—recent UK regulatory experience has focused on figures between 4 and 6% while some parts of traditional finance theory suggest orders of magnitude of, at most, 2%. An alternative is to measure the historical spread between the yield on a government security and that of a general market index. In the US, this could be the spread between the yield on a 1 year Treasury Bill and the returns on the 500 Stan-dard & Poor index. Evidence has suggested that figures between 8 and 10% are found when this approach is adopted, both in the US and the UK. This may reflect a world-wide premium, to which a country specific pre-mium may have to be added. However, determining an exact figure from this premium is impossible and so range should be employed. For most countries, using between 5 and 8% should establish a credible set of boundaries.
2.1.3. The equity beta (be)
The final, and only company specific, element to be established is that of the equity beta. This measures the relative riskiness of the company’s equity compared to the market as a whole. To accurately measure the equity beta it is normal to use at least three years worth of daily share price information and preferably five years worth—especially if monthly data is used.4Since many
of the projects that will be considered for privatization in less developed countries will be provided either by unquoted companies or international firms, it will not be possible to establish a specific beta value for the project from the available information. The next section is con-cerned with estimating this value when sufficient infor-mation is not available.5
3 A further complication is offered through the existence of inflation
risk. A few governments have issued index-linked bonds that minimise the inflation risk. However, the vast majority of governments only issue nominal bonds and so inflation risk exists.
4 There is a large academic literature on the subject of how the beta
value should be measured. This is surveyed in an annex to Alexander et al. (1996).
5 For a more general discussion of the techniques described here see
Alexander, 1995, OXERA or Industry Commission, 1996 (Australia).
2.2. Measures of market risk
Although the CAPM is based around the use of the equity beta as described above, when determining the appropriate allowed rate of return it is important to start from the basic building block of an asset beta since this allows:
O an evaluation of the impact of different gearing lev-els; and
O a comparison of underlying risk across companies.
While the theory underlying beta calculations is now increasingly well understood among regulators, the prac-tical needs of the estimation of a beta value are not yet that well appreciated among regulatory practitioners. The broad steps are:
1. establish an equity beta value;
2. determine the level of gearing for the company; and 3. establish an asset beta value.
It is this third step that regulators should be most inter-ested in since the asset beta captures the business risks faced by the company that cannot be removed through portfolio diversification by investors and are not related to the choice of financial structure for the company. These three steps are explained in more detail below.
2.2.1. Establishing an equity beta This involves:
O collecting daily share price information from the last five years, or if more recently floated, since the flo-tation date;
O collecting values for the appropriate market index for each company;
O estimating the daily returns for the company and the index through the simple calculation of the percentage change in share price for each day;
O removing all non-trading days, i.e. bank holidays etc. when no trades occur across the whole market; and
O regressing the daily returns for the company against the daily index returns to estimate beta from the fol-lowing equation.
Ri5a1bRm
where Ri is the return on the company and Rmis the
return on the market.
Beta values should be calculated on the basis of:
day after flotation—so that any initial underpricing is removed);6 and
O a value on a year-by-year basis.
In both cases it is important that the standard error of the beta value is also recorded. In some cases, multi-utility companies exist. These raise some issues relating to the estimation of the beta values that are discussed later.
There are arguments to include dividend payments in the calculation. Evidence suggests that the impact is small and the data requirements are high.7 However, it
would be useful to check this when looking at any spe-cific market. Further, some background information on the style and operation of the market should be included. For example, does a market maker system exist? This can have an impact on the certainty with which estimates can be treated.
2.2.2. Calculating gearing(UK)/leveraging(US)
The second step involves calculating the level of net gearing that a company has. This is a reflection of the financial structure of the company and, as such, is used to change the equity beta into an asset beta (discussed below). Net gearing is defined as:
g5 Net debt
Net debt+market value of equity
where:
Net debt=Interest bearing debt2cash and short term securities
The net debt figure should be estimated from the book value information from the accounts.8 Ideally, the net
gearing figure should be calculated for every year that is included in the equity beta calculation. This allows
6 If it is possible that an over-allotment of shares occurred, it is
important that the beta value calculation starts once the over-allotment period is completed. Flotations based on over-allotments have been common in the US for a long time and are starting to become more common elsewhere.
7 Practical investigations show that the impact of including
divid-ends does not have a significant impact on the beta estimate. To include dividends information is needed on the ex-dividend date, the tax treat-ment of dividends (i.e. whether they should be included as gross or net) etc. When including dividends the holding period return used should be stated as:
rt5
(Pt+Dt−Pt−1) Pt−1
Here, P is the share price of the company and D the dividend.
8 A net rather than gross value of gearing is used because a
regu-lator should be interested in the financing of productive assets. A com-pany can easily change its gross level of gearing by borrowing and then investing the proceeds in short-term financial instruments. If a management chooses to do this, customers should not face higher prices because of it.
both an average over the period and an end point gearing figure to be used in the calculations explained below. This is important if companies are undergoing rapid changes in their financial structures, as has been seen in the UK over the last two years. If possible, it would also be useful to know the national gearing level, or at least the average gearing of all quoted companies, since this may have an impact on changes in relative financial structure, which is a practical area that has not been explored closely by academia.
2.2.3. Estimating the asset beta
Once we have the equity beta and the net gearing it is possible to establish an estimate of the asset beta. This is done by using the following formula:
ba5be3(12g)
Where ba is the asset beta and be, the equity beta.
So, if the net gearing was 50% and the equity beta was 1, the asset beta would be 0.5. This is a simplification of the overall relationship. Some doubts have been raised with respect to the assumption of a zero debt beta and it may be worth investigating the impact of non-zero debt betas in examples where the companies are highly geared, or the financial markets are likely to place a high premium on the company owing to the perceived general riskiness of the company. This could be a very important issue in the less developed countries or where high levels of debt have been employed in project financing deals.
2.2.4. Does this approach over or underestimate risks?
Recent work has raised some questions relating to the simplified model adopted in the majority of countries regarding the relationship between the equity and asset betas.9 Traditionally, the approach set out earlier in this
section is used. This is based on:
ba5be3(12g)
The alternative approach can be defined as:
ba5h be
1+D/E[1−(1−g)t]j
Here, D/E is an alternative measure of the level of gearing, the standard measure set out earlier would be D/(D+E).gis the proportion of shareholders that are eli-gible for imputation tax credits and t is the corporate tax
9 The recent gas arbitration in Victoria provides a good example of
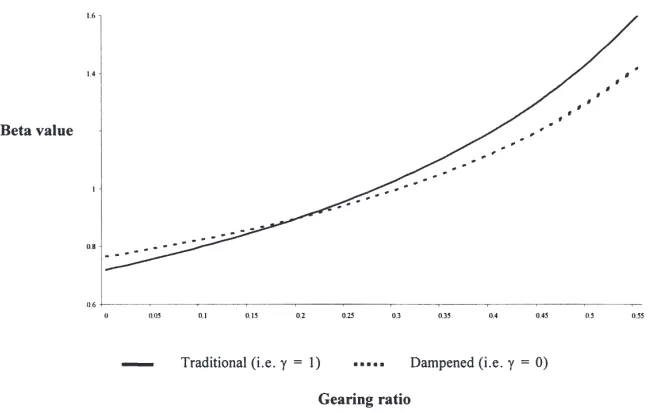
Fig. 1. The impact of the alternative appraoch to estimating the asset and equity betas.
rate.10 This approach is based on attributing an impact
on the riskiness of the company both to the financial structure of the company and the way in which it inter-acts with the tax system.
Whether this approach is right or wrong is an issue that will not be discussed here. The practical implication, however, is to dampen the relationship between the equ-ity and asset betas. Fig. 1 illustrates this relationship in the extreme examples of g=1 (the traditional formula applied in the initial paper and set out earlier in this paper) and g=0 (referred to as ‘dampened’ in Fig. 1 above). The estimates of the equity betas are based on an observed equity beta of 0.9 for 20% gearing as defined here, as D/(D+E), or 25% if defined as D/E. A corporate tax rate of 30% has also been assumed. For any level of gearing lower than that underlying the observed equity beta, the traditional approach underesti-mates the risks as the equity beta estimated that is lower than that provided under this alternative approach. Simi-larly, for any level of gearing that is higher than the observed value, the traditional approach overestimate
10The difference between an imputation and classical system of
tax-ation of dividends is linked to the treatment of personal taxes. A classi-cal system is based on dividends being paid out of post-tax earnings (i.e. once corporate tax has been paid) and then the individual being taxed at their marginal personal income tax rate on those dividends. An imputation system is based on some, or all, the personal income tax payable on the dividends being offset against the corporate tax paid. So, if the imputation tax rate is set at the basic rate of income tax, a basic rate tax-payer receiving dividends would have no tax to pay.
the risk i.e. it will produce an estimate of the equity beta that is higher than this alternative approach.11
2.3. Assessment of regulatory systems: criteria usually used
Although the beta estimates are useful by themselves, being able to link the beta values to a definition of the regulatory regime provides an important tool for policy makers and regulators throughout the world. To be able to place the beta values into the context of the regulatory regime it is necessary to establish the structure and detail of the regime. Given the scope of the sectors and the relative uniformity of regulatory approaches, it is gener-ally possible to establish a simple classification process. Three categories of regulatory regime are generally identified:
O high-powered regimes—these are regimes where sig-nificant incentives for companies to reduce costs are established through CPI-X type regimes (price-caps, revenue-caps etc.);
O medium-powered regimes—these regimes involve
11From a practical perspective it is not possible to apply the
some incentivisation of companies, but normally through hybrid schemes and less explicit regulatory regimes; and
O low-powered regimes—these are basically the stan-dard rate-of-return type approaches to regulation.
When determining the type of regulatory regime that is in place there are a range of areas to consider. These areas include both institutional and economic aspects. Key elements to include are:
O If an incentive based regime, how long is the period between the price reviews?
O How is investment treated?
O How much discretion is the regulator allowed at each review? And
O What are the characteristics of the regulatory office?
2.4. Additional details to be addressed
As has been noted earlier, transport raises a series of additional issues that require further analysis. These include the problems associated with the multiple coun-try and sector operations of some companies, and the desire to investigate the relationship between the charac-teristics of the regime and the industry structure with the beta value. This paper focuses on the former issue since it is of great significance to many regulators, while the latter issue will be the focus of future research.
2.4.1. Disaggregation of beta values
Many of the companies considered in the paper have either multiple operations (for example, bus franchises in many areas and/or countries). Further, many of the services provided by the companies in the transport sec-tor, especially in relation to road based transport, are municipal in nature owing to the lack of significant infra-structure. This means that contracts often lead to the pro-vision of services by either:
O small, local companies that are not quoted on a stock market; or
O large, national and international quoted companies that hold several contracts.
The diversity of players explains why contract types dif-fer a lot. This creates a problem as difdif-ferences between contracts can lead to an averaging effect since the observable measure of market risk is an average of the market risk inherent in each of the contracts. Also, many of the contracts are short-term, generally between three
and five-years.12Since the standard approach to
estimat-ing the measure of market risk requires five years worth of information, this may mean that the contract is held for only part of the estimation period. Consequently, greater emphasis may have to be placed on shorter time periods, although that raises a concern about the stability of the estimates:
O business activities are quite heterogeneous: for example, common groupings include mining and rail interests or bus services and property. The diversity of transport company types is also an issue. There is a mixture of companies that focus on specific industries while others have a much broader nature. Infratil in Australia covers both energy and airports, Stagecoach in the UK does bus and all rail. This often leads, to having to establish additional categories, such as inte-grated transport. The main issue here is that the sector specific risk is hard to assess. On the other hand, it recognizes that the market and the operators are find-ing ways to pool business to reduce the average risk level; and
O the geographic coverage of the companies also matter. While not as open as some utility industries, there is a tendency for transport companies to have an inter-national exposure. If there are differences in the regu-latory regimes across countries, then the estimate of the measure of market risk is an average of the exposures in each of the countries. For some countries it is not even possible to establish precise measures of risk since all the companies operating in a particular industry in that country are either unquoted or are foreign subsidiaries. Examples of this problem can be seen in Latin and Central America. Kansas City Southern Industries, an American company, is responsible for rail operations both in America and in Mexico. Further, none of the Mexican rail companies are directly quoted on a stock market. Burlington Northern, another US rail company, was a part of the consortium that was involved in the privatization of New Zealand’s rail industry and has been active else-where in the world, including Argentina. Finally, Bra-zil established seven rail concessions with a require-ment for six of them to be floated on the local stock markets, but so far only two have done so and both are unavailable for use in a project like this owing to the fact that one of them is listed on a small private closed exchange and the other has been floated for
12An example is the way in which the UK unbundled its rail
much less than the five years necessary to establish a reliable estimate of market risk.
Because of this, the equity and asset betas found for the quoted companies should be treated as average betas reflecting the mixture of individual business betas, where a business is either a distinct activity or a separate geo-graphic area. While the majority of the analysis under-taken in this paper is concerned with the company beta, since it is the observable element, there is also a desire to establish specific business and geographic betas. This is because much of the analysis on performance for a regulatory regime requires a benchmark of a business specific beta value. Further, much of the regulatory pro-cess for establishing a price control requires an analysis of the market’s perception of the risk associated with that activity.
In that context, two key issues have to be considered:
O How should a beta value be disaggregated? And
O Which value of gearing to employ?
2.4.1.1. How to disaggregate? As mentioned above,
the group beta value can be considered as a weighted average of the individual company beta values. This can be defined as:
This is where: beis the equity beta (it could be replaced
by ba the asset beta) in the formula;
G relates to the group beta;
i is the individual business or geographic unit where there are n such units; and
ai is the weight associated with each such busi-ness unit.
The weights are based on the net assets employed in each business, as a proportion of the total net assets of the group. So:
ai5 NAi
O
n i51NAi
When actually calculating the proportions, it is normal to ensure that the net assets for all the businesses add up to 1. If the group net assets, rather than the sum of the business unit net assets, is used there is a high prob-ability that the sum of weights will be less than 1, owing to the impact of unassigned assets, headquarters assets
etc. To remove this problem, it is simplest to assume that the sum of the individual business units is the group net asset value.
2.4.1.2. Which leverage to use? A further issue that
must be investigated is whether this approach should be adopted using the company’s average gearing ratio for each of the business units, or the business units’ industry average level of gearing. By assuming that all business activities have the same gearing ratio as the company average is a strong assumption to impose on the business unit. For example, if a company is composed of two business units operating in diverse activities, such as financial services and rail operations, it is an extremely strong assumption to make that each of the business units has the same gearing as the company average. If all other companies in that business activity have a very different level of gearing to the average for the multi-business company, then the values established for the individual beta values are likely to be out-of-line with investor per-ceptions of risk. Consequently, when disaggregating a company beta it is preferable to rely on the gearing ratios specific to those individual business activities. This is most easily achieved by using the equity betas for the comparator business activities since they embody the industry average gearing.13
There may be one case where the assumption of the business unit having the same gearing as the average for that industry could be called into doubt. This relates to the situation when a business is operating in a separate geographic area. If foreign owned companies are treated differently than domestic companies with respect to tax-ation, especially for repatriation of profits in the form of dividends, then the capital structures of domestically and foreign owned companies are likely to differ. However, there are three reasons why this should be noted but not acted on. They are:
O regulation is interested in the issue of a stand-alone business—if ownership is taken into account then, as exchange rates, interest rates and tax regimes change, the regulatory body will be effectively promoting changes in ownership to achieve the lowest cost of capital. This is an issue best left to the management of the companies;
O most regulatory systems make a range of simplifying assumptions, especially regarding tax, which mean that this level of sophistication is never reached; and
13When using comparators to disaggregate the beta value the
O it is difficult to establish the tax positions of all the countries involved in the study and, as such, it is bet-ter to leave them on a consistent but uncorrected basis.
This approach does not, however, completely remove the need for trying to establish the company’s gearing ratio in each business, since it would be preferable to establish an asset beta for the foreign assets of companies involved in the study. Provided that there is only one ‘unknown’ it should be possible, through the use of com-parator gearing levels, to determine an estimate of the asset beta for the unknown business.
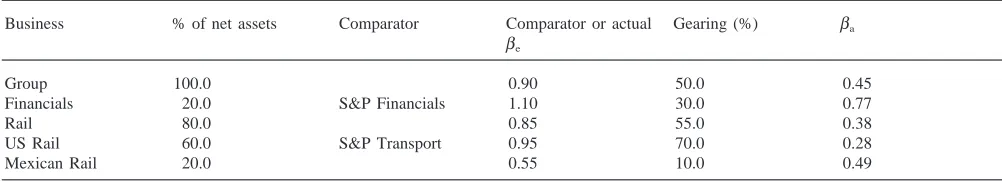
To illustrate the approach suggested, consider the case of Kansas City Southern Industries (KCSI), a rail busi-ness in the US. This company undertakes two main activities, rail services and financial services, with the former undertaken in the US and Mexico while the latter is only undertaken in the US. This section illustrates how an estimate of the asset beta for the Mexican rail busi-ness could be derived. The numbers used here are illustrative. Table 1 sets out the data used in this example.
From the information above, it is possible to establish values for the rail and Mexican rail businesses. For example, the combined rail business will have an equity beta value determined by:
Similarly, with a proxy for the US Rail equity beta, it is then possible to determine the estimate of the Mexican Rail equity beta. Further, given the information on KCSI’s capital structure and the proxy values for gearing for financial services and US rail, an asset beta can be
Table 1
Illustrative data for the business within KCSI
Business % of net Comparator Comparator Gearing (%)
assets or actualbe
Group 100.0 0.90 50.0
Financials 20.0 S&P 1.10 30.0 Financials
Rail 80.0
US Rail 60.0 S&P 0.95 70.0
Transport Mexican 20.0
Rail
estimated for the Mexican rail business. These results are set out in Table 2.
From this example it is possible to estimate an asset beta for the Mexican rail system. The fact that it is higher than the US rail asset beta could be due to:
O Mexico having a regulatory system that places greater risk on the operating companies through the establish-ment of greater incentives; or
O a difference in the exposure to market risk owing to greater risk in the industries that use the rail system to transport freight in Mexico compared to the US.
3. Estimates of sector specific risks across regions
The transport sector covers a wide range of industries. Table 3 provides a summary of the industries and indus-try segments covered by the paper.14 In total, 15
coun-tries were included in the study, including 71 compa-nies.15The average number of companies per country is
4.25, although there is one extreme example of a country with 21 companies and six cases where a country has only one company in the sample. The country with 21 companies is Japan, which has 21 private rail companies. A complete list of the companies involved in the study is provided in Appendix A. In some cases, there are companies that could not be included in the study owing to a lack of information. For example, Auckland Inter-national Airport has been privatized and floated on the New Zealand Stock Market, but this took place in 1998 and so only very limited information is available. Hence it has not been included in the study, although it should be considered in any future update of this project. With this data base, the paper adopts:
O beta values based on data covering at least one year, and where possible, five years worth of data to Sep-tember 1998;
O a gearing value based on the market value of equity and the book value of net debt;
O the latest year-end gearing value; and
O the traditional approach to de-gearing equity beta values to establish the asset betas.
14As with all regulated industries, government has an option of
establishing an industry structure that Iimits the need for conduct or behavioural regulation. Transport, owing to the multi-modal issues raised, may be a sector where it is easier to establish a structure that needs only limited conduct regulation.
15The actual coverage of countries is, however, much higher. For
Table 2
Illustrative data for the business within KCSI
Business % of net assets Comparator Comparator or actual Gearing (%) ba be
Group 100.0 0.90 50.0 0.45
Financials 20.0 S&P Financials 1.10 30.0 0.77
Rail 80.0 0.85 55.0 0.38
US Rail 60.0 S&P Transport 0.95 70.0 0.28
Mexican Rail 20.0 0.55 10.0 0.49
Table 3
Industries included in this project
Industry Sub-industries Number Number of of companies countries
Rail Rail infrastructure 1 1
Rail services 6 34
Road Toll roads 6 11
Bus Services 2 4
Integrated Road, rail and air 1 4
Air Airport infrastructure 5 5
Ports Port infrastructure 2 6
Other infrastructure Tunnel and bridges 4 6
Tables 4 and 5 present the average beta, equity and asset respectively, for each industry within each conti-nent. It also provides an indication of the number of companies over which the beta value has been aver-aged. The beta values were calculated over a five year period to September 1998.16 As seen from Appendix
A, there were 71 companies involved in the calculation of equity betas and 64 for asset betas. This difference arises because of the lack of accounting data for some companies.
Table 4 suggests that looking at the risk levels for equity investors, this is on average not a very risky sec-tor. There is of course a selection bias since the compa-nies picked up by our data base are compacompa-nies already in the stock markets and since the deals covered actually took place they were by definition less risky than many of those than have not yet taken place—and there are many of those since commitments are significantly larger than disbursements in the sector. Across regions, Oce-ania appears to be the least risky region (essentially
16For some companies a shorter period had to be utilised since they
have not been listed for five years. In those cases, a minimum require-ment was to have one year’s worth of daily data.
Australia). America is the riskiest region to a large extent because the sample covers many of the Latin American railways deals which have subject to many shocks over the last three to four years and the US and Canadian deals are not ‘unrisky’ enough to offset the high risk in Latin American projects Across sectors, airport is the riskiest sector, while ports is the least risky pure sector. Once the gearing is taken into account, the average risk level of the sector decreases further and quite sig-nificantly for most sectors. In fact, it decreases for all sectors, except for buses as a result of various aspects of the companies covered by the Asia sample, for example significant net cash balances and regulatory regimes that discouraged borrowing. The interesting change in com-parison to the pure equity risk is that once the possibility of debt financing is taken into account, rail becomes the least risky sector.
The average figures summarized here hide some issues identified during the calculation that required further study. They include:
O the impact of significant net cash balances for some
companies. Clear examples of companies that have a positive net cash balance, and so an asset beta that is greater than the equity beta, include Vienna Airport and some companies operating in Hong Kong (including buses); and
O the impact of market structure and inter-modal
com-petition. For example, although US rail regulation has traditionally focused on a rate of return approach, the market structure is such that the exposure to inter-modal competition for freight traffic (passengers are handled by a separate company) leads to a beta value closer to 1 than would have been expected.
Table 4
Summary of equity betas by region and sector
Region Airports Roads Rail Ports Buses Othera All
Europe 0.74504 0.58267 0.43184 0.38516 0.582421
Asia 0.90892 0.480121 0.82781 0.66644 0.69643 0.564031
Oceania 0.76681 0.51572 0.57951 0.49445 0.71181 0.556210
America 0.90479 0.90479
All 0.74945 0.629811 0.586635 0.55006 0.66644 0.511110 0.595571
aOthers are mostly integrated transport (Europe) and tunnels (Asia).
Table 5
Summary of asset betas by region and sector
Region Airports Roads Rail Ports Buses Other All
Europe 0.58774 0.44395 0.52332 0.24215 0.426716
Asia 0.47702 0.248020 0.39591 0.77694 0.79883 0.393830
Oceania 0.70861 0.30732 0.43631 0.42325 0.43069
America 0.67739 0.67739
All 0.61185 0.42099 0.391832 0.41866 0.77694 0.45088 0.447164
various time intervals (daily, monthly and quarterly) and focus on the more consistent estimates. In the case where a negative value persisted after the investigation explained above, the company was excluded from the sample.
4. Impact of regulatory regime on the sector specific risk
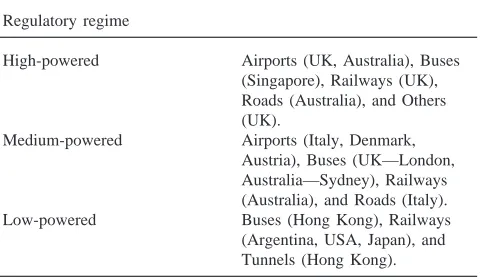
This section links the assessment of the characteristics of the regulatory regimes to the asset beta values. Table 6 provides a summary of the assessment of regulatory regimes and industry structure for those countries and sec-tors where sufficient information was available17(Table 7).
Table 6
Summary of regulatory regimes Regulatory regime
High-powered Airports (UK, Australia), Buses (Singapore), Railways (UK), Roads (Australia), and Others (UK).
Medium-powered Airports (Italy, Denmark, Austria), Buses (UK—London, Australia—Sydney), Railways (Australia), and Roads (Italy). Low-powered Buses (Hong Kong), Railways (Argentina, USA, Japan), and Tunnels (Hong Kong).
17In a desire to ensure that as many companies as possible are
included in the analysis some subjective decisions have been taken. The raw data is provided in the annexes to an earlier version of the paper, available from the authors, and so re-estimation based on alter-native interpretations of the subjective information is possible.
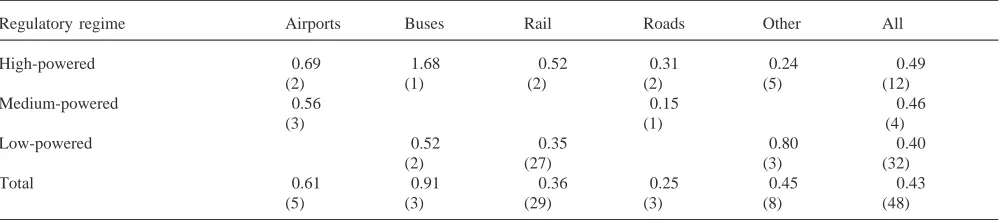
Taking this allocation into account, it is possible to establish the relationship between the degree of incen-tives contained within the regulatory regime and the measure of market risk for that industry. Overall, it has been possible to place 48 of the 64 observations within a clear regulatory regime although, there had to be some subjective decisions. This table shows that, in general, the relationship established in the original paper also holds true for the transport industries. However, as men-tioned earlier, for some of the industries the exposure to inter-modal competition or other factors leads to a breakdown in the relationship. Rail is a good example of this where the regulation and market risk relationship holds for the UK and Japan, but does not hold for the US companies, although the averaging presented in the summary table masks this result to a certain extent.18
Further, there is a much wider dispersion between industries within the transport sector than what may have been expected. Possible explanations for this include:
O the impact of inter-modal competition. For some industries, such as the bus or freight–rail industries, there are clear and credible alternatives which may have low or negligible switching costs associated with them;
O the heightened exposure of some industries to market risk owing to the importance of general macroecon-omic conditions to the demand for services such as freight or business travel; and
O the impact of the choice of short-term contract based regulatory systems.
Table 7
Summary of asset betas by sector and regulatory regime
Regulatory regime Airports Buses Rail Roads Other All
High-powered 0.69 1.68 0.52 0.31 0.24 0.49
(2) (1) (2) (2) (5) (12)
Medium-powered 0.56 0.15 0.46
(3) (1) (4)
Low-powered 0.52 0.35 0.80 0.40
(2) (27) (3) (32)
Total 0.61 0.91 0.36 0.25 0.45 0.43
(5) (3) (29) (3) (8) (48)
Of the industries presented above, only one requires further explanation. ‘Other’ has been used as a catch-all and is dominated by two types of company—European integrated transport companies and Asian Tunnel oper-ators. This divergence in type of company means that no meaningful conclusions can be drawn from that col-umn—although it is included for completeness.
When making comparisons it is advisable to use both the industry specific information and the totals:
O the industry specific figures allow for the capture of the specific business risks but suffers from the prob-lem that the sample is often small and frequently only covers two of the three regulatory regimes; and
O the total figures are based on a wider sample of com-panies and includes examples of all forms of regulat-ory regime. However, it also represents an averaging of the specific business risks that appear to differ sig-nificantly between industries.19
5. Conclusions
Regulatory agencies and policy advisers face signifi-cant information asymmetry when determining what the appropriate allowed rate of return, or discount rate, should be when reviewing contracts, establishing price limits at a price review or arbitrating conflicts. This issue is especially important when determining the degree of market risk often a critical component in influencing the cost of capital demanded by operators.
This paper has considered the various methodological questions raised in the transport sector when establishing this link between the degree of market risk and regulat-ory regime. The quantitative results confirm that even for the transport sector, where intermodal competition exists, contracts are often shorter than for utilities and
19A simple model of transport asset betas that includes both type
of regime and industry as explanatory variables shows that the industry effects dominate. Further information on this issue is available from the authors.
regulatory decisions may be less pressing than for util-ities, the choice of regulatory regime still has a signifi-cant impact on the degree of market risk faced by a com-pany. This has important implications for regulatory agencies and their actions.
Most specifically, when a price review is undertaken or when issues arise in the context of a concession con-tract, it is important that the right level of required rate of return/cost of capital be assessed by the regulators. This required rate of return/cost of capital level will be influenced by the risk level which must also be assessed by the regulators. Most regulators in developing coun-tries face a scenario where the regulated companies are unquoted or undertake a wide range of activities across a range of industries and even sectors. In such situations, the results of this study provide a useful starting point for the necessary analysis. In addition, this study also sets out a methodology that could be used to expand the study or focus it on a set of comparators with the greatest relevance to an ongoing review.
Acknowledgements
We are grateful to Philip Burns, Javier Campos, Rich-ard Green, K. Gwilliam and John Strong for useful com-ments and suggestions. Any remaining mistakes are ours. An earlier version of the paper appeared in the World Bank Policy Research Working Paper series num-ber 2151. The views expressed in this paper are also ours and do not reflect the views of the institutions to which we are affiliated.
Appendix A
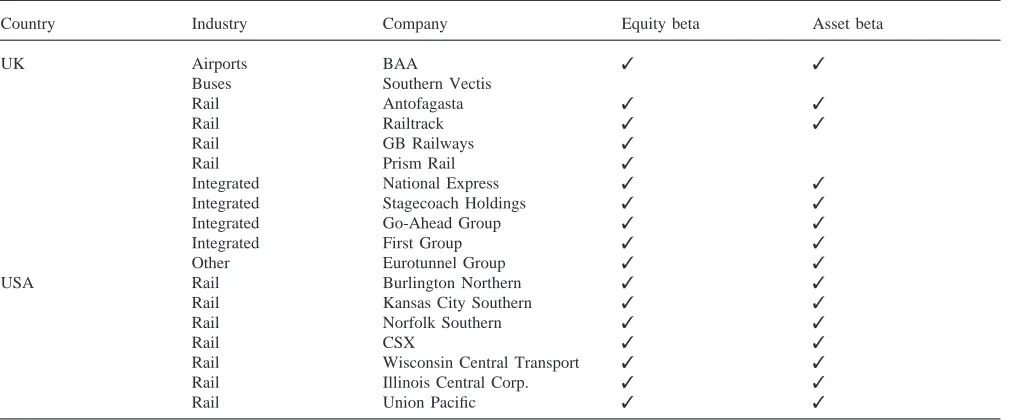
Table 8
Companies involved in the study
Country Industry Company Equity beta Asset beta
Australia Airports Infratil Australia ✓ ✓
Roads Hill Motorway Grp ✓ ✓
Roads Transurban ✓ ✓
Austria Airports Vienna Airport ✓ ✓
Canada Rail Canadian National ✓ ✓
Rail Candian Pacific ✓ ✓
Denmark Airports Copenhagen Airport ✓ ✓
Hong Kong Buses Citybus ✓ ✓
Buses Kowloon Motorbus ✓ ✓
Roads Roadking ✓ ✓
Other Hong Kong Ferry ✓ ✓
Other Crossharbour Tunnel ✓ ✓
Other New World Infrastructure ✓ ✓
Italy Airports Rome Airport ✓ ✓
Roads Autosrada Torino-Milan ✓ ✓
Roads Autostrada PV ✓
Japan Rail East Japan Railway ✓ ✓
Rail West Japan Railway ✓ ✓
Rail Central Japan Railway ✓ ✓
Rail Fukuyama Transport ✓ ✓
Rail Hanshin Electric R/way ✓ ✓
Rail Izyhakone R/way ✓ ✓
Rail Keihan Electric R/way ✓ ✓
Rail Keihin Elec.Express ✓ ✓
Rail Keio Electric R/way Co. ✓ ✓
Rail Keisei Electric R/way ✓ ✓
Rail Kinki Nippon R/way ✓ ✓
Rail Kobe Electric R/way ✓
Rail Nagoya Railroad ✓ ✓
Rail Nankai Electric R/way ✓ ✓
Rail Nippon Express ✓ ✓
Rail Nishi-Nippon Railroad ✓ ✓
Rail Odakyu Electric R/way ✓ ✓
Rail Sagami R/way ✓ ✓
Rail Seibu R/way ✓ ✓
Rail Tobu R/way ✓ ✓
Rail Tokyu ✓ ✓
New Zealand Rail TranzRail Holdings ✓ ✓
Ports Lyttelton Port Co. ✓ ✓
Ports Northland Port Corp. ✓ ✓
Ports Ports of Auckland ✓ ✓
Ports Port of Tauranga ✓ ✓
Ports South Port New Zeal. ✓ ✓
Others Infratil International ✓
Philippines Ports International Container Terminal ✓ ✓
Services
Portugal Roads Brisa Autoestradas priv. ✓ ✓
Singapore Buses Singapore Bus Company ✓ ✓
Buses Delgro Group ✓ ✓
Spain Roads Europistas ✓
Roads Iberpistas ✓ ✓
Roads Aumar ✓ ✓
Roads Acesa ✓ ✓
Other Essa ✓
Thailand Roads Bangkok Expressway ✓ ✓
Table 8 (continued)
Country Industry Company Equity beta Asset beta
UK Airports BAA ✓ ✓
Buses Southern Vectis
Rail Antofagasta ✓ ✓
Rail Railtrack ✓ ✓
Rail GB Railways ✓
Rail Prism Rail ✓
Integrated National Express ✓ ✓
Integrated Stagecoach Holdings ✓ ✓
Integrated Go-Ahead Group ✓ ✓
Integrated First Group ✓ ✓
Other Eurotunnel Group ✓ ✓
USA Rail Burlington Northern ✓ ✓
Rail Kansas City Southern ✓ ✓
Rail Norfolk Southern ✓ ✓
Rail CSX ✓ ✓
Rail Wisconsin Central Transport ✓ ✓
Rail Illinois Central Corp. ✓ ✓
Rail Union Pacific ✓ ✓
References
Alexander, I., 1995. Cost of Capital: The Application of Financial Models to State Aid. OXERA.
Alexander, I., Mayer, C., Weeds, H., 1996. Regulatory structure and risk and infrastructure firms: an international comparison. Policy Research Working Paper 1698, World Bank, Washington, DC. Davis, K., 1998. The weighted average cost of capital for the gas
industry. Available from the Office of the Regulator General (Victoria, Australia) web-site.
Industry Commission, 1996. An economic framework for assessing the financia1 performance of Government Trading Enterprises. Government of Australia.