Electronic copy available at: https://ssrn.com/abstract=2979300 1
Country level corruption and accounting choice: research & development capitalisation under IFRS
Francesco Mazzi
Richard Slack
Ioannis Tsalavoutas*
Fanis Tsoligkas
June 2017
Acknowledgements
We gratefully acknowledge helpful comments received from Paul André, Andreas Kreß, Stergios Leventis, Darren Duxbury, Christian Stadler, Ian Tonks and the participants of the EUFIN Workshop (Fribourg, September 2016), BAFA Scottish Area Group Conference (Glasgow, August 2016) and Financial Reporting and Business Communication Conference FRBC (Bristol, July 2016) and seminar participants at the University of Bath (November, 2016), HEC Lausanne (February, 2017), Newcastle Business School (March, 2017), and 40th Annual EAA Conference (Valencia, May 2017).
*Corresponding author.
Francesco Mazzi is at the University of Florence (Economics and Management School, Accounting and Finance Division, Via delle Pangette 9, Building D6, 50127, Florence, Italy, E-mail: [email protected]).
Richard Slack is at Durham University (Durham University Business School, Durham University Business School, Queen's Campus, H115, Wolfson Building, University Boulevard, Thornaby, Stockton on Tees, TS17 6BH, England, UK. E-mail: [email protected]).
Ioannis Tsalavoutas is at the University of Glasgow (Adam Smith Business School, West Quadrangle, Main Building, Room G683, University Avenue, Glasgow, G12 8QQ, Scotland, UK. E-mail: [email protected]).
Electronic copy available at: https://ssrn.com/abstract=2979300 2
Country level corruption and accounting choice: research & development capitalisation under IFRS
Abstract
We examine the influence of country-level corruption on the capitalisation of development
costs. IAS 38 mandates that development costs must be capitalised if specified conditions are
met. However, this requires judgement and hence may be subject to managerial opportunism
resulting in over-capitalisation. We find that there is a positive relation between
country-level corruption and the amount of development costs capitalised. Moreover, the higher the
levels of corruption, the lower the contribution of capitalised development costs to future
profitability. Further, we find that the amount capitalised and its contribution to future
profitability is influenced by domestic corruption only for less international firms.
Keywords: R&D; IFRS; corruption; accounting choice; future performance; internationalisation.
3 1. Introduction
There is ongoing debate as to whether International Financial Reporting Standards (IFRS)
adoption necessarily improves accounting quality through a uniform framework for
accounting and reporting across countries, or if due to specific country characteristics,
disparity remains an issue (Ball, 2006; Ball, Robin, & Wu, 2003; Lehman, 2005; Nobes,
2006; Weetman, 2006). In this context, Houqe, Monem, Tareq, and van Zijl (2016) positively
argue that mandatory adoption of IFRS improves earnings quality in adopting countries as
inter alia IFRS are designed to reduce managerial discretion to manage or smooth earnings
(and see Ball, 2006; Shah, Liang, & Akbar, 2013). In contrast, ‘the inherent flexibility in
principles-based standards could provide greater opportunity for firms to manage earnings’
(Barth, Landsman, & Lang, 2008, p. 468).
One specific area of contention within IFRS in this regard is the treatment of research and
development (hereafter R&D) costs. IAS 38 Intangible Assets clearly sets out a number of
conditions under which development costs are to be capitalised. Arguably, by imposing
restrictive conditions, the discretion involved in R&D capitalisation is reduced (Markarian,
Pozza, & Prencipe, 2008; Matolcsy & Wyatt, 2006). Thus, one would expect that, after the
mandatory adoption of IFRS, only development expenditures from those R&D projects,
which are highly likely to be successful, are capitalised. However, as the application of these
conditions requires managers to exercise their judgment over proprietary and subjective
information, R&D capitalisation under IAS 38 still remains open to managerial discretion and
hence the reliability of such information can be questioned (Cazavan-Jeny, Jeanjean, & Joos,
2011; Dinh, Kang, & Schultze, 2015).
Because of the judgement involved, it follows that the potential discretionary treatment of
4
signalling effect conveying the future earnings’ power of the business associated with the
level of capitalisation. In these cases, ‘…investors perceive the capitalisation of R&D to be
related to successful R&D projects’ (Shah et al., 2013, p. 168). Second, consistent with
earnings management, a managerial opportunism manifested through a positive impact on
current earnings and possible earnings benchmark beating (Dinh et al., 2015), when costs are
capitalised and not expensed (Ahmed & Falk, 2006; Cazavan-Jeny & Jeanjean, 2006;
Cazavan-Jeny et al., 2011; Ciftci, 2010; Dinh et al., 2015). In these cases, managers provide a
noisy signal with regards to the future benefits associated with the R&D costs capitalised.
In this study, we examine the potential influence of corruption as a country characteristic
which may be associated with the accounting treatment of R&D, specifically development
costs, under IFRS. Corruption is commonly defined as the ‘abuse of entrusted power for
private gain’ (Transparency International, 2009, p. 7). Where corruption is prevalent,
business cheating and scandals are merely one manifestation of a much broader and more
insidious acceptance of corruption within society (Zuckerman, 2006, cited in Ashforth, Gioia,
Robinson, and Trevino (2008)). Effectively, in such settings, corruption is collectively
‘normalized (Ashforth & Anand, 2003) because it leads to a gradual erosion of moral agency
over time (Ashforth et al., 2008; Brief, Buttram, & Dukerich, 2001; Fleming &
Zyglidopoulos, 2008). Thus, as put forward by Ashforth and Anand (2003, p. 8), ‘once a
corrupt decision or act produces a positive outcome and is included in organizational
memory, it is likely to be used again in the future’ and this is not perceived as unacceptable.
Hence, in such environments, based on the rational expectation of a profit-maximising agent
(Kimbro, 2002), some managers use this non-market mechanism to improve their well-being
through exercising excess discretion (Hamir, 1999) to achieve income maximisation , over
5
Drawing upon this reasoning, prior empirical research has indeed shown that quality of
accounting is susceptible to the level of country-level corruption (Doupnik, 2008; Fan, Guan,
Li, & Yang, 2014; Han, Kang, Salter, & Yoo, 2008; Nabar & Boonlert-U-Thai, 2007; Picur,
2004). This is evident via a negative relationship between levels of corruption and
information transparency (DiRienzo et al., 2007), presence of big four auditors and perceived
levels of accounting and audit quality amongst business people (Malagueño, Albrecht, Ainge,
& Stephens, 2010), compliance with mandatory disclosures (e.g., about goodwill as examined
by Mazzi, Tsalavoutas, & Slack, 2017) and positive relationship between corruption and
earnings opacity1 (Picur, 2004; Riahi-Belkaoui, 2004).
On reflection of this evidence, our first hypothesis is that managerial discretion and
accounting choice associated with the amount of development costs capitalised, is positively
influenced by the level of country corruption. We argue that, in an attempt to project a
positive image for their firms’ current and future performance, managers in countries with
high levels of corruption, capitalise larger amounts of development costs, in comparison to
those countries with low levels of corruption. As explained earlier, capitalising and not
expensing development costs results in better current-year earnings (i.e., earnings
management effect) and raises expectations for future earnings due to high amounts of assets
capitalised (i.e., a noisy signalling effect). On that basis, our second hypothesis is that
development costs capitalised have a lower association with cumulative future earnings in the
long-run for firms in countries with higher corruption levels (i.e., those associated with
over-capitalisation). This is because the capitalised development costs would not deliver as high as
signalled future economic benefits.
1
6
Building on these two hypotheses, we next consider whether levels of firm
internationalisation moderate the influence of corruption on their capitalisation of
development costs and also the relationship between capitalised costs and their contribution
to future earnings. As firms become international through, for instance, exporting,
cross-listing or owning overseas subsidiaries, the influence of domestic corruption may diminish as
the firm becomes more exposed to international norms (Reid, 1983). Indeed, prior literature
shows that internationalisation positively influences management attitudes towards
stewardship and accountability (Murtha, Lenway, & Bagozzi, 1998; Segaro, Larimo, &
Jones, 2014), compared to more domestically-orientated firms (Nadkarni & Perez, 2007) and
serves to lessen the effect of domestic corruption (Sandholtz & Gray, 2003). Thus, our third
hypothesis is that the more international a firm is, the lower will be the influence of domestic
corruption on the magnitude of development costs capitalised. From this, our fourth
hypothesis follows. More specifically, the influence of domestic corruption on the
relationship between capitalised costs and future earnings will also be weaker for those firms
that are more international compared to more domestically-orientated firms where the
influence of local corruption will not be so diminished.
To test our hypotheses, we employ a sample of over 3,300 firm-year observations, across
20 countries, which were mandated to adopt IFRS in 2005. Our analyses cover the periods
2006 to 2015 and the findings show the following. First, after controlling for various firm and
other country characteristics, there is indeed a positive relation between country level
corruption and the amount of development costs capitalised. Further, we find that the higher
the levels of corruption, the lower the association of the capitalised development costs to
future profitability, compared to countries with lower levels of corruption. This finding is
7
management and a noisy signalling effect prevail, in relation to the managerial discretion on
the development costs capitalised. Additionally, in more international companies, the amount
of capitalised development costs is less influenced by domestic corruption compared to those
companies that are more domestically orientated. Finally, the contribution of capitalised
development costs to future profitability is negatively influenced by the level of domestic
corruption in less international firms.
By examining the potential effect of corruption on the levels of capitalised development
costs and their respective contribution to firm level earnings, we contribute to the literature as
follows. Firstly, in the only other IFRS study which examines the determinants of R&D
capitalisation to our knowledge (i.e. Dinh et al., 2015) neither corruption nor
internationalisation as country and firm level contextual factors respectively were considered.
Unlike our research which employs a global dataset, their study is restricted to Germany only,
and thus their findings are necessarily country specific and do not shed light on the potential
disparity of accounting and managerial choice associated with IAS 38 in a global context. By
drawing on corruption as a possible influence on accounting choice, this study provides one
hitherto unexamined aspect of that analysis. In doing so, this study responds to Shah et al.
(2013 p. 168) who call for ‘analysis regarding capitalising R&D expenditures [which] helps
managers to conduct earnings management’. Secondly, this study addresses the call by
(Houqe & Monem, 2016, p.3) who note that ‘literature linking corruption with accounting is
sparse’. Our analyses provide empirical findings in support of Ball (2006), Nobes (2006),
Weetman (2006), Zeff (2007) suggesting that country specific characteristics result in an
uneven application of IFRS worldwide, and arguably, with adverse effects to comparability.
The remainder of the paper is organised as follows. Section 2, discusses the relevant
8
and the methods employed. Section 4 presents and discusses the empirical findings. Section
5 illustrates additional tests and Section 6 concludes the paper by outlining the contributions
arising from this research. It also discusses limitations and avenues for further research.
2. Background, literature review and hypotheses development
2.1 R&D reporting under IFRS
Since 2005, all EU publicly traded firms need to report consolidated financial statements
under IFRS,2 with IAS 38 governing the accounting treatment of intangible assets. IAS 38
requires the capitalisation of development expenditures which meet a specific set of criteria.
In order to capitalise the development costs a company should assess: the technical
feasibility of the intangible asset; the intention to complete the asset and with the ability to
sell (or use) it; the availability of resources, technical or financial, to complete it; the ability
to reliably measure the expenditure and the ability to justify that the asset will generate
future economic benefits (paragraph 57).
Based upon meeting these conditions, a company must then capitalise development
expenditure; it is not a discretionary choice. However, in establishing whether all these
criteria are met, there is managerial judgement and hence effective discretion over the
capitalisation decision. As PricewaterhouseCoopers (2010) note, meeting the six conditions
“requires facts and some judgements” (p. 7, emphasis added). Thus, if the company decides
that one of the conditions is not met, then it must expense the relevant cost incurred.
Alternatively, and consistent with an earnings management and noisy signalling approach
(Ahmed & Falk, 2006, 2009; Cazavan-Jeny & Jeanjean, 2006; Cazavan-Jeny et al., 2011;
Ciftci, 2010; Dinh et al., 2015; Markarian et al., 2008; Prencipe, Markarian, & Pozza, 2008),
2
9
a company may judge that all of the conditions have been met and effectively over-capitalise
development costs.
2.2 The R&D capitalisation debate and academic evidence
The accounting treatment of R&D has been a controversial issue among standards setters,
financial statement preparers, users as well as academics. Under IFRS, certain development
costs can be capitalised (see above), with all other costs associated with R&D expensed. In
contrast to IAS 38, under US Generally Accepted Accounting Principles (GAAP)
(Statement of Financial Accounting Standards (hereafter SFAS) 2), all R&D costs are
expensed. However, Lev, Sarath, and Sougiannis (2005) argue that immediate expensing
leads to biases in earnings and mispriced stock prices and Amir, Guan, and Livne (2007)
conclude that uniform expensing of R&D costs is ‘overly conservative’ (p. 245). One of the
reasons behind this differential treatment are apparent concerns by Financial Accounting
Standards Board (FASB) regarding the uncertainty related to the future benefits expected by
the assets capitalised. Additionally, they are concerned that management may use their
discretion to capitalise R&D, resulting in a misrepresentation of R&D accounting data
(Davies & Wallington, 1999; Healy & Wahlen, 1999). This is why Ahmed and Falk (2006)
conclude that, standard setters, such as FASB, are concerned that ‘the cost of possible
misstatement to exceed the benefits of signalling’ (p. 234) (and mandate expensing all R&D
costs as a result).3
In summary, within this debate, two issues dominate. Firstly, development costs
effectively constitute investments which will result in future economic benefits and as a
result they should be capitalised (i.e., not expensed) to recognise their current value to the
3
10
business and to provide a signal for future earnings arising from successful development
expenditure (Lev, Nissim, & Thomas, 2008). On the other hand, capitalisation can effectively
be used as an earnings management vehicle. These inter-related effects are also highlighted
by Dinh et al. (2015) as follows: ‘R&D capitalisation can be exercised by managers to signal
private information on future economic benefits to the market. It can, however, also serve as
opportunistic earnings management’ (p. 1) (and see Ciftci, 2010).
Dealing with signalling, there is mixed evidence within the literature on the link between
capitalisation and future earnings. For instance, in relation to French companies in the
pre-IFRS period in which firms were permitted to capitalise development costs under certain
conditions, Cazavan-Jeny and Jeanjean (2006) find a significant and negative relationship of
capitalised development costs and share price. In line with our propositions, they suggest that
managers are more likely to take a more opportunistic approach to capitalisation, given the
country contextual factors (i.e., weak enforcement). Further, Cazavan-Jeny et al. (2011),
again in the same French context, find that decision to capitalise R&D expenditures is
generally associated with a negative or neutral impact on future performance, and hence
inconsistent with the proposition that managers capitalise R&D to convey information about
improved performance (i.e., genuine signaling effect).
In contrast and supportive of a capitalisation approach, Lev and Sougiannis (1996) in a US
based study (requiring full expensing of R&D) find that R&D expenses are associated with
future income. In an Australian context, where companies were permitted to capitalise
development costs under certain conditions under Australian GAAP, Ahmed and Falk (2006)
in their study for the period 1992 to 1999, find that, ‘R&D capitalised expenditure is
positively and significantly associated with the firm’s future earnings’ (p. 231). Thus, they
11
capitalising successful R&D investment or expensing unsuccessful R&D investment’ (p.
259). The market relevance of capitalised development cost, and the signalling of managerial
information relevant to future earnings, is also noted by Shah et al. (2013) using UK data
covering pre and post IFRS adoption, ‘that investors perceive the capitalisation of R&D to be
related to successful R&D projects’ (ibid, p. 168) (and see Oswald & Zarowin, 2007;
Tsoligkas & Tsalavoutas, 2011). Finally, in relation to software development (SD), in her US
study, Wolfe (2012) finds that the association between capitalised SD expenditures and
future cash flows is stronger than the association between reported R&D expense and future
cash flows for firms that capitalise.
In relation to the potential manipulation of capitalisation associated with earnings
management, whilst much of the prior literature is based upon national GAAP rather than
IAS, consistent findings have been reported. Cazavan-Jeny et al. (2011) contend that
managers may capitalise development costs to meet or beat earnings thresholds/targets or to
avoid reporting losses. In their Italian study, based on the pre-IFRS period (where similar to
France and Australia noted earlier) companies were permitted to capitalise development
costs under certain conditions, Markarian et al. (2008) conclude on the motivations for
capitalisation as forming part of earnings management for earnings smoothing. Finally, Dinh
et al. (2015), in their study on Germany, which covers companies reporting under IFRS,
found that ‘pressure to beat past year’s earnings and analysts’ forecast of earnings increases
the probability of a firm capitalising R&D in the current period. This evidence is in line with
the notion of firms opportunistically managing earnings via R&D capitalisation’ (p. 3). They
contend that both the decision to capitalise and how much to capitalise are strongly and
12
earnings management counteracts the signaling value of capitalisation, a finding consistent
with the noted regulatory concerns in the US.
2.3 Hypotheses development
Prior empirical research has, almost universally, found that corruption has an adverse impact
on business activity due to a lack of transparency and the misallocation and inefficient use of
resources. For example, it is widely found to result in lower levels of foreign direct
investment and levels of economic growth (Bryant & Javalgi, 2016; Voyer & Beamish,
2004). Additionally, companies in countries with high levels of corruption tend to have
lower levels of corporate social performance disclosures (Baldini, Dal Maso, Liberatore,
Mazzi, & Terzani, 2016; Ioannou & Serafeim, 2012). Finally, earlier research, has shown a
negative relationship between low levels of corruption and information transparency in
general (DiRienzo et al., 2007; Kimbro, 2002).
In a more accounting specific context, Malagueño et al. (2010) examine accounting and
auditing quality and the perceived level of corruption across 57 countries. They find that
both accounting and auditing quality are negatively related to the level of perceived
corruption. Fan et al. (2014) highlight the link of earnings opacity and corruption in China,
whereby managers distort accounting information to cover their expropriation of interests
from common investors. Similarly, Picur (2004) and Riahi-Belkaoui (2004), in their
multi-country studies, find significant and positive relationships between the level of corruption
and the level of earnings opacity, indicative of earnings opacity being susceptible to
corruption. Riahi-Belkaoui (2004, p. 73) asserts that ‘the variations in earnings opacity
internationally suggest the presence of local factors that act as major determinants of its level
13
determinant of the level of earnings opacity’. Overall, this literature suggests that in more
corrupt environments managers are more likely to distort earnings, reflecting managerial
opportunism.
From this, and in line with the prior literature which suggests that managers take an
opportunistic approach to capitalisation of development costs (Cazavan-Jeny & Jeanjean,
2006; Cazavan-Jeny et al., 2011; Dinh et al., 2015; Markarian et al., 2008), it follows that
managers in a more corrupt environment would capitalise higher amounts of development
costs. Hence, we test the following hypothesis:
H1: There is a positive relation between country level corruption and the amount of development costs capitalised.
Assuming that H1 holds, beyond that capitalising and not expensing development costs
would result in better current-year earnings, managers falsely signal their private information
in relation to the future economic benefits associated with the capitalised development costs.
Thus, one would expect that the contribution of development costs capitalised and
cumulative future earnings in the long-run would not be as high for firms in countries with
higher corruption levels. This is because the capitalised development costs would not deliver
as high as signalled future economic benefits. Hence, we test the following hypothesis:
H2. The higher the corruption in a country, the lower the association of the capitalised development costs to future profitability.
We are primarily interested in the overall effect of corruption on capitalisation of
development costs. Thus, H1 & H2 are our main hypotheses. However, if it is the case that
country level corruption influences capitalisation of development costs and the resulting
contribution to future earnings, then the effect of domestic corruption may be affected by the
extent to which a particular firm is exposed to foreign norms and behaviours. Thus, we are
14
should diminish as firms become more exposed to foreign economic environments.
Following on from this, in more international firms the contribution of the capitalised
development costs to future profitability will not be as reduced due to domestic corruption
influences compared to those less international firms. Effectively, we examine if the relation
between corruption and capitalisation of development costs, as well as their contribution to
future earnings, is moderated by the degree of internationalisation measured at the firm level.
The rationale of these additional hypotheses is as follows.
One of the strategic choices that firms undertake is the internationalisation of their
business activity. Internationalisation can be defined as ‘the process of increasing
involvement in international operations’ (Welch & Luostarinen, 1988, p. 84). Drawing on the
strategic management and international business literature, Reid (1983) highlights the
importance of export market characteristics, such as economic and social norms, becoming
recognised and part of a firm’s decision-making processes. As such, firms will adapt and
adopt an increasingly market centred, as opposed to domestic, approach to international
business. Johanson and Vahlne (1990) process model of internationalisation further
highlights the need for firms to make adaptations in their ways of performing business to
signal their credibility to international partners and networks (Ford, 1979; Turnbull & Valla,
2013). Moreover, as part of the internationalisation process, Murtha et al. (1998) argue that
managerial thinking and attitudes towards issues such as accountability and global values are
critical for strategic change. In line with this, Segaro et al. (2014), in their research
examining SME behaviour, argue that through the process of internationalisation,
stewardship and the long-term orientation of the firm become more embedded in managerial
thinking and attitudes. The resource diversity of internationalisation, compared to the
15
environment (Nadkarni & Perez, 2007; O'Grady & Lane, 1996). From this, it derives that the
more international the firm is the more long term-orientation and stronger elements of
stewardship it has (Murtha et al., 1998; Segaro et al., 2014).
With regard to corruption in particular, Sandholtz and Gray (2003) assert that as
international trade augments international norms, the effect of corruption is reduced on those
involved with trade, consistent with a ‘significant inverse relationship between international
trade and corruption levels’ (p. 765). From the foregoing, it follows that the more
international a firm becomes, compared to those more domestic firms, the less it will be
influenced by local corruption (c.f., Ades & Di Tella, 1999).
These arguments are also informed by the evidence in the accounting literature which
provide wider evidence that the impact of country-level corruption at a firm-level is reduced
through internationalisation. For example, Dauth, Pronobis, and Schmid (2017, p. 71)
provide evidence that, ‘top management internationalisation mitigates the level of managerial
discretion in financial reporting’. Additionally, Hope, Kang, Thomas, and Yoo (2008) argue
that if a domestic firm derives most of its revenues from overseas operations, or if the firm is
cross-listed, then the firm ‘is less likely affected by domestic norms – such as the extent of
secrecy in the country’ (p.361) than other, less internationally-oriented firms.4 They find that
firms in secretive environments are more likely to employ a non-Big 4 auditor with negative
implications for the quality of financial statements. Thus, they suggest that ‘...multinational
firms are less affected by home country cultural norms than are domestic firms’ (p. 371).
In an earnings management context in particular, Lang, Lins, and Miller (2003) and Lang,
Raedy, and Yetman (2003) employ cross-listing as a measure of internationalisation and find
4
16
that cross-listed firms have better, more transparent, information environments and would
appear to be less aggressive in terms of earnings management. Moreover, In fact,
‘multinationals tend to carry out less income-increasing earnings management than domestic
firms’ (Prencipe, 2012: 693). This is particularly relevant to our context given that
capitalisation of development costs results in income increasing earnings management as
discussed earlier.
From the foregoing, we would argue that companies with an international focus are less
driven by local factors due to internationalisation, and as a result, the influence of domestic
corruption would diminish. In our context, the short-term opportunism by over-capitalising
development costs that is influenced by local norms of corrupt behaviour would be less
pronounced. Thus, we hypothesise that the effect of corruption on the amount of capitalised
development costs would be lower for those companies that are more international.
H3. The amount of capitalised development costs will be more influenced by domestic corruption in firms with lower levels of internationalisation.
From this and on reflection of H2, it derives that the expected positive effect of capitalised
development costs to future earnings is moderated by the extent of domestic corruption when
the company is less international. Thus, we also test the following hypothesis:
17 3. Research design
3.1 Sample selection process
The data selection starts by focusing on the countries that adopted IFRS on a mandatory basis
in 2005, as reported in Daske, Hail, Leuz, and Verdi (2008).5 We then retain in our sample all
companies reporting either an R&D asset or an R&D expense in the period between 2006 and
2010. We exclude the first year of IFRS adoption (i.e., for the reporting period 2005) to
reduce the potential for any misreporting due to low familiarity with IFRS at the time. We
obtain data from Worldscope/Datastream and include all companies in the research lists of
dead and active firms constructed by Datastream for each country in our sample. To avoid
double counting, firms that are cross-listed in more than one market are included in our
sample once, based only on the country of primary listing. In addition, we eliminate
instruments which are not classified as equity. The sample period ends in 2010 because we
require five years of data subsequent to that year (i.e., 2011-2015) to measure future
performance. Subsequently, we eliminate companies belonging to the Oil and Gas industry
due to extraction costs, which could be classified as development costs. Given that we focus
on firms which adopted IFRS, we eliminate all those companies which do not report under
IFRS for the whole of the sample period i.e., they switched from IFRS to other GAAP at
some point in the sample period.6 Following García Lara, García Osma, and Mora (2005), we
also exclude firms with accounting periods of more than 380 or less than 350 days and firm
year observations with insufficient data. In addition, we exclude observations where the
5
It is noted that Daske et al. (2008) include Switzerland and Venezuela but they are excluded from our sample. Switzerland did not implement IFRS at that time; it gave companies the option to adopt IFRS or US GAAP instead. Venezuala was excluded due to it being an economy with hyper-inflation and as such only fully adopted IFRSs in 2008 with some modifications for inflation.
6We rely on Worldscope item ‘accounting standards followed’
18
Inverted Mills ratio could not be estimated7 (see below). This process results in our sample
consisting of 3,383 firm year observations corresponding to 1,122 firms, across 20 countries.
We classify firm year observations as a capitaliser if a company capitalises R&D during the
year, otherwise we consider the company as an expenser. In total, we have 1,576 capitalisers
and 1,807 expensers. Panel A of Table 1 summarises the data selection process and shows the
breakdown between capitalisers and expensers.
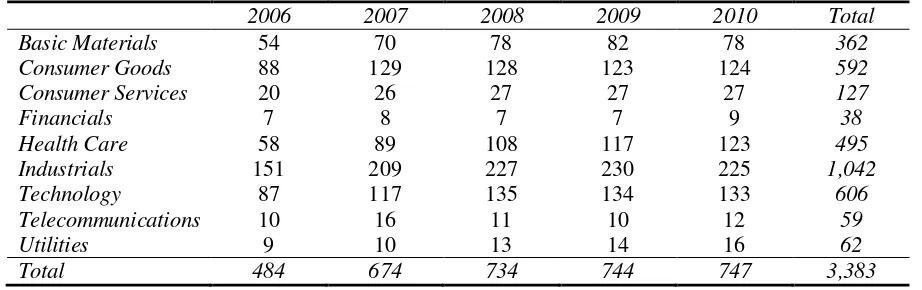
Panels B and C of Table 1 show the sample distribution by industry classification using
ICB Super Sector (ICB Level 2) and country, respectively. We observe a good distribution of
our sample firms across industries, with most of the firms being from the Industrials (1,042),
Technology (606), Consumer Goods (592) Health Care (495) and Basic Materials (362)
industry sectors. Moreover, there is also a good distribution of the sample observations across
countries (e.g., UK (814), Germany (565), France (397), Australia (270), Sweden (259),
Finland (218), Italy (178)).8
TABLE 1 ABOUT HERE
3.2 Corruption as a determinant of development costs capitalised (H1 & H3)
We first test H1 (i.e., whether corruption affects positively the amount of R&D capitalised),
by estimating the following zero (i.e., left) sensored Tobit model:
RDCAP=b0 + b1Corruption + b2∑Controls + Industry fixed effects + Year fixed effects +ε(1)
where, RDCap is the amount of R&D capitalised during the year; Corruption is the measure
of country level corruption. Our measure of corruption is based on the Corruption Perception
Index (CPI) calculated from Transparency International (TI) and has been extensively used
7
This happens due to perfect failure of the probit model; some industries have no variation in CAP (the 0-1 dummy variable) and we cannot estimate the probit model.
8
19
by prior literature as a proxy for corruption in a country (e.g. DeBacker, Heim, & Tran, 2015;
Liu, 2016; Mazzi et al., 2017).9 CPI is calculated annually and scores countries based on the
perceived level of corruption in the public sector. TI records countries which are less corrupt
as top scorers. Therefore, a higher CPI rank indicates a less corrupt country and vice versa.
To assist the interpretation of our findings, we construct Corruption as the difference between
the highest possible CPI score (i.e., 10) minus each country’s corruption level. Thus, the
higher the difference the more corrupt a country in our sample and, as a result, a higher
(lower) value of Corruption would indicate higher (lower) level of corruption. In line with
H1, we expect the coefficient b1 to be positive indicating that firms in more corrupt countries
capitalise higher amounts of development costs.
To avoid the Corruption measure capturing the underlying effect of other country level
factors which could also have an influence on managerial accounting choice, country level
controls include the following: RDdivergence is a dummy variable that takes the value of 1 if
capitalisation of development or research costs was permitted or required prior to 2005 and 0
if no such capitalisation was permitted. CivCom is a dummy variable that takes the value of 0
if the country is characterised with common law and 1 if with civil law. InvProtection is a
measure of investor protection calculated as principal component analysis of disclosure,
liability standards, and anti-director rights (La Porta, Lopez-de-Silanes, & Shleifer, 2008).
AudEnf is an index capturing the degree of accounting enforcement activity in each country
measured in 2008. MrktDev is the market capitalisation of listed companies as a % of GDP
9
20
and AntiselfDeal is the Djankov, La Porta, Lopez-de-Silanes, and Shleifer (2008) anti
self-dealing index.
In addition, we include a battery of firm level control variables which prior (primarily
non-IFRS) literature shows to affect the capitalisation of R&D as a function of a firm’s life cycle
and whether the firm meets the conditions for capitalisation (Aboody & Lev, 1998;
Cazavan-Jeny et al., 2011; Dinh et al., 2015; Markarian et al., 2008; Oswald, 2008; Oswald &
Zarowin, 2007), namely: book to market ratio (BM), as a measure of risk and growth;
RDValue which is a proxy for the success of a firm’s R&D expenditure; R&D intensity
(RDInt) which determines whether the magnitude of R&D expenditure affects the decision to
capitalise R&D; the natural logarithm of market value of the company (Size); beta (Beta) as a
proxy for risk because riskier firms are more likely to engage in basic research which is
expensed than less risky firms (Aboody & Lev, 1998); and finally total debt to book value of
equity (Leverage), as a proxy for financial health. Additionally, we include the ratio of
foreign sales to total sales (IntSalesPerc) to capture whether internationalisation influences
the level of capitalisation through synergies with international partners.
We also create dummy variables which capture the likelihood of a company managing
earnings in an attempt to achieve certain earnings targets. Following Dinh et al. (2015), we
introduce PastBeat which takes the value of 1 if prior year’s earnings is greater that this
year’s earnings, assuming full expensing and smaller than this year’s earnings assuming full
capitalisation, and 0 otherwise. In addition, we include a similar dummy variable for the zero
earnings threshold (ZeroBeat). Specifically, this takes the value of 1 if the zero earnings
threshold is greater that this year’s earnings assuming full expensing and smaller than this
year’s earnings assuming full capitalisation, and 0 otherwise. We also combine the latter two
21
Subsequently for testing H3, we estimate the same regression across the sub-samples of
low and high internationalisation. Internationalisation is measured by the ratio of foreign
sales to total sales (Dauth et al., 2017; Glaum, Baetge, Grothe, & Oberdörster, 2013; Hamori
& Koyuncu, 2011). Based upon this measure, we then calculate the median value which
determines the two sub-samples of high and low international firms respectively. We then
compare the size, and the significance of any difference, of the coefficients of the variable
Corruption to infer the differential influence of domestic corruption on the amounts
capitalised across the two sub-samples.
3.2 Capitalised development costs, corruption, and future performance (H2 & H4)
To examine the influence of corruption on the relationship between capitalised development
costs and future profits we employ a regression model which is similar to Curtis, McVay, and
Toynbee (2014) and is as follows:
NI= a0, + b1RDCap + b2RDExp+ b3∑Controls + Industry fixed effects + Year fixed effects + ε (2)
where, NI is one measure of future earnings10 being the sum of future earnings measured
from year t+1 to year t+5 scaled by the market value of equity. Earnings are defined as
operating income plus the R&D expense and depreciation and amortisation.11 As an
alternative, we also employ NI2 which isthe sum of future earnings defined as the net profit
before extraordinary items measured from t+1 to t+5 scaled by the market value of equity.
Earnings are defined as income before extraordinary items, R&D expenditure, depreciation
and amortisation; RDCap is the amount of R&D capitalised during the year; and RDExp is
the amount of R&D expensed during the year. We also include an indicator variable equal to
10
We use earnings because earnings is deemed as a more direct measure of the benefits associated with R&D (Lev & Sougiannis, 1996).
11
22
1 if the company capitalises development costs during the year (CAP). Following Kothari,
Laguerre, and Leone (2002), Amir et al. (2007)12 and Curtis et al. (2014) controls include
capital expenditure (Capex), Leverage and Size (both as defined in the previous regression
model). Moreover, we include the ratio of foreign sales to total sales (IntSalesPerc) to capture
whether internationalisation influences future firm profitability through greater market
access. In addition, we include the following country controls: MrktDev and Enforcement
(again, both as defined in the previous regression model). A positive coefficient of b1 will
indicate that the capitalised amount of R&D is associated with future economic benefits
which would be in line with the asset recognition criteria in IAS 38. Considering that this is
the first study to analyse the consequences of R&D to future profits under IFRS, we do not
have an ex-ante prediction for the coefficient of R&D expense.
Similarly to Oswald and Zarowin (2007) and Dinh et al. (2015), we control for the
endogenous decision to capitalise R&D using the two-stage approach of Heckman (1979) and
use the Inverse Mills Ratio (IMR) retrieved from estimating a probit model. The results of
these estimations are presented in Appendix I.
To test H2 and subsequently H4, we introduce our measure of corruption in model (2)
both as a main effect as well as an interaction term with the R&D asset (RDCap) and R&D
expense (RDExp), as follows:
NI= a0, + b1RDCap + b2RDCap*Corruption + b3RDExp+ b4RDExp*Corruption
+ b5Corruption + b6∑Controls + Industry fixed effects + Year fixed effects + ε
(3)
The coefficient b1 captures the relation between future earnings and R&D asset, while the
coefficient b2 captures the incremental effect of corruption on this relation. Consistent with
12
23
H2, we expect the coefficient b2 to be negative and b1 to be positive indicating that the
capitalised amount of R&D is associated with less future economic benefits in more corrupt
countries. We do not have an ex-ante prediction for b3 and b4.
In estimating all regressions (equations 1 and 2), we add industry dummy variables based
on the ICB Level 2 industry classification. Further, we also control for cross-sectional and
time series correlation by adding year fixed effects and clustering by firm. We winsorise all
the continuous variables at the 1 percent level on both tails of the distribution. We report all
the variables employed in our models together with their source in Appendix II.
Finally, for testing H4, we estimate the same regression across the sub-samples of low and
high internationalisation as described earlier. We then compare the size of the coefficients,
and the significance of any difference, of the variable RDCap*Corruption to infer the
differential influence of domestic corruption on the contribution of the capitalised
development costs to future profitability across the two sub-samples.
4. Results
4.1 Descriptive statistics
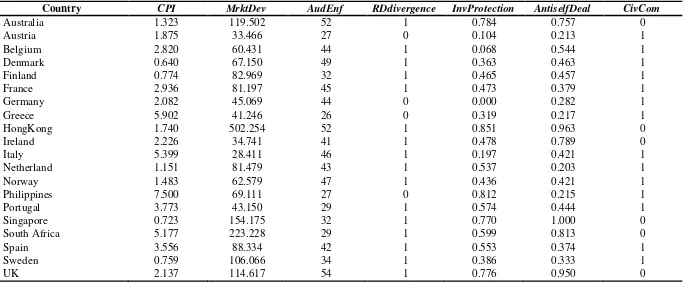
Table 2 shows descriptive statistics for corruption (CPI), market development (MrktDev) and
level of enforcement (Enforcement) in the countries included in our sample. This reveals a
range of values between all of the countries for corruption and in relation to the other country
relevant variables. For example, whilst focusing on countries with relatively large number of
observations in the sample, Australia, Sweden, Denmark and Finland (represented by 857
observations) have the lowest levels of corruption (ranging from 0.640 to 1.323). At the other
extreme, Italy, South Africa, Greece, Poland and Spain have highest levels of corruption
24
same sets of countries, values of enforcement range from 32 to 52 for those countries with
low corruption levels and between 26 to 46 for the countries with higher levels of corruption
depicting a lower level of enforcement. Similar variations exist in relation to market
development.
TABLE 2 ABOUT HERE
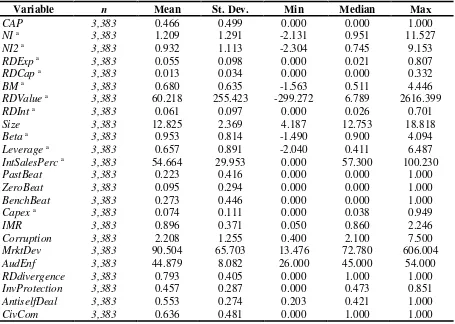
Panel A of Table 3 shows descriptive statistics for all the variables used in our models for the
full sample. These reveal, inter alia, that 46.6% of firm-year observations in our sample
capitalise some development costs while the remaining totally expense them in the income
statement. While the capitalised development costs (RDCap) accounts for 1.3% of market
value on average, the expensed R&D (RDExp) is around 5.5% of MV. The average firm-year
observation in our sample has also a book value to market value of equity (BM) of 0.68,
shows a material R&D intensity (RDInt) of 6.1%, and has a a Leverage ratio of around
65.7%.
TABLE 3 ABOUT HERE
Panel B of Table 3 reports descriptive statistics for the dependent and independent variables
used in the multivariate analyses for the two sub-samples of Expensers and Capitalisers. The
former has a mean (median) NIof 1.087 (0.911), while the latter exhibit a mean (median)
future earnings of 1.35 (1.02). T-test (Mann-Whitney test) indicates that the mean (median)
NI for Capitalisers is significantly higher (p<0.01) than the mean (median) for Expensers.
The statistics are similar for NI2. The mean (median) R&D expense (RDExp) for the
subsample of Expensers is 0.052 (0.022), while the mean RDExp for Capitalisers is 0.059
(0.020). T-test (Mann-Whitney test) shows that there is a strong statistically significant
difference across the two sub-samples. This may not be surprising given that a large number
25
The subsample of Capitalisers shows an average (median) RDInt of 0.059 (0.021), while the
mean (median) of the corresponding amount for Expensers is 0.063 (0.030) being
significantly smaller based on a Mann-Whitney test (p<0.01). These descriptive statistics
indicate that, as expected, companies that capitalise some or all of the development costs are
firms that are more R&D intensive and have significantly higher future profitability.
Additionally, and as shown in prior literature (e.g. Dinh et al., 2015; Oswald, 2008), T-test
and Mann-Whitney test indicate that Capitalisers are smaller (mean Size = 13.01 for
Expensers vs. mean Size = 12.614 for Capitalisers; p<0.01), riskier (mean Beta = 0.929 for
Expensers vs. mean Beta = 0.980 for Capitalisers; p<0.05) and more levered (mean Leverage
= 0.591 for Expensers vs. mean Leverage = 0.733 for Capitalisers; p<0.01).
4.2 Univariate analysis
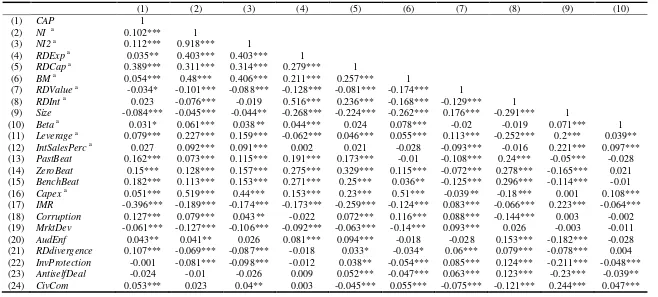
We present Pearson correlation coefficients between all variables in Table 4. The correlations
between the key variables of interest (i.e., RDCAP, Corruption, NI and NI2) and other
variables indicate the following. As hypothesized, the amount capitalised is positively and
significantly correlated with Corruption (0.072; p<0.01). Additionally, as expected from
evidence in prior literature, the amount capitalised is also positively and significantly
correlated with future earnings (NI and NI2 exhibit a positive correlation at 1% level) but also
earnings benchmark beating (PastBeat, ZeroBeat and BenchBeat, all exhibit a positive
correlation at 1% level), BM (i.e., growth) (0.257; p<0.01), RDInt (0.236; p<0.01), Leverage
(0.046, p<0.01), and Enforcement (0.094; p<0.01).
Although these results depict a picture in line with our first hypothesis, they are unable to
26
cannot bring into light the moderating effect of corruption and internationalisation. Thus,
results are further explored with multivariate analyses in the following section.
TABLE 4 ABOUT HERE
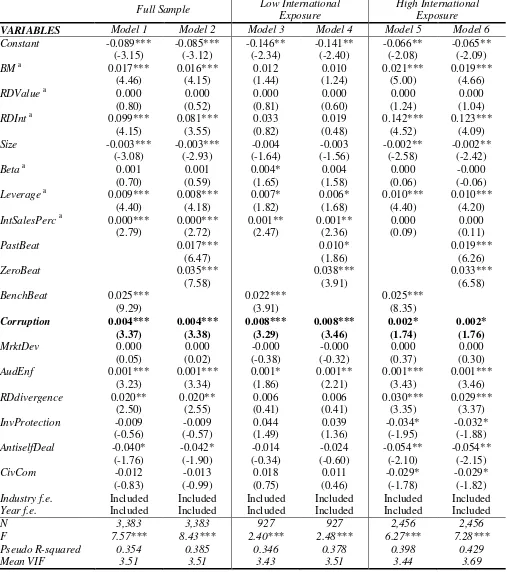
4.3 Multivariate analysis
Table 5 reports results for multivariate analysis testing the effect of corruption on the
magnitude of development costs capitalised. Models 1, 3 and 5 differ from 2, 4 and 6
respectively only for the measures used to proxy earnings benchmark beating.
Focusing on the full sample, the results support H1: firms in countries with higher levels
of corruption capitalise higher amounts of development costs. In fact, the coefficient for
Corruption is positive as expected and statistically significant across both models 1 and 2
(always at the 1% level). Confirming univariate analysis, our results also indicate that the
amount of capitalised development costs is positively influenced by R&D intensity (RDInt),
growth (BM), internationalisation (IntSalesPerc) and leverage (Leverage). In addition, we
report that Size negatively affects the amount of development costs capitalised. Further, our
multivariate analysis confirms that amount of development costs capitalised is significantly
affected by earnings management, as the coefficients for the measures derived from Dinh et
al. (2015) are always positive and statistically significant.
Models 3 to 6 report the multivariate analyses testing H3. We report that both for firms
with low and high international exposure, Corruption is positively and significantly
associated with the amount of development costs capitalised. However, tests comparing the
size of the coefficients of the variable Corruption across all models indicate that these are
significantly higher for the sub-sample of firms with lower levels of internationalisation.
27
TABLE 5 ABOUT HERE
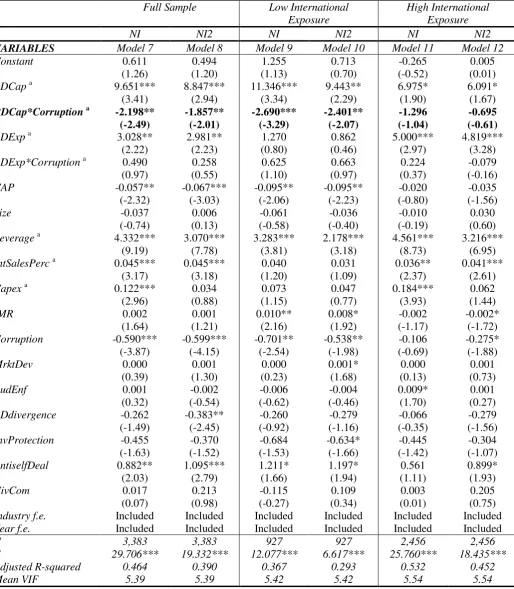
Table 6 reports results for multivariate analysis testing the moderating role of corruption in
the relationship between R&D and future earnings for the full sample but also across the
sub-samples of firms with lower and higher levels of internationalisation. These analyses test
hypotheses H2 and H4. As previously, Models 7, 9 and 11 differ from 8, 10 and 12
respectively only for the measures used to proxy earnings benchmark beating.
These multivariate analyses, firstly, confirm the rationale that capitalised development
costs are mirrored in future economic benefits as the coefficient for RDCap is positive and
statistically significant across all model specifications. Moreover, this analysis illustrates the
moderating role of corruption in the relationship between R&D and future earnings,
supporting H2. In both models 7 and 8 the coefficient for the interaction between RDCap and
Corruption is negative (statistically significant at the 5% level) suggesting that the
association between capitalised development costs and future earnings is lower in more
corrupt countries. Additionally, expensed R&D (RDExp) is also positively correlated with
future earnings (again at the 1% level). The latter suggests that there is still an element in the
amounts expensed that contributes to future earnings.
TABLE 6 ABOUT HERE
Secondly, the results across the sub-samples of firms with higher and lower levels of
internationalisation provide a clearer picture of the role of domestic corruption. The tests
across Models 9 and 12 reveal that the contribution of capitalised development costs to
future earnings when corruption is higher is present only for the sub-sample of firms with
lower levels of internationalisation. These results are in support of H4.
The combined results of these tests and those presented in Table 5 indicate the following.
28
expected future earnings is not as high as expected when domestic corruption is high. This
finding is associated with the sub-sample of firms with low internationalisation. For firms
with high internationalisation, domestic corruption does not impair the benefit from the
amounts capitalised, suggesting that these amounts genuinely represent future economic
benefits which are mirrored in companies’ future profitability. In fact, the positive influences
of the expensed amounts revealed for the full sample is driven only by this sub-sample of
firms.
4.4 Discussion of findings
On reflection of our hypotheses and informed by prior literature, the following inferences can
be drawn from the results presented. Whilst the level of development cost capitalisation is
positively associated with a number of firm-level characteristics, for instance, R&D intensity,
growth and leverage it is also influenced by corruption as a country characteristic. More
specifically, we show a strong significant association between country corruption and levels
of development cost capitalisation (H1) and, further in such cases, the lower the contribution
of the capitalised development costs to future earnings (H2).
Such findings are broadly consistent with that strand of the accounting literature prior to
the mandatory of IFRS that finds that accounting choices, such as capitalisation, are
associated with earnings management, for instance to avoid reporting a loss, to achieve
earnings smoothing or benchmark beating (Cazavan-Jeny & Jeanjean, 2006; Cazavan-Jeny et
al., 2011; Dinh et al., 2015; Markarian et al., 2008). For example, Cazavan-Jeny et al. (2011,
p. 146) contend that their ‘...results are therefore consistent with managers potentially
capitalising R&D expenditures to achieve certain financial reporting objectives’. Moreover,
29
Han et al., 2008; Nabar & Boonlert-U-Thai, 2007) conducive to earnings management (Fan et
al., 2014; Picur, 2004; Riahi-Belkaoui, 2004) such as the aggressive use of capitalisation. It is
due to concerns of such accounting, and the potential manipulation of earnings, that US
GAAP requires all R&D costs to be expensed (SFAS 2).
Inherent with capitalisation is the signalling effect, based upon hitherto proprietary
information, regarding the strength of future earnings. Overall, the literature is more mixed as
to the affect of capitalised costs on future earnings. As Ahmed and Falk (2006) summarise,
‘when a firm capitalises expenditure and reports the amount as an asset in its financial
statements, it signals good news. The capitalisation decision suggests that, in the reporting
entity’s judgment, the capitalised expenditure is expected to yield benefits to the
entity…likely to be realized in the foreseeable future’ (p. 232) (see Shah et al., 2013; Wolfe,
2012). However this is in contrast to the more negative findings regarding the relationship
between capitalisation and future earnings (for instance Cazavan-Jeny and Jeanjean (2006)
(for instance Cazavan-Jeny & Jeanjean, 2006). Our findings reveal a consistency of
over-capitalisation, associated with high levels of corruption, and its impaired ability to generate
stronger future earnings, effectively sending noisy or misleading signals regarding future
earnings.
Furthermore, as a firm becomes more international, levels of home country risk factors,
such as that associated with high corrupt environments, may diminish as the firm becomes
more exposed to international norms and levels of scrutiny reducing potential managerial
discretion in accounting choice (Sandholtz & Gray, 2003) Our findings in relation to H3
confirm that as a firm becomes more international, the influence of home country corruption
on capitalisation is mitigated. Such a finding is consistent with the literature on domestic and
30
p. 693) finds that ‘multinationals tend to carry out less income-increasing earnings
management than domestic firms’. Further, Lang, Lins, et al. (2003) and Lang, Raedy, et al.
(2003) find that international firms, through cross-listing, are more transparent, and less
aggressive in accounting choices, than domestic firms. It follows from H3, and the preceding
findings of H1 and H2, that the influence of home country corruption on the contribution of
capitalised costs to future earnings is mitigated with levels of internationalisation.
These findings, examining corruption as a country factor influencing accounting choice
provide new insights into the accounting literature, where such research is sparse (Houqe &
Monem, 2016) despite the recognized link between corruption and earnings opacity. Further,
whilst Dinh et al. (2015)examined R&D capitalisation, that study did not shed any light on
the determinants of capitalisation from an international context, nor did it consider the
potential and (now revealed) significant influence of corruption.
5. Sensitivity analyses13
5.1 Corruption and excessive development costs capitalisation levels.
The findings presented earlier suggest that, in environments where corruption levels are
high, companies engage with excessive and not accurate capitalisation of development costs.
However, our research design does not allow us to distinguish whether companies capitalise
more than they would be expected to capitalise given the industry in which they operate. To
address this concern and for shedding more light on our main findings, we proceed as
follows.
We draw on the earnings management via discretionary accruals literature and in the spirit
of Jones (1991), Boynton, Dobbins, and Plesko (1992) and DeFond and Jiambalvo (1994) ,
13
31
we perform additional analyses intended to estimate the unexpected amount of R&D
capitalised. Subsequently, we test its association with the country-level of corruption, while
controlling for all other country factors. More specifically, first, we estimate a zero (i.e., left)
censored Tobit model as in equation 1. We estimate this for every single industry-year in our
sample and we include firm-level controls only. Then, we predict the fitted values and
residuals, proxying for the expected and unexpected amount of R&D capitalised in a given
cluster respectively.14
These estimations allow us evaluate the country level influences on the expected and
unexpected amounts. We do so by estimating equation 1, while also including the country
controls, twice: once by replacing the amount of R&D capitalised with the expected and
once by replacing it with the unexpected amount. The results from these tests show that the
country level of corruption is significantly and positively associated with the unexpected part
of R&D capitalised only. This confirms the trend we identify in our main analyses that the
higher the domestic corruption the higher the amounts capitalised. Moreover, we replicate
these analyses across the two sub-samples of high and low internationalisation and we find
that our main results are also robust. The impact of corruption on the unexpected amount of
R&D capitalised is less prominent for more international firms.
5.2 Alternative measures of corruption and internationalisation.
One concern with our results is that the measure of corruption may not capture country
corruption in an efficient way. To alleviate this concern, we repeat all our tests by using two
alternative measures of corruption. More specifically, we examine whether our results hold
when we measure corruption, first, based on Bribery and Corruption provided by the
14
32
International Institute for Management Development (IMD) Yearbooks and, second, when
we substitute it with the cultural value of Secrecy. For both cases, the results remain
qualitatively similar to those presented earlier.
Additionally, we consider an alternative specification to capture firm level
internationalisation, that of analysts following. The results of these additional tests remain
qualitatively similar to those presented earlier.
5.3 Consideration of number of observations and country level economic development
For the analyses presented in Table 6 with regard to H2 and H4, one could argue that
economic growth may be already low in corrupt countries. Thus, it could be argued that it is
not surprising that the R&D capitalised would then produce lower levels of future profit
flows. To account for this, we estimate country GDP growth for the entire five year periods
which we use to measure cumulative future earnings. These tests indeed reveal that five-year
change in GDP is positively and significantly associated with firm-level future profitability.
The results with regard to the hypotheses tested remain same as those presented earlier.
Finally, we replicate our analysis by excluding countries with less than 50 firm-year
observations. Following this approach, we drop firms from Hong Kong, Ireland, Philippines,
Portugal, and Singapore. Our main results are robust to this additional test, showing that less
represented countries do not influence our inferences.
6. Conclusions
The accounting treatment of R&D has been a controversial issue among standards setters,
financial statement preparers and users as well as academics. Advocates for capitalising
33
economic benefits and as a result they should be capitalised (e.g. Lev & Sougiannis, 1996).
In line with this premise, IFRS prescribe that, when certain criteria are met, including
demonstration of future economic benefits, development costs only must be capitalised.
Arguably, by imposing the restrictive conditions in IAS 38 reduces the managerial
opportunism that may result from discretion involved in R&D capitalisation (Markarian et
al., 2008; Matolcsy & Wyatt, 2006) and one would expect that only development
expenditures from those R&D projects, which are highly likely to be successful, are
capitalised. As a consequence, managers can signal their private information about the
expected success of R&D ventures and the related future benefits to the market (Abrahams
& Sidhu, 1998; Oswald & Zarowin, 2007; Ritter & Wells, 2006). Indeed, capitalising R&D
has been found to be informative (Ahmed & Falk, 2006; Oswald & Zarowin, 2007).
However, since the application of the conditions in IAS 38 requires managers to make
judgment, R&D capitalisation under IAS 38 remains subject to managerial discretion and
possible earnings management. Such premise finds support in academic research which
reports that the discretion involved in R&D capitalisation can be used for opportunistic
earnings management, resulting in capitalisation being uninformative (Cazavan-Jeny &
Jeanjean, 2006; Markarian et al., 2008; Prencipe et al., 2008). This is why reliability of such
information can be easily questioned (c.f., Kothari et al., 2002) and in part giving rise to this
research.
However, in this study, we consider prior accounting literature which highlights the
importance of country corruption on accounting choices and explore the potential effect on
corruption on R&D reporting in particular, for which evidence is absent. More specifically,
we employ a large sample of listed firms across the world and, first, we examine the role of
34
and not expensing development costs would suggest better earnings figures in the current
year. Second, assuming that the first hypothesis holds, one would expect that cumulative
future earnings in the long-run would not be as high for firms in countries with higher
corruption levels. This is because the capitalised development costs would not deliver as
high as signalled future economic benefits. This would lead to lower earnings for these firms
compared to those in countries with lower corruption levels which capitalise based on
meeting IAS 38 criteria instead. Our empirical findings support both hypotheses. Finally, we
find that the effect of corruption as an influential factor for the capitalisation of higher
amounts of development costs, which then lead to lower future profitability, is more
pronounced in companies of lower international exposure. These analyses illustrate that, in
more corrupt countries, managers potentially send false signals to financial statements users
by being more likely to capitalise higher amounts of development costs, which do not bring
future economic benefits. Instead, companies with a more international exposure are less
influenced by the levels of domestic corruption and thus local environment. From this, such
internationally oriented companies capitalise more appropriately and hence better signal the