January 2010
Consumer Confidence Index (CCI) rebounded in monthly and
annual basis. Rupiah appreciation against USD and mild
pressure on inflation were considered as the main factors
that contributed in rising CCI. The index was 1.8 points
higher than previous month and 17.7 points steepen to the
previous year.
Consumers believed that pressure on price will relatively
high over the next 6 months as the index climbed 2.4 points.
Consumer Confidence Index
The Consumer Survey revealed an upward trend of consumer
spending.
Such rising was reflected on stronger consumer confidence by 1.8
points to 110.5 over previous month. Strengthening Rupiah against USD and
low inflation rate were deemed as the boosting factor of consumer spending
which heightened CCI to deeper optimistic level. Moreover, the enhancement
of respondent’s expectation over economic condition in the next 6 months
and thinning respondent’s pessimism on current economic condition which
seen from rising index by 1.9 points and 1.7 points respectively have also
raised the CCI.
Graph 1. Consumer Confidence Index
60.0 70.0 80.0 90.0 100.0 110.0 120.0 130.0 140.0
12 1 2 3 4 5 6 7 8 9 10 11 12 1 2 3 4 5 6 7 8 9 10 11 12 1
2007 2008 2009 2010
(Index)
Current Economic Condition Index Consumer Expectation Index Consumer Confidence Index
Optimistic
Pesimistic
CONSUMER SURVEY
Consumer
Confidence Index
is getting more
optimistic
Methodology
Consumers had an optimistic view toward economic conditions.
In annual basis, CCI was significantly improved as the index was 17.7 points
higher against previous year. The upgrading of respondent’s perception over
current economic condition by 18.7 points and over next 6 months economic
condition by 16.7 points has lifted the CCI as well.
Respondents stated that current economic condition remain
upbeat against previous month.
In early 2010, respondents seized a less
pessimism on economic condition as the Current Economic Condition Index
(CECI) moved up 1.7 points to 98.4. The component measuring consumer
tendency toward current conditions, showed better assessments on both
current income and perception that currently is appropriate time to consume
durable goods, jumped by 2.4 points and 4.1 points respectively.
Respondents also claimed that current economic condition was
relatively better than the same period in last year.
CECI is still recorded
go upward as compared to the previous year. The index soared 18.7 points
due to rising all CECI components index, with the highest rising was in job
availability index by 22.1 points, followed by appropriate time to consume
durable goods index 20.4 points, as well as current income index by 13.5
points.
Graph 2. Current Economic Condition Index (CECI)
0.0 20.0 40.0 60.0 80.0 100.0 120.0 140.0
12 1 2 3 4 5 6 7 8 9 10 11 12 1 2 3 4 5 6 7 8 9 10 11 12 1
2007 2008 2009 2010
Current Economic Conditions Index Buying Durable Goods Conditions
Job Availability Current Incomes
(Index)
Respondents are getting more optimistic on economic
conditions for the next 6 months.
This improvement was shown by 1.9
points higher of Consumer Expectation Index (CEI) to 122.6 over the previous
perception over their income expectation index in the next 6 months climbed
by 4.3 points.
In annual terms, respondent’s optimism over upcoming
economic conditions significantly mounted.
The index was 16.7 points
higher compared to the previous year. The upward trend was supported by
better respondent’s expectations over economic conditions in the next 6
months as the index rose by 14.8 points. Moreover, this optimism also
affected to job availability and income expectations index for the next 6
months as the index has lifted up by 24.5 and 10.8 points.
Graph 3. Consumer Expectation Index (CEI)
0.0 20.0 40.0 60.0 80.0 100.0 120.0 140.0 160.0
12 1 2 3 4 5 6 7 8 9 10 11 12 1 2 3 4 5 6 7 8 9 10 11 12 1
2007 2008 2009 2010
Consumer Expectation Index Incomes Expectation Economic Expectation Job Availability Expectation
(Index)
Income Expectations
Respondents remained confidence over their income in the next 6
months.
Respondents predicted that their income for the next 6 months will be
better as shown by 4.3 points higher than the previous month
.
Later on, the
leveraging has brought the index to the level of 141.1.
Sound income expectations index was mainly driven by increasing index of
respondents who graduate from senior high school by 7.2 points. Based on
gender, male were more optimistic over income expectation as the index for this
group added by 5.4 points against previous month.
Price Expectations
Pressure on prices in the next 6 months relatively benign.
Respondent’s expectation on prices in the next 6 months still translated to hike
income expectations in
the next 6 months is
still optimistic
that foodstuff group and food, beverages, cigarette and tobacco group were
the predominant factors on price pressure in the next 6 months. Meanwhile,
price expectation index in the next 3 months dropped 0.4 point to 160.6.
Graph 4.
Monthly Inflation and Price Expectation Index for the next 3 and 6 months
-2.0 0.0 2.0 4.0 6.0 8.0 10.0
130.0 140.0 150.0 160.0 170.0 180.0 190.0
5 6 7 8 9 10 11 12 1 2 3 4 5 6 7 8 9 10 11 12 1 2 3 4 5 6 7
2008 2009 2010
Price Expectation 6 month hence Price Expectation 3 month hence Actual Inflation
(Index) % (m-to-m)
Notes
: Index = 100 indicates that consumer expect prices will still be stable, index > 100 indicates
consumer expect prices will increase, and index < 100 indicates consumer expect prices will decrease
Expectations of Savings Interest Rates
Interest rates and saving deposits in the next 6 months were
predicted to relative stable.
Interest rates in the next 6 months were
expected to be higher 1.6 points compared to previous month directing to the
level of 117.9. In the same way, respondent’s expectation on saving deposits in
the next 6 months also went up 3.1 points to 129.8.
Graph. 5
SBI Rate (%), Interest Rate on Savings Deposits (%), and Interest Rate
Expectations Index
0.0 2.0 4.0 6.0 8.0 10.0 12.0 14.0
80.0 90.0 100.0 110.0 120.0 130.0 140.0 150.0
5 6 7 8 9 10 11 12 1 2 3 4 5 6 7 8 9 10 11 12 1 2 3 4 5 6 7
2008 2009 2010
(%)
Interest rate expectation (Index) SBI-1 month Interest Rate of Saving Deposits
(Index)
Graph. 6
Saving Deposits Expectation Index
70.0 80.0 90.0 100.0 110.0 120.0 130.0 140.0 150.0
5 6 7 8 9 10 11 12 1 2 3 4 5 6 7 8 9 10 11 12 1 2 3 4 5 6 7
2008 2009 2010
Saving Deposits Expectation (Index) (Index)
Notes
: Index = 100 indicates that consumer expect saving deposit and interest rate will still be stable,
index > 100 indicates consumer expect saving deposit and interest rate will increase, and index < 100
indicates consumer expect saving deposit and interest rate will decrease
Expectations on Economic Conditions
Respondents were obviously confidence that economic conditions
will continue recovered in the next 6 months.
Respondents remain
optimistic on economic condition in the next 6 months although the index only
rose by 0.6 point over previous month to 122.7. The upward trend was mainly
driven by those who graduated from senior high school and those who spent
Rp.1 -3 millions per month with index for each group added by 3.6 and 2.4
points respectively.
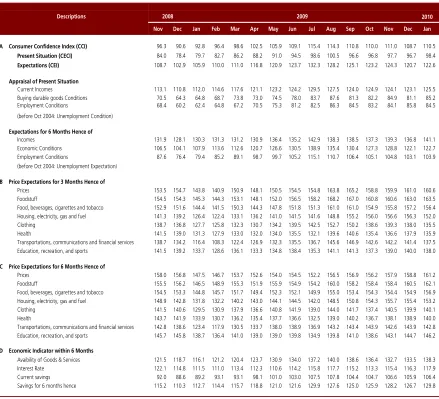
Table 1. Consumer Confidence, Price Expectations, Consumption Plans, and Economic Indicators (Index)
2010 Nov Dec Jan Feb Mar Apr May Jun Jul Aug Sep Oct Nov Dec Jan
A Consumer Confidence Index (CCI) 96.3 90.6 92.8 96.4 98.6 102.5 105.9 109.1 115.4 114.3 110.8 110.0 111.0 108.7 110.5
Present Situation (CECI) 84.0 78.4 79.7 82.7 86.2 88.2 91.0 94.5 98.6 100.5 96.6 96.8 97.7 96.7 98.4
Expectations (CEI) 108.7 102.9 105.9 110.0 111.0 116.8 120.9 123.7 132.3 128.2 125.1 123.2 124.3 120.7 122.6
Appraisal of Present Situation
Current Incomes 113.1 110.8 112.0 114.6 117.6 121.1 123.2 124.2 129.5 127.5 124.0 124.9 124.1 123.1 125.5 Buying durable goods Conditions 70.5 64.3 64.8 68.7 73.8 73.0 74.5 78.0 83.7 87.6 81.3 82.2 84.9 81.1 85.2
Employment Conditions 68.4 60.2 62.4 64.8 67.2 70.5 75.3 81.2 82.5 86.3 84.5 83.2 84.1 85.8 84.5
(before Oct 2004: Unemployment Condition)
Expectations for 6 Months Hence of
Incomes 131.9 128.1 130.3 131.3 131.2 130.9 136.4 135.2 142.9 138.3 138.5 137.3 139.3 136.8 141.1 Economic Conditions 106.5 104.1 107.9 113.6 112.6 120.7 126.6 130.5 138.9 135.4 130.4 127.3 128.8 122.1 122.7 Employment Conditions 87.6 76.4 79.4 85.2 89.1 98.7 99.7 105.2 115.1 110.7 106.4 105.1 104.8 103.1 103.9 (before Oct 2004: Unemployment Expectation)
B Price Expectations for 3 Months Hence of
Prices 153.5 154.7 143.8 140.9 150.9 148.1 150.5 154.5 154.8 163.8 165.2 158.8 159.9 161.0 160.6
Foodstuff 154.5 154.3 145.3 144.3 153.1 148.1 152.0 156.5 158.2 168.2 167.0 160.8 160.6 163.0 163.5 Food, beverages, cigarettes and tobacco 152.9 151.6 144.4 141.5 150.3 144.3 147.8 151.8 151.3 161.0 161.0 154.9 155.8 157.2 156.4 Housing, electricity, gas and fuel 141.3 139.2 126.4 122.4 133.1 136.2 141.0 141.5 141.6 148.8 155.2 156.0 156.6 156.3 152.0 Clothing 138.7 136.8 127.7 125.8 132.3 130.7 134.2 139.5 142.5 152.7 150.2 138.6 139.3 138.0 135.5
Health 141.5 139.0 131.3 127.9 133.0 132.0 134.0 135.5 132.1 139.6 140.6 135.4 136.6 137.9 135.9
Transportations, communications and financial services 138.7 134.2 116.4 108.3 122.4 126.9 132.3 135.5 136.7 145.6 146.9 142.6 142.2 141.4 137.5 Education, recreation, and sports 141.5 139.2 133.7 128.6 136.1 133.3 134.8 138.4 135.3 141.1 141.3 137.3 139.0 140.0 138.0
C Price Expectations for 6 Months Hence of
Prices 158.0 156.8 147.5 146.7 153.7 152.6 154.0 154.5 152.2 156.5 156.9 156.2 157.9 158.8 161.2
Foodstuff 155.5 156.2 146.5 148.9 155.3 151.9 155.9 154.9 154.2 160.0 158.2 158.4 158.4 160.5 162.1 Food, beverages, cigarettes and tobacco 154.5 153.3 144.8 145.7 151.7 149.4 152.3 152.1 149.9 155.0 153.4 154.3 154.4 154.9 156.9 Housing, electricity, gas and fuel 148.9 142.8 131.8 132.2 140.2 143.0 144.1 144.5 142.0 148.5 150.8 154.3 155.7 155.4 153.2 Clothing 141.5 140.6 129.5 130.9 137.9 136.6 140.8 141.9 139.0 144.0 141.7 137.4 140.5 139.9 140.1
Health 143.7 141.9 133.9 130.7 136.2 135.4 137.7 136.6 132.5 139.0 140.2 136.7 138.1 138.9 140.0
Transportations, communications and financial services 142.8 138.6 123.4 117.9 130.5 133.7 138.0 138.9 136.9 143.2 143.4 143.9 142.6 143.9 142.8 Education, recreation, and sports 145.7 145.8 138.7 136.4 141.0 139.0 139.0 139.8 134.9 139.8 141.0 138.6 143.1 144.7 146.2
D Economic Indicator within 6 Months
Avaibility of Goods & Services 121.5 118.7 116.1 121.2 120.4 123.7 130.9 134.0 137.2 140.0 138.6 136.4 132.7 133.5 138.3 Interest Rate 122.1 114.8 111.5 111.0 113.4 112.3 110.6 114.2 115.8 117.7 115.2 113.3 115.4 116.3 117.9 Current savings 92.0 88.6 89.2 93.1 93.1 98.1 101.0 103.0 107.5 107.8 104.4 104.7 106.6 105.9 106.4 Savings for 6 months hence 115.2 110.3 112.7 114.4 115.7 118.8 121.0 121.6 129.9 127.6 125.0 125.9 128.2 126.7 129.8
Table 2. Consumer Confidence by Region (Index)
2010
Nov Dec Jan Feb Mar Apr May Jun Jul Aug Sep Oct Nov Dec Jan
DKI Jakarta
Consumer Confidence Index 94.4 76.9 79.5 76.2 82.7 92.4 98.1 104.5 112.0 105.8 101.2 99.0 105.1 97.2 105.9 Present Situation 69.4 59.7 59.5 56.0 62.6 64.8 68.9 76.4 78.7 80.1 77.2 76.0 81.0 76.3 86.4 Expectations 119.4 94.1 99.5 96.4 102.8 120.1 127.3 132.6 145.3 131.4 125.2 122.0 129.1 118.0 125.4
Bandung
Consumer Confidence Index 76.3 75.0 82.6 80.4 83.4 77.0 93.9 91.9 95.2 100.1 87.7 104.7 105.0 102.4 99.3 Present Situation 65.2 59.7 69.3 62.6 67.3 61.0 76.7 73.7 76.8 83.0 71.7 88.8 87.4 85.3 80.3 Expectations 87.3 90.3 95.8 98.3 99.4 93.0 111.2 110.1 113.7 117.1 103.7 120.6 122.6 119.4 118.2
Semarang
Consumer Confidence Index 82.6 83.0 83.4 96.4 98.8 105.8 108.0 114.6 122.8 115.3 105.8 119.6 112.1 114.7 113.8 Present Situation 72.8 74.9 81.0 85.3 92.6 95.8 100.4 103.6 110.9 109.8 94.4 110.7 101.0 103.4 105.4 Expectations 92.4 91.1 85.9 107.6 105.1 115.8 115.6 125.6 134.8 120.9 117.2 128.4 123.1 126.0 122.1
Surabaya
Consumer Confidence Index 80.1 74.0 82.3 82.4 83.6 86.9 89.3 93.6 100.8 102.9 97.6 103.9 101.2 96.3 103.5 Present Situation 65.1 61.6 63.9 67.3 67.5 70.6 70.8 76.9 81.7 83.2 80.1 88.5 88.4 81.9 93.1 Expectations 95.1 86.5 100.7 97.5 99.7 103.3 107.7 110.2 119.8 122.7 115.0 119.3 114.1 110.7 113.9
Medan
Consumer Confidence Index 91.0 90.3 88.6 92.6 98.1 102.4 104.3 109.8 117.2 114.1 116.2 119.7 116.6 104.7 105.2 Present Situation 75.2 71.5 69.2 72.6 81.4 86.2 88.1 94.2 95.6 97.7 100.8 106.5 103.4 97.0 95.4 Expectations 106.8 109.1 107.9 112.7 114.9 118.5 120.4 125.4 138.9 130.5 131.5 133.0 129.8 112.3 115.0
Palembang
Consumer Confidence Index 106.3 97.3 91.1 102.7 103.7 100.2 102.8 108.6 123.5 123.9 127.8 113.1 121.9 117.8 110.7 Present Situation 96.0 89.9 75.6 87.9 88.7 85.2 91.3 98.0 108.3 110.4 117.6 98.2 112.8 110.2 105.2 Expectations 116.7 104.7 106.7 117.6 118.8 115.1 114.3 119.2 138.7 137.3 138.0 128.0 131.1 125.3 116.2
Banjarmasin
Consumer Confidence Index 104.0 98.1 116.3 115.7 120.2 125.0 127.1 122.5 120.1 120.9 113.1 117.6 121.9 116.2 117.6 Present Situation 101.4 88.5 113.1 113.2 117.9 124.2 124.2 116.9 117.8 114.7 107.4 113.8 118.9 109.4 110.8 Expectations 106.5 107.6 119.6 118.2 122.5 125.8 130.0 128.1 122.4 127.1 118.8 121.5 125.0 122.9 124.4
BandarLampung
Consumer Confidence Index 105.6 96.3 96.9 110.5 108.8 109.3 108.8 116.3 123.3 122.2 110.7 107.3 109.3 104.6 112.9 Present Situation 90.3 78.7 83.0 99.5 103.2 84.3 88.3 96.5 106.3 107.5 93.7 95.3 92.5 92.2 91.7 Expectations 120.8 113.8 110.8 121.5 114.5 134.2 129.2 136.0 140.3 136.8 127.7 119.2 126.0 117.0 134.2
Makassar
Consumer Confidence Index 121.9 110.2 107.0 116.7 106.8 115.1 117.0 129.0 125.6 117.7 116.6 118.4 117.8 118.3 129.6 Present Situation 112.8 97.5 99.7 108.3 94.3 105.5 104.3 120.8 109.7 109.7 107.3 113.5 105.2 110.2 121.7 Expectations 131.0 122.8 114.3 125.0 119.2 124.7 129.7 137.2 141.5 125.7 125.8 123.3 130.3 126.3 137.5
Samarinda
Consumer Confidence Index 106.6 95.3 101.6 100.3 106.2 118.3 113.8 116.3 125.3 121.1 123.3 123.9 110.9 120.5 121.3 Present Situation 92.7 82.8 87.5 87.0 96.2 110.2 100.5 98.2 105.3 108.3 109.0 111.0 97.5 109.7 107.5 Expectations 120.5 107.7 115.7 113.5 116.2 126.3 127.0 134.3 145.2 133.8 137.5 136.8 124.3 131.3 135.0
Denpasar
Consumer Confidence Index 105.3 101.0 72.3 90.2 89.8 97.2 102.6 104.8 102.7 103.6 114.7 103.8 108.3 102.9 103.1 Present Situation 99.5 94.2 65.0 79.3 84.8 89.5 92.5 97.8 88.3 90.3 104.5 94.3 98.7 93.5 94.2 Expectations 111.2 107.8 79.5 101.0 94.7 104.8 112.7 111.8 117.0 116.8 124.8 113.3 117.8 112.3 112.0
Padang
Consumer Confidence Index 84.8 91.8 94.5 94.6 94.4 116.6 99.8 95.9 105.3 100.3 89.7 79.2 79.8 99.2 103.0 Present Situation 73.3 82.3 88.7 85.2 83.5 101.8 89.8 82.3 95.2 87.7 77.7 66.2 66.7 84.8 88.5 Expectations 96.2 101.2 100.3 104.0 105.3 131.3 109.7 109.5 115.3 113.0 101.7 92.2 93.0 113.5 117.5
Pontianak
Consumer Confidence Index 115.7 108.9 113.4 113.9 114.1 117.9 118.0 119.9 127.5 121.1 116.8 123.8 121.0 120.9 123.9 Present Situation 105.0 101.8 103.3 102.8 102.7 108.5 108.8 111.5 117.0 111.5 104.8 115.7 110.7 115.3 114.2 Expectations 126.3 116.0 123.5 125.0 125.5 127.3 127.2 128.3 138.0 130.7 128.7 131.8 131.3 126.5 133.7
Manado
Consumer Confidence Index 94.3 122.4 119.3 104.4 105.9 108.8 128.5 124.9 126.4 139.0 140.2 125.8 121.4 137.1 134.5 Present Situation 92.7 113.0 113.7 101.0 102.8 106.5 115.5 123.5 124.3 132.2 125.5 109.0 112.3 119.0 120.2 Expectations 95.8 131.8 125.0 107.8 109.0 111.0 141.5 126.3 128.5 145.8 154.8 142.5 130.5 155.2 148.8
Mataram
Consumer Confidence Index 104.5 84.7 99.1 115.5 115.9 118.2 114.3 116.3 123.0 125.7 122.9 112.4 121.3 102.1 113.3 Present Situation 96.0 75.3 86.2 102.2 105.7 105.8 107.2 110.2 112.0 116.3 110.2 106.7 108.3 97.5 98.3 Expectations 113.0 94.0 112.0 128.8 126.2 130.5 121.3 122.5 134.0 135.0 135.7 118.2 134.3 106.7 128.2
Pangkal Pinang
Consumer Confidence Index 108.3 97.6 92.6 100.7 108.6 97.1 101.5 112.0 110.3 101.4 102.8 104.0 106.4 108.3 98.3 Present Situation 98.2 81.8 78.0 85.7 95.2 86.0 87.3 101.8 98.7 92.3 97.2 93.8 99.7 104.0 94.5 Expectations 118.5 113.3 107.2 115.7 122.0 108.2 115.7 122.2 122.0 110.5 108.5 114.2 113.2 112.5 102.0
Ambon
Consumer Confidence Index 103.3 107.4 112.3 114.9 118.9 114.0 116.2 111.5 131.9 136.9 135.2 113.2 122.6 120.7 120.0 Present Situation 97.3 103.7 103.8 109.8 110.8 110.3 109.8 102.7 121.4 134.6 126.0 103.7 116.7 114.6 114.3 Expectations 109.2 111.1 120.8 120.0 127.0 117.8 122.5 120.3 142.4 139.2 144.3 122.7 128.6 126.8 125.7
Banten
Consumer Confidence Index 89.8 74.4 81.4 80.5 81.1 88.5 103.4 104.2 112.2 115.9 109.2 106.2 110.2 104.3 95.7 Present Situation 70.1 55.4 54.7 52.2 58.8 57.6 74.7 70.1 78.7 93.2 86.2 82.4 85.5 81.3 77.0 Expectations 109.5 93.5 108.2 108.9 103.4 119.4 132.0 138.3 145.6 138.6 132.2 129.9 134.9 127.3 114.4
2009 2008
Table 3. Respondent Figures (percentages)
2010
Oct Nov Dec Jan Feb Mar Apr May Jun Jul Aug Sep Oct Nov Des Jan
Gender
Male 59.8 59.5 59.6 59.7 62.3 58.8 60.5 60.4 60.3 62.1 59.5 59.8 57.5 57.8 58.3 59.8 Female 40.2 40.5 40.4 40.3 37.7 41.2 39.5 39.6 39.7 37.9 40.5 40.2 42.5 42.2 41.7 40.2
Household Expenses
Rp. 1 million - Rp. 3 million 61.5 61.3 60.9 59.1 58.4 60.6 58.8 59.1 58.7 60.3 60.5 59.5 60.9 60.2 59.4 58.7 Rp. 3 million - Rp. 5 million 28.6 27.6 27.8 29.2 29.8 28.6 28.9 29.4 29.7 29.0 29.1 30.1 28.3 28.4 29.7 30.9 Rp. 5 million and over 9.9 11.1 11.3 11.6 11.8 10.8 12.3 11.5 11.6 10.7 10.3 10.4 10.7 11.4 11.0 10.4
Ages
20-40 years 55.4 56.1 57.0 59.2 58.7 62.4 59.9 59.0 60.3 58.4 62.0 58.5 61.1 63.9 62.2 57.6 41-60 years 40.7 40.1 40.1 37.6 38.4 34.9 36.6 38.0 36.3 38.8 34.6 38.3 35.9 33.0 34.2 38.4 60 years above 3.9 3.7 2.9 3.2 2.9 2.7 3.4 3.1 3.3 2.8 3.4 3.2 3.0 3.1 3.6 3.9
Educational Level
High School 47.4 47.9 49.5 48.8 48.5 49.3 48.2 47.7 48.4 48.6 48.7 48.4 47.7 47.7 47.6 45.9 Diploma 13.2 13.1 11.5 13.9 14.9 13.8 14.1 12.5 13.0 12.9 12.9 13.1 13.4 12.9 13.2 13.4 University 33.9 33.7 32.8 32.8 32.3 32.4 32.8 34.2 34.5 33.6 33.3 34.0 34.4 35.2 34.6 35.4 Graduate/Post Graduate 5.5 5.3 6.3 4.5 4.3 4.5 4.9 5.5 4.1 4.9 5.1 4.5 4.5 4.2 4.6 5.3
2009 2008