EXPLORING PUBLIC PERCEPTION OF PARATRANSIT SERVICE
USING BINOMIAL LOGISTIC REGRESSION
Tri Basuki Joewonoa* and Hisashi Kubotab
(a) Department of Civil Engineering, Faculty of Engineering, Parahyangan Catholic University,
Bandung, Indonesia.
(Currently in Graduate School of Science and Engineering, Saitama University, Japan) Email: [email protected]; [email protected]
(b) Department of Civil & Environmental Engineering, Graduate School of Science and Engineering, Saitama
University, Saitama-shi, Japan. Email: [email protected]
*Corresponding author
ABSTRACT
Knowledge of the market is a requirement for a successful provision of public transportation. This study aims to explore public perception of paratransit service, as represented by the user and non-user of paratransit. The analysis has been conducted based on the public’s response, by creating several binomial logistic regression models using the public perception of the quality of service, quality of car, quality of driver, and fare. These models illustrate the characteristics and important variables to establish whether the public will use more paratransit in the future once improvements will have been made. Moreover, several models are developed to explore public perception in order to find out whether they agree to the replacement of paratransit with other types of transportation modes. All models are well fitting. These models are able to explain the respondents’ characteristics and to reveal their actual perception of the operation of paratransit. This study provides a useful tool to know the market in greater depth.
Keywords: paratransit, public perception, binomial logistic regression.
INTRODUCTION
Public transport is a vital element in mobility, since an appropriate provision of service will create a wide benefit to the community [1] and a key component of any pro-poor urban transport agenda in a developing city [2]. However, public transportation agencies today are facing a significant challenge to maintain ridership [3], and to attract potential passengers. It is imperative to provide a proper mode of public transportation for the right target markets, and the agency should develop a unique marketing strategy to appeal to the selected target market(s) [4].
The notion of the target market can be obtained by exploring the traveler’s decision process in choosing a certain type of transport mode. The process involves a consideration of many aspects, where in fact, there is a role of human perceptions in determining the mode of transport choices. Mokhtarian [5] stated that the internal decision-making process being considered is initiated by some threshold level of
Note: Discussion is expected before June, 1st 2007, and will be published in the “Civil Engineering Dimension” volume 9, number 2, September 2007.
Received 3 October 2006; revised 28 November 2006; accepted 30 November 2006.
dissatisfaction with one or more aspects of life. The consideration of public perceptions is a way to the understanding of users’ needs in greater depth, which is useful as a base or guidance to improve services, as well as a model prediction. The authors believe that applying this approach is beneficial to the case of paratransit.
In developing cities, paratransit is one of the choices of public transport. In Asian and African cities, paratransit dominates the local public transport (LPT), which in addition to minibuses, rebuilt pickups or vans, also makes use of tricycles and bicycles [6]. This mode is one of the most notable features of the public transport sector in the developing and transitional economies in recent years, whose number has grown very rapidly outside the traditional public transport regulatory system [7]. Market-oriented economists give this mode a very positive evaluation, since paratransit usually requires no public investment or subsidy and very little intervention by the government, and its supply
responds to demand in a short period of time.On the
rather than a system that can be planned and controlled [8]. Moreover, paratransit has an image that is related to poverty, while the World Bank [7] stated that this informal sector is often viewed as a nuisance by national and municipal transport authorities. This contradictory situation led many parties to shift their preference to a more modern and high-tech mode of transport, rather than trying to improve the existing condition.
This study aims to explore the public perception of paratransit in Indonesian cities. The study made a questionnaire-based survey distributed to the user and non-user of paratransit in the City of Bandung, Indonesia. Based on the users’ response, the analysis to explore the acceptance of this mode has been conducted by creating a binomial logistic regression model.
PARATRANSIT
Paratransit is a public mode of transport with a fixed route within the city’s network, but without a fixed schedule. It is available to everyone, which is different from the American context that associates with government-subsidized transport for the elderly or handicapped. Paratransit operates in mixed traffic with other road users. The category of paratransit includes various transport modes. In terms of characteristics, paratransit falls between private cars and transit, where it plays a complementary role to that of the car and transit [9]. Further explanation of operating characteristics of para-transit can be found in Joewono and Kubota [10]. Paratransit services are usually provided by infor-mal operators, usually operating as single-person enterprises [7]. This informality and unregulated characteristics of paratransit reflect many advan-tages and disadvanadvan-tages [7, 8]. Although in reality individuals or small private enterprises operate this mode, cooperations or regulators also exist. For example, no car in Bandung can operate on those designated routes in Bandung unless the owner or driver becomes a member of one of the available cooperations, where each cooperation maintains an effective monopoly on its designated routes [11].
By way of comparison, paratransit can easily be found in many cities in Asian and African countries. Table 1 shows the share of paratransit in Asia and Africa. The mode share of the extended modal split in the developing countries is approximately 40-50% (70-80% of the motorized transport), while in poorer cities of developing countries the share amounts to a mere 10-15% (20% of the motorized modal split) [6].
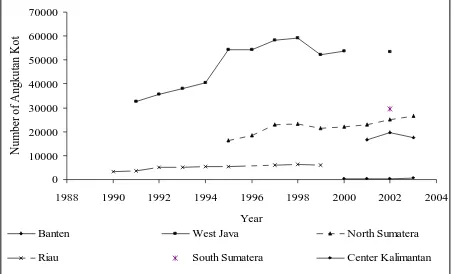
The existence of paratransit in Indonesia is illus-trated in Figure 1 and Figure 2. The source of the
data is collected from Badan Pusat Statistik (BPS)
[12-18] and the city’s website [19-24]. The number of
paratransit in several provinces from 1990 to 2003 is shown in Figure 1. The fleet size is in the range of hundreds up to 60,000 units per province. In comparison with Manila, the overall modal share of trips with motorized tricycles and jeepneys is 52%, which employs approximately 210,000 people (almost half of all employees in urban passenger and goods transport)[25, 6]. Moreover, paratransit covers around 46% of the total urban public transportation in approximately 60 cities in Indonesia, as can be seen in Figure 2.
1988 1990 1992 1994 1996 1998 2000 2002 2004
Year
Banten West Java North Sumatera
Riau South Sumatera Center Kalimantan
Figure 1. Number of Angkutan Kota in Several Provinces in Indonesia
0 10000 20000 30000 40000
Number of Public Transportation
Nu
Figure 2. Number of Angkutan Kota and Public Transportation in Several Cities
PUBLIC PERCEPTION
Data Collection
This sample size was chosen as the representation of the available route, not to represent the population of Bandung. This survey also collected 99 users of other modes, who did not ride paratransit. The author selected this number to equate the size with the user. Respondents were selected using the simple random sampling method.
The questionnaire consists of eight sections. The first section asks general questions regarding social economic and trip information. The last seven sections inquire into the public perception of the service of the mode, supporting facilities, driver, vehicle, fare, regulation, and future condition. Each section comprises several questions, which consist of closed questions (i.e. the public is asked to rate the condition from 1 (very bad) to 5 (very good) or to choose yes/no options) and a small number of open questions (e.g. dealing with age).
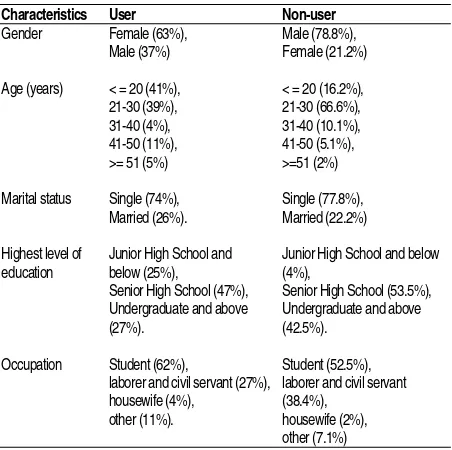
Respondent Characteristics
The general characteristics of the respondents are provided in Table 2. Trip characteristics for both user and non-user are illustrated in Table 3. It illustrates that paratransit is the main mode for 80% of the users, while a private car is the main mode for approximately 40% of the non-users. The table explains that the number of trips per day for users and non-users is similar, which is also the case in terms of trip purpose and travel distance. When it comes to travel cost, the non-user spends higher amounts of money. It is interesting to note that the trip purpose for traveling using paratransit is for study reasons. Moreover, it is surprising to notice that the user and non-user perceive paratransit as an important urban transport mode in this city.
MODELING
Methods
In this piece of research, the analysis was conducted by building a model using the logistic regression model (also known as the logit model). One use of logit model is to classify observations, where its main competitor is discriminant analysis [26]. The logistic regression model overcomes the major disad-vantages of the linear regression model for dicho-tomous dependent variables. Like linear regression, the logistic model relates one or more predictor variables to a dependent variable. The logistic model yields regression coefficients, predicted values, and residuals. Moreover, the predictors in a logistic model can be continuous or non-continuous. In logistic regression, the relationship between the predictor and the predicted values is assumed to be nonlinear. The logistic curve is S-shaped or sigmoidal. The curve never falls below 0 or reaches above 1. Thus, the predicted values obtained using the logistic model can always be interpreted as probabilities [27].
The procedure that calculates the logistic coefficient compares the probability of an event occurring with the probability of its not occurring. This odds ratio can be expressed as [28]:
0 1 1 n n
(event) B + B X +...+ B X
(no event)
Prob
= e
Prob (1)
The estimated coefficients (B0, B1, B2, . . ., Bn) are
actually measures of the changes in the ratio of the probabilities, termed the odds ratio. Moreover, they are expressed in logarithms, so they need to be transformed back (the antilog of the value has to be taken) so that their relative effect on the
proba-Table 1. Model Split of Paratransit in Some Asian and African Cities [6] Modal Split in urban transport of selected African cities (in % of all trips)
Dakar Ouagadougou Cairo Dar Es Salaam Nairobi
Number of inhabitants (thousands) 1,801 716 14,524 1,436 1,598
NMT (non motorized transport) 46 52 36 49 48
Walking 44 42 36 46 47
Bicycle (others) 2 10 0 3 1
LPT (local public transport) 45 3 47 42 42
MPT (motorized private transport) 9 45 17 9 10
Motorbike, etc. 3 39 4 2 2
Car 6 6 13 7 8
Modal Split in urban transport of selected Asian cities (in % of incidents of transport)
Dhaka Surabaya Jakarta Bangalore Chennai Shanghai Phnom-Penh Manila Hanoi Bangkok
Number of inhabitants (thousands)
9,000 2,473 13,048 4,472 5,651 13,000 920 9,286 2,155 5,648
NMT 60 43 36 56 42 65 51 8 71 17
Walking 22 20 23 43 22 38 7 8 8 17
Bicycle (others) 38 23 13 13 20 27 44 63 0
LPT 32 15 26 34 50 28 30 68 3 58
bilities is assessed more easily. Use of this procedure does not change in any manner the way we interpret the sign of the coefficient. A positive coefficient increases the probability, whereas a negative value decreases the predicted probability.
Table 2 General Characteristics of the Respondents
Characteristics User Non-user
Gender Female (63%),
Marital status Single (74%), Married (26%).
Single (77.8%), Married (22.2%)
Highest level of education
Junior High School and below (25%),
Senior High School (47%), Undergraduate and above (27%).
Junior High School and below (4%),
Senior High School (53.5%), Undergraduate and above (42.5%).
Occupation Student (62%),
laborer and civil servant (27%), housewife (4%),
other (11%).
Student (52.5%), laborer and civil servant (38.4%),
housewife (2%), other (7.1%)
Table 3 Trip Characteristics of the Respondents
Characteristics User Non-user
Family’s car passenger cars in household
Paratransit (80%), other (20%)
Private car (40.4%), Motorbike (50.5%), other (9.1%)
Number of trips per day using the distance using the mode (km)
Average travel cost (IDR)
Level of importance of paratransit as urban transport mode
Very unimportant (2%), Fair (17%),
Important (45%), Very Important (36%)
Very unimportant (2%), Fair (28.3%), Important (51.5%), Very Important (18.2%)
Logistic regression measures model estimation fit with the value of -2 times the log of the likelihood value (-2LL or -2 log likelihood), where the minimum value for -2LL is 0 which corresponds to a perfect fit [29]. In addition, in this article, the goodness-of-fit of the model is represented by Hosmer and show’s goodness-of-fit test. If Hosmer and Leme-show’s goodness-of-fit test is greater than 0.05, as we want for well fitting models, we fail to reject the null hypothesis that there is no difference between observed and model-predicted values, implying that the model’s estimates fit the data at an acceptable
level [30]. In addition, the R2 of this model is
explained by two types of R2, namely Cox and Snell
R2 and Nagelkerke R2 [31].
Models
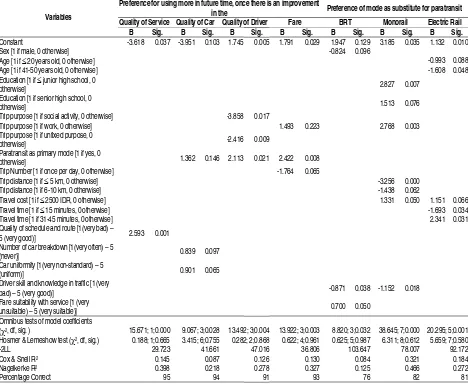
Table 4 shows models based on user perception, while Table 5 shows models based on non-user perception. In this study, there are four aspects of paratransit operation i.e. quality of service, quality of car, quality of driver, and fare, and three substitute modes i.e. bus (BRT, bus rapid transit), monorail (MRT, mass rapid transit), and electric rail (LRT, light rail transit). Four models explain charac-teristics of the user to establish whether the user would use more paratransit in the future once improvements have been made in the quality of service, quality of car, quality of driver, or fare. In addition, three models illustrate users’ charac-teristics regarding their agreement to the replace-ment of paratransit with other modes of transport (i.e. bus, monorail, or electric rail modes).
The omnibus tests of model coefficients (χ2) for all
models in Table 4 and Table 5 has a very low significance level (<<0.05), which means the model is significantly different from the one with the constant only. In addition, Hosmer and Lemeshow’s goodness-of-fit test for all models in Table 4 is far greater than 0.05, which means the failure to reject the null hypothesis that there is no difference between observed and model-predicted values. It implies that the model’s estimates fit the data at an acceptable level. The models based on user perception have a high percentage of correctness (i.e. 77% - 95%), and the models based on non-user perception have quite a high percentage of correctness (i.e. 70.7% - 81.8%).
All models have a low Cox and Snell R2 and
Nagelkerke R2 but the models can be accepted as
well fitted, as Garson [30] said that R2-like measures
Preference for Using More Paratransit in The Future
Table 4 illustrates four models explaining the characteristics of users, to establish whether they will use more paratransit when there is an improvement. It is surprising to notice that the significant variables in the models only cover the trip characteristics and aspects of service quality. Users who use paratransit as their primary mode tend to be more concerned about the improvement of paratransit. In addition, passengers making trips with a fixed purpose and at a higher frequency tend to be more concerned about fare adjustment. The quality of schedule, number of car breakdown, and car uniformity are the significant aspects of service quality. These findings underline the fact that the users’ decision for future use depends highly on trip purpose and frequency including their dependence on this mode. It reveals the notion of the so-called captivity of the current users to this mode.
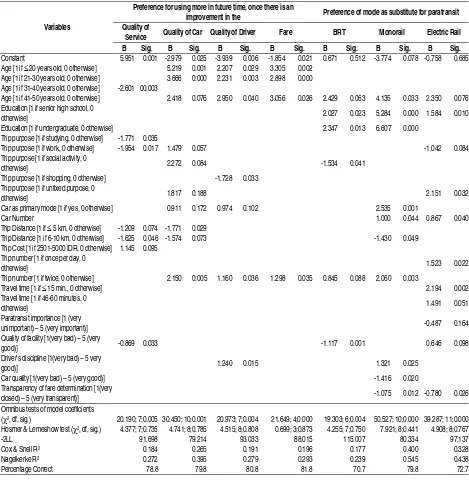
By way of comparison, Table 5 illustrates the non-user characteristics to establish whether they will move and use more paratransit when there is an improvement. Younger respondents (20 years old or under) are more concerned about the quality of car, while older respondents (41-50 years old) care more about the quality of the driver. Both of them tend to be more concerned about fare adjustment for future mode change. If there is an improvement in the quality of car, the persons with fixed trip purposes such as work, social activities, and non-fixed trip purposes show a similar preference for using paratransit in the future. The improvement in the quality of car and driver seems to be more attractive for the person who at present uses a private car as his/her primary mode, although the attractiveness lies in long-distance trips only. The respondents with low trip expenses that make trips twice a day are more willing to use paratransit. The improvement in the quality of facility and driver’s discipline are the aspects of service quality crucial to attracting the shifting of non-users to paratransit.
Table 4 Model based on User Perception
Preference for using more in future time, once there is an improvement
in the Preference of mode as substitute for paratransit
Quality of Service Quality of Car Quality of Driver Fare BRT Monorail Electric Rail
Variables
B Sig. B Sig. B Sig. B Sig. B Sig. B Sig. B Sig.
Constant -3.618 0.037 -3.951 0.103 1.745 0.005 1.791 0.029 1.947 0.129 3.185 0.035 1.132 0.010
Sex [1 if male, 0 otherwise] -0.824 0.096
Age [1 if ≤ 20 years old, 0 otherwise] -0.993 0.088
Age [1 if 41-50 years old, 0 otherwise] -1.608 0.048
Education [1 if ≤ junior high school, 0
otherwise] 2.827 0.007
Education [1 if senior high school, 0
otherwise] 1.513 0.076
Trip purpose [1 if social activity, 0 otherwise] -3.858 0.017
Trip purpose [1 if work, 0 otherwise] 1.493 0.223 2.768 0.003
Trip purpose [1 if unfixed purpose, 0
otherwise] -2.416 0.009
Paratransit as primary mode [1 if yes, 0
otherwise] 1.362 0.146 2.113 0.021 2.422 0.008
Trip Number [1 if once per day, 0 otherwise] -1.764 0.065
Trip distance [1 if ≤ 5 km, 0 otherwise] -3.256 0.000
Trip distance [1 if 6-10 km, 0 otherwise] -1.438 0.062
Travel cost [1 if ≤ 2500 IDR, 0 otherwise] 1.331 0.050 1.151 0.066
Travel time [1 if ≤ 15 minutes, 0 otherwise] -1.693 0.034
Travel time [1 if 31-45 minutes, 0 otherwise] 2.341 0.031
Quality of schedule and route [1(very bad) –
5 (very good)] 2.593 0.001
Number of car breakdown [1(very often) – 5
(never)] 0.839 0.097
Car uniformity [1(very non-standard) – 5
(uniform)] 0.901 0.065
Driver skill and knowledge in traffic [1 (very
bad) – 5 (very good)] -0.871 0.038 -1.152 0.018
Fare suitability with service [1 (very
unsuitable) – 5 (very suitable)] 0.700 0.050
Omnibus tests of model coefficients
(χ2, df, sig. ) 15.671; 1;0.000 9.067; 3;0.028 13.492; 3;0.004 13.922; 3;0.003 8.820; 3;0.032 38.645; 7;0.000 20.295; 5;0.001
Hosmer & Lemeshow test (χ2, df, sig.) 0.188; 1;0.665 3.415; 6;0.755 0.282; 2;0.868 0.622; 4;0.961 0.625; 5;0.987 6.311; 8;0.612 5.659; 7;0.580
-2LL 29.723 41.661 47.016 36.806 103.647 78.007 92.172
Cox & Snell R2 0.145 0.087 0.126 0.130 0.084 0.321 0.184
Nagelkerke R2 0.398 0.218 0.278 0.327 0.125 0.466 0.272
Preference for Substitute Mode
Table 4 also shows three models regarding users’ agreement to the replacement of the paratransit with other modes of transport. The models explain that females tend to show a higher preference for buses (BRT), while younger users (20 years old or under) and mature users (41-50 years old) are less likely to choose the electric rail mode (LRT). Those users with junior and senior high school as their highest level of education that used paratransit to travel to and from work tend to choose the monorail mode. The model also illustrates that users making longer trips (of more than 10 km) are more willing to opt for the monorail mode, while the electric rail mode is preferred by users spending medium travel
time (of more than 15 minutes). It is surprising to notice that even the current user, who has been spending a low amount of money on trips, is likely to agree to the replacement of paratransit with a rail-based mode. It can also be concluded from the model that the main reason for mode replacement is the lamentable skill of the driver of paratransit in traffic. In addition, the user that rates the fare of para-transit as suitable agrees to the replacement of paratransit with BRT.
Three models in Table 5 explain non-user perception
of the substitute mode of paratransit. Older
respondents (41-50 years old) tend to agree to the replacement of paratransit with any other modes. This is also the case for the respondents with senior
Table 5 Model based on Non-user Perception
Preference for using more in future time, once there is an
improvement in the Preference of mode as substitute for paratransit
Quality of
Service Quality of Car Quality of Driver Fare BRT Monorail Electric Rail
Variables
B Sig. B Sig. B Sig. B Sig. B Sig. B Sig. B Sig.
Constant 5.951 0.001 -2.979 0.025 -3.939 0.006 -1.854 0.021 0.671 0.512 -3.774 0.078 -0.758 0.685 Age [1 if ≤ 20 years old, 0 otherwise] 5.219 0.001 2.207 0.029 3.305 0.002
Age [1 if 21-30 years old, 0 otherwise] 3.666 0.000 2.231 0.003 2.898 0.000 Age [1 if 31-40 years old, 0 otherwise] -2.601 00.003
Age [1 if 41-50 years old, 0 otherwise] 2.418 0.076 2.950 0.040 3.056 0.026 2.429 0.063 4.135 0.033 2.350 0.076 Education [1 if senior high school, 0
otherwise] 2.027 0.023 5.284 0.000 1.584 0.010
Education [1 if undergraduate, 0 otherwise] 2.347 0.013 6.607 0.000
Trip purpose [1 if studying, 0 otherwise] -1.771 0.035
Trip purpose [1 if work, 0 otherwise] -1.954 0.017 1.479 0.057 -1.042 0.084
Trip purpose [1 if social activity, 0
otherwise] 2.272 0.084 -1.534 0.041
Trip purpose [1 if shopping, 0 otherwise] -1.728 0.033 Trip purpose [1 if unfixed purpose, 0
otherwise] 1.817 0.188 2.151 0.032
Car as primary mode [1 if yes, 0 otherwise] 0.911 0.172 0.974 0.102 2.535 0.001
Car Number 1.000 0.044 0.867 0.040
Trip Distance [1 if ≤ 5 km, 0 otherwise] -1.209 0.074 -1.771 0.029
Trip Distance [1 if 6-10 km, 0 otherwise] -1.625 0.046 -1.574 0.073 -1.430 0.049
Trip Cost [1 if 2501-5000 IDR, 0 otherwise] 1.145 0.095 Trip number [1 if once per day, 0
otherwise] 1.523 0.022
Trip number [1 if twice, 0 otherwise] 2.150 0.005 1.160 0.036 1.298 0.035 0.845 0.088 2.060 0.003
Travel time [1 if ≤ 15 min., 0 otherwise] 2.194 0.002
Travel time [1 if 46-60 minutes, 0
otherwise] 1.491 0.051
Paratransit importance [1 (very
unimportant) – 5 (very important)] -0.487 0.164
Quality of facility [1(very bad) – 5 (very
good)] -0.869 0.033 -1.117 0.001 0.646 0.098
Driver’s discipline [1(very bad) – 5 very
good)] 1.240 0.015 1.321 0.025
Car quality [1(very bad) – 5 (very good)] -1.416 0.020
Transparency of fare determination [1(very
closed) – 5 (very transparent)] -1.075 0.012 -0.780 0.026
Omnibus tests of model coefficients
(χ2, df, sig.) 20.190; 7;0.005 30.450; 10;0.001 20.973; 7;0.004 21.649; 4;0.000 19.303; 6;0.004 50.527; 10;0.000 39.287; 11;0.000
Hosmer & Lemeshow test (χ2, df, sig.) 4.377; 7;0.735 4.741; 8;0.785 4.515; 8;0.808 0.699; 3;0.873 4.255; 7;0.750 7.921; 8;0.441 4.908; 8;0.767
-2LL 91.698 79.214 93.033 88.015 115.007 80.334 97.137
Cox & Snell R2 0.184 0.265 0.191 0.196 0.177 0.400 0.328
Nagelkerke R2 0.272 0.395 0.279 0.293 0.239 0.545 0.438
high school diplomas or Bachelor’s degrees as their highest level of education. Respondents with a non-fixed trip purpose seem to be concerned about replacing the mode. Moreover, respondents who use automobiles as their primary mode of transport and owners of a number of automobiles seem to be concerned about replacing paratransit with a rail-based mode. Respondents that travel frequently and whose travel time is approximately 15 minutes or more, tend to show a higher preference for mode replacement. It is understandable that respondent rating the existing paratransit as less important are more likely to accept mode replacement. The model also explains that the respondents’ rating of the car quality and fare determination is related to their preference.
DISCUSSION AND CONCLUSIONS
Given the importance of paratransit both as an income generator and, quite often, as a service provider to the underprivileged, any attempt to eliminate this particular mode by administrative action could generate significant unrest. Keeping this in mind, repression is not a likely solution to the perceived problems [7]. Thus, this study tries to explore the public perception of the real condition of paratransit operation to confirm the future of this mode from the public’s specific point of view. Based on this public perception, as represented by users and non-users of paratransit in Bandung, several binomial logistic regressions have been developed as a way to explore the characteristics of the public that has shown a preference for this mode.
Based on user and non-user perceptions, the models are able to illustrate the public’s characteristics, which reveal a preference for using paratransit in the future once there is an improvement. The models underline the factual existence of captive riders that have been relying heavily on this mode. It can also be noticed from the model that the current users tend to be more concerned about the financial aspect. In addition, the model explains the potential of mode shifting to this mode, once some improvements are implemented. The models also reveal some aspects of service quality (i.e. fare, the quality of car and driver, and quality of facility), which are important as a requirement for the public to continue their use or move to this mode.
In order to explore the future of paratransit, some questions are presented to the respondents regarding the substitute modes for paratransit. The models are also constructed to explore the characteristics of current users as well as non-users, who prefer to shift from paratransit to these new modes. These models are useful to illustrate important aspects sought by the travelers involved.
Finally, it can be concluded that this approach is able to reveal the public characteristics and public requirements for the operation of paratransit. Moreover, this approach can also be used to predict the future conditions, once some changes will have taken place. On the other hand, this study has illustrated the pilot case of public involvement. This is crucial practice, as the current practice rarely incorporates the public as the main object in urban transport planning and evaluation. The authors argue that when the authority applies a best practice from developed countries to be applied to Indonesia’s urban areas, the local condition should be considered carefully. The different in local content and characteristics will differentiate urban transport solutions in developed and developing cities. In this way, using the ideas and practices as shown by this study, further and wider public involvement in planning urban transport policy is needed.
Acknowledgements:
The authors wish to express their gratitude to all staff at Badan PusatStatistik (BPS) in several cities in Indonesia, who have provided all data needed for this research project. All parties involved in the survey are also highly appreciated.
REFERENCES
1. Litman, T., Mobility Management, Sustainable
Transport, A Sourcebook for Policy-makers in Developing Cities, Module 2, Deutsche Gessells-chaft für Technische Zusammenarbeit (GTZ)
GmbH, Division 44 Environmental
Manage-ment, Water, Energy, Transport, Eschborn, 2003.
2. Fjellstrom, K., Sourcebook Overview and
Cross-Cutting Issues of Urban Transport, Introductory Module, Sustainable Transport: A Sourcebook for Policy-makers in Developing Cities, Deutsche Gesellschaft für Technische Zusammenarbeit (GTZ) GmbH, Eschborn, 2002.
3. Transportation Research Board, A Handbook:
Integrating Market Research into Transit
Management, TCRP Report 37, Washington,
D.C., 1998.
4. Transportation Research Board, A Handbook:
Using Market Segmentation to Increase Transit Ridership, TCRP Report 36, Washington, D.C., 1998.
5. Mokhtarian, P.L., Modeling The Desire to
6. Kaltheier, R.M., Urban Transport and Poverty in Developing Countries, Analysis and Options for Transport Policy and Planning, Division 44 Environmental Management, Water, Energy, Deutsche Gessellschaft für Technische Zusa-mmenarbeit (GTZ) GmbH, Transport, Eschborn, 2002.
7. World Bank, Cities on The Move, A World Bank
Urban Transport Strategy Review, Washington, D.C., 2002.
8. Vuchic, V.R., Urban transit: Operations, planing, and economics. John Wiley & Sons, Inc. New Jersey. 2005.
9. Vuchic, V.R., Transportation for livable cities.
Center for Urban policy Research, Rutgers, The State University of New Jersey. New Jersey. 1999.
10. Joewono, T.B. and Kubota, H., The Charac-teristics of Paratransit and Non-motorized
Transport in Bandung, Indonesia, Journal of
Eastern Asia Society for Transportation Studies (EASTS) 6, 2005, pp. 262-277.
11. Departemen Permukiman dan Prasarana
Wila-yah, DepKim PrasWil, Urban Public Transport
Policies in Bandung, Final Report, SURIP-1A, TF-25207, (Japanese Grant) and IBRD Loan No. 4054-IND, The Louis Berger Group Inc. and PT. Eskapindo Matra, 2002. (In Indonesian)
12. Badan Pusat Statistik (BPS), Samarinda in
Figures, 2002.
13. Badan Pusat Statistik (BPS), Gorontalo in
Figures, 2003.
14. Badan Pusat Statistik (BPS), Pandeglang in
Figures, 2001- 2003.
15. Badan Pusat Statistik (BPS), Lebak in Figures
2001 - 2003.
16. Badan Pusat Statistik (BPS), Serang in Figures
2000 - 2003.
17. Badan Pusat Statistik (BPS), Riau in Figures
1990 - 1999.
18. Badan Pusat Statistik (BPS), West Java in
Figures 1990 - 2002.
19. http://www.bandung.go.id/downloaded in 24 November 2004.
20. http://www.sekitarkita.com/2004_03/2004_03_al at%20transport%20bogor_andre.htm
21. http://www.bandung.go.id/dishub/data.htm
22. http://rudyct.tripod.com/sem1_023/m_yafiz.htm
23. http://www.denpasar.go.id/
24. http://www.makassar.go.id/data/perhubungan.ht ml
25. Cal, P.C., Impacts of Urban Transport on the
Poor in Manila, WB UTS Review, Yokohama
Conference, 12/2000.
26. Kennedy, P., A Guide to Econometrics, Fifth
Edition, MIT Press, Cambridge, Massachusetts, 2003.
27. Wright, R.E., Logistic Regression, Reading and
Understanding Multivariate Statistics, Grimm L.R., and Yarnold, P.R. (Ed.), American Psychological Association, Washington, D.C., 1995.
28. Hair, J.F., Anderson, R.E., Tatham, R.L., and Black, W.C., Multivariate Data Analysis, 5th ed.
International Edition. Prentice-Hall Internatio-nal, Inc. New Jersey, 1998.
29. Hair, J.F., Black, W.C., Babin, B.J., Anderson,
R.E., and Tatham, R.L., Multivariate Data
Analysis, 6th ed. Pearson Education, Inc., New
Jersey, 2006.
30. Garson, G.D., Logistic Regression, PA 765:
Quantitative Research in Public Administration, North Carolina State University, Raleigh, 2006, in http://www2.chass.ncsu.edu/garson/pa765/ logistic.htm. Accessed on 18 February, 2006.
31. Newsom, J., More on Model Fit and Significance
![Table 1. Model Split of Paratransit in Some Asian and African Cities [6]](https://thumb-ap.123doks.com/thumbv2/123dok/3649863.1465392/3.595.63.535.95.308/table-model-split-paratransit-asian-african-cities.webp)