PERCEPTION MODELLING OF VISITORS IN VARGAS MUSEUM USING
AGENT-BASED SIMULATION AND VISIBILITY ANALYSIS
Bienvenido G. Carcellar III a
Department of Geodetic Engineering, College of Engineering, University of the Philippines – Diliman ([email protected])
KEY WORDS: GIS, Perception Modelling, Agent-Based Simulation, Museum Management, GAMA
ABSTRACT:
Museum exhibit management is one of the usual undertakings of museum facilitators. Art works must be strategically placed to achieve maximum viewing from the visitors. The positioning of the artworks also highly influences the quality of experience of the visitors. One solution in such problems is to utilize GIS and Agent-Based Modelling (ABM). In ABM, persistent interacting objects are modelled as agents. These agents are given attributes and behaviors that describe their properties as well as their motion. In this study, ABM approach that incorporates GIS is utilized to perform analyticcal assessment on the placement of the artworks in the Vargas Museum. GIS serves as the backbone for the spatial aspect of the simulation such as the placement of the artwork exhibits, as well as possible obstructions to perception such as the columns, walls, and panel boards. Visibility Analysis is also done to the model in GIS to assess the overall visibility of the artworks. The ABM is done using the initial GIS outputs and GAMA, an open source ABM software. Visitors are modelled as agents, moving inside the museum following a specific decision tree. The simulation is done in three use cases: the 10%, 20%, and 30% chance of having a visitor in the next minute. For the case of the said museum, the 10% chance is determined to be the closest simulation case to the actual and the recommended minimum time to achieve a maximum artwork perception is 1 hour and 40 minutes. Initial assessment of the results shows that even after 3 hours of simulation, small parts of the exhibit show lack of viewers, due to its distance from the entrance. A more detailed decision tree for the visitor agents can be incorporated to have a more realistic simulation.
1. INTRODUCTION
1.1 Background
Visiting museums is one of the activities people do to learn more about a subject area such as history, art, or science. In most cases, museums have a number of exhibits and artwork. The bottom line in visiting museums is that the visitors want to maximize their viewing experience given some time constraint. The viewing experience of the visitors often depend on the time restrictions, their interests, the space of the museum, and mostly the tiredness that occurs when touring around the museum. (Lykourentzou, et al, 2013)
For the visitors, their goal is to maximize their viewing experience given their available time. For the museum managing team, they want to aid visitors in achieving this high quality of experience, as well as making sure that the artwork exhibits are viewed by the visitors. (Lykourentzou, et al, 2013)
To effectively analyze if the installed artworks are well arranged spatially, perception modelling of museum visitors can be done. In this concept, the visitors and the artworks are modelled inside a simulated environment. The visitors will decide which artwork to view next mainly based on their instantaneous perceived area.
1.2 Objectives and Expected Output
This paper aims to develop a model for assessment of visitor perceptions on the installed artworks in a museum. This model will be implemented using GAMA, an agent-based modelling software capable of incorporating GIS in BIM. This model will be tested to the chosen study area, which is the Vargas Museum.
Specifically, this study will create a 3-Dimensional GIS model of the second floor of the Vargas Museum. The model will also utilize an agent based simulation of the flow of the visitors, as well as to model the visitor count for each art work. Lastly, the model aims to generate visibility heat maps that can be used as an aid to the management of the Museum.
In this paper, Visibility Analysis and Agent Based Simulation are performed over the main exhibit of Vargas Museum in order to assess the perception of each of the artwork of the exhibits.
1.3 Scope and Limitations
This paper will be modelling the flow and perception of the visitors of the second floor of the Vargas Museum, which was the main exhibit of the museum before its renovation. The research aims to model the flow of visitors in utilizing GAMA platform version 1.7.
The 3D Model of the second floor, as well as the 2D model was generated from the given floor plan from the University Office of the Campus Architect. The overall CAD file, however only contains bare floor plan. It does not include the locations of the exhibits and artworks. The location of the art installations were ground validated and placed in the floor plan by the researcher.
The constraints and parameter values used in the simulation were gathered from the summary of the Art Perception Survey results, from a sample size of 31 respondents. The simulation parameter values were consulted to Ms. Veronica Fuentes (museum assistant) and Dr. Patrick D. Flores (museum curator) last May 20, 2016.
This contribution has been peer-reviewed.
2. REVIEWOFLITERATURE
2.1 Visitor Movement in Museums
Numerous literatures have been done to further assess the experience of users in museum visits. The GPS has been one of the main technologies used in providing the museum managers visitor data (Roes, 2010). In most cases, GPS was utilized in indoor navigation as a way to gather visitor movement data in a museum to help managers in giving path recommendations to visitors. (Lykourentzou, et al, 2013)
Visitor movement was earlier categorized by Veron and Levasseur, around 1983. From this research, they identified the four main visiting styles namely the ant, fish, grasshopper, and the butterfly (Veron, Levasseur, 1983). The identified four visiting styles were mostly studied by different researches may it be in visualization (Chittaro, et al, 2004), or in utilizing the information for a museum guide development (Bianchi et al, 1999) (Gabrielli et al, 1999) (Zancanaro et al, 2007) (Hatala et al, 2005)
This four main visitor types were then modelled into an Agent-Based Simulation in the BLUE project. (Lykourentzou, et al, 2013). The identified models were the museum and the visitors. Each visitor type are modelled according to their movement, as well as quantifying the quality of experience of the visitors according to different social factors such as interests, crowd tolerance, and stamina.
In this research, the agent-based simulation is also utilized, but with a simpler approach in modelling the movement of the visitors.
2.2 Agent-based Modeling and GIS
One of the advantages of agent-based approach compared to a simple GIS spatial analysis is the integration of the behavioral aspect of the agents and the time element. Although GIS is very useful in representing and analyzing geospatial data, spatial data are mostly modelled in their basic form, mostly static in nature. Coupling GIS with ABM can maximize the ability of the model to fully abstract reality. But the linkage also depends on the modelling endeavor. (CASA UCL, 2006)
Agent-based relies on the principle that the environment is described by the actors or the agents that play within it (Bonabeau, 2002). These agents are autonomous in nature, can process information, and interact with other agents given a set of behaviors. The interaction also adapts to the environment and agents behave differently and independently. (CASA UCL, 2006)
One important concept of ABM is that mobility of agents are one of the useful features. The agents can have a behavior of moving at different speeds given different cases of environment factors. (CASA UCL, 2006). In this project, mobility and intellectual ability of the agents are the main factors considered in modelling the agents. Perception of visitors differ every change in their location. Thus, this must be incorporated in the ABM model to fully realize the perceived area of a visitor.
2.3 GAMA Simulation Software
GIS Agent-based Modeling Architecture, or simply GAMA is an agent based simulation platform which can easily incorporate spatial data to the environment to be modelled. The usual vector data in shapefile can be easily incorporated in the simulation, as well as its attributes. In this way, the model utilizes both the
spatial strength of a GIS software and the complexity of the ABM software. (GitHub, 2015)
GAMA has its own scripting language which is GAML. A single model can contain multiple interacting agents that can be static or moving. Agents are modelled using the GAML to add agent behaviors and attributes. GAMA also contains support for data visualization in the form of creating different types of charts. (Taillandier, 2012)
3. METHODOLOGY
The main method has three stages: the data pre-processing stage, the visibility analysis, and the agent based modelling stage, as shown in Figure 1. The specific methods for each part will be thoroughly discussed in the following sections.
Figure 1. The main workflow
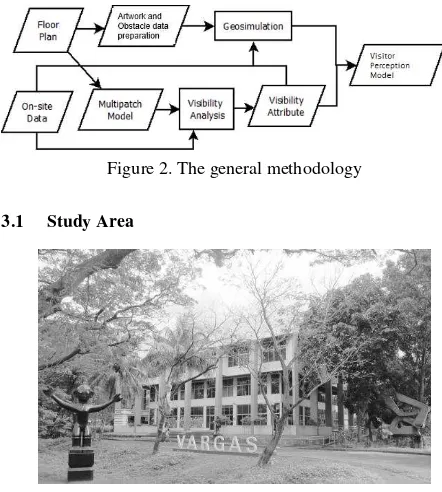
Figure 2 below shows a much detailed flowchart showing the interactions of the inputs and the outputs of each part to generate the visitor perception model. As seen in Figure 2, the floor plan and the on-site data are the main data needed to be inputted in the process. These information are to be preprocessed to be inputted to both the visibility analysis and the ABM. The output of the visualization model is then inputted in the simulation model to as one of the artwork attributes. After building the environment, the simulation will be generated over the environment to generate needed information for the perception model.
Figure 2. The general methodology
3.1 Study Area
Jorge B. Vargas Museum and Filipiniana Research Center, shown in Figure 3, is the in house Museum of the University of the Philippines – Diliman. The museum exhibits various art repositories even dating back to the early 1880s to the 1960s. It houses historical, as well as educational art works such as oil paintings, pastels, watercolors, drawings, and sculptures. One of its main agenda is to contribute to the Filipino heritage in its artistic aspect (Wordpress, 2015)
The building was erected in 1987, housing mostly the works of Mr Vargas. The building has a total of four floors. The basement is used mostly as an activity center for community arts programs and different workshops. The ground floor is the main access of the museum. Aside from the main reception, the lobby functions as a temporary exhibit, location for art launching and lectures, and other temporary activities. The second floor houses the main gallery of the museum wherein the artworks installed are mostly permanent. Aside from the normal art exhibit area, the third floor houses the historical archives and library are stored. The lobby area is also used as space for photography and contemporary art exhibits. (Wordpress, 2017)
Currently the second floor, which was used mainly for the permanent exhibits, is under renovation. The artworks initially installed in the main gallery are now located across the lobby of the third floor, as well as the first floor. (Wordpress, 2017) This study will implement an ABM geosimulation on the second floor of the said building to assess the previous configuration of its installations.
3.2 Environment Modelling
The building floor plan from the Office of the Campus Architect is used as a basemap of the generation of the 2D floorplan. Other information not included in the available CAD file such as the placement of the artworks and panel boards, are digitized manually. After adding the information from site visits, the 2D floor plan shapefile was generated. Figure 4 below shows the generated shapefile of the floorplan as well as the location of the artworks
Figure 4. 2D Floor plan and artwork locations
The 3D model of the second floor was generated from the 2D model using the wall height attributes. The generated 3d layer was then converted to a multipatch, as shown in Figure 5. This multipatch model will be utilized in the visibility analysis.
Figure 5. 3D model of the second floor.
3.3 Visibility Analysis
Here, the visibility analysis tests the overall visibility of the artworks from a generated 1 meter interval target points. Initially, the artwork locations identified earlier are set as source points while the target points are generated using fishnets. The
vispercent, the value which determines the overall visibility was computed based on Equation 1 shown below.
(1)
where totvis = total number of visible targets targets = total number of target points
Since the source points have height attributes in nature, the initial artwork locations were converted to a 3D point with height attribute. The assumed height of the artworks is 1.3 meters.
The target points serve as the location of the eye level of the visitors once they are standing in that location. The assumed height of the target points is 1.5 meters from the ground, as displayed in Figure 6. After generating these points, they are now subject to the line of sight analysis, utilizing the generated 3D model as the obstruction features. After which, equation 1 was used to solve for the overall visibility of each artwork.
Figure 6. Source and Target points for the visibility analysis
3.4 Agent Based Modelling
The third part is the agent based modelling in GAMA. In this part, the 2D floorplan and the artwork locations with overall visibility attribute was used for the model.
Four main agents are identified that will take part in the simulation: Obstacles, artworks, people, and exits. Unlike the
This contribution has been peer-reviewed.
other three agents, the obstacle agent is an agent without an attribute. The other three agents will be discussed in the next sections. The Figure 7 shows the interrelationship of the four agents in a UML Diagram.
Figure 7. Class Diagram of the agents in the environment
3.4.1 Exit Agent
The exit agent is the designated location at which visitors will enter and leave the main exhibit hall. This agent’s main goal is to count the total number of agents entering and leaving the scenario.
This agent has one attribute, which is the exited. This attribute counts the total number of visitors exited in that exit. The agent is also closely dependent on the global parameter chance which will be explained in section 3.4.4.
3.4.2 Artwork Agent
This agent represents the artworks in the exhibit area. The location of the artworks are based from the artwork location shapefile generated earlier in section 3.2. Each artwork agent has four attributes, which are visits, ovis, viewrange, and staytime. Visits attributes counts the number of visitors for each artwork. Ovis is the overall visibility attribute generated from the visibility analysis in section 3.3. Viewrange is a geometry type of attribute which corresponds to the minimum distance from the artwork a person can view that artwork. This is represented as a circle centered at the location of the artwork with 1 meter radius. Lastly, the staytime attribute is the viewing time of visitors on each artwork. This value is generated randomly from 50 to 90 seconds
3.4.3 People Agent
The people agent models the visitors as well as their perceived area as they move. Each people agent has a total of eight attributes which is updated for every cycle. Perceived_area is a geometry type of attribute representing the perceived area of a visitor. This area is default to be a cone with ±30 degrees view angle based from the heading direction of the visitor, and a radius of 5 meters. Target attribute is the art agent at which a visitor aims to view at that instant. Artnotvisit pertains to a list of artwork agents not yet visited by the people agent. The people agent will choose potential targets from this list. In case the visitor views a target artwork, it is removed to the list.
Numartvisit counts the number of visited artworks. Viewtime
tracks the number of seconds a visitor is viewing the target artwork. Totaltime tracks the total time of the visitor in the museum. Availtime is the total available time of the visitor in
the museum. This value is randomized from 4800 seconds to 6420 seconds. Lastly, speed is the built in attribute of moving agents. This value varies from 0.2 to 0.6 m/s depending on the state of the visitor agent.
The people agent is the only agent that has the ability to move. The movement, however, has a set of instructions the visitor will follow. Figure 8 shows the sequence of commands the visitor will follow when navigating inside the museum.
Figure 8. The flowchart showing the sequence of instructions for people agent mobility.
The visitor’s perceived area attribute is updated every iteration to model the changing location of the people agent. The agent will end the visit once the available time attribute of the person is less than the total time attribute. By that time, no more targets will be set and the agent will go straight to the exit agent nearest to it.
3.4.4 Global Parameters
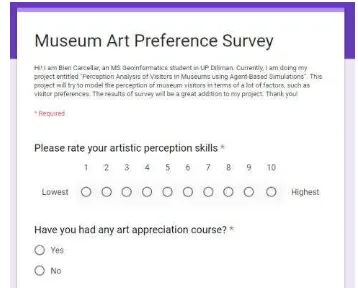
To help initialize the simulation, a museum art preference survey was performed to gather information on the parameter values such as the average length of stay and the average viewing time per artwork. Figure 9 shows a part of the online survey done.
Figure 9. A screenshot of the online museum art preference survey
values are generated. Perception distance parameter is set to 5 meters. The perceived area angle is set to 60 degrees. Speed of people agents vary from 0.2 to 0.6 m/s depending on their state. The tourist available time is also a random attribute from 1 hour 20 minutes up to 2 hours. The artwork viewing time attribute is also randomly selected from the range 50-90 seconds.
Another parameter, which is the chance, is included in the simulation. This chance parameter determines whether or not a new visitor will enter the museum in the next minute or not. It can also be interpreted as the probability that a new visitor will enter the museum in the next 60 seconds. Three values of chance parameter was used (10%, 20%, and 30% chance), corresponding to the three simulations performed as shown in the next section.
4 RESULTSANDDISCUSSIONS
4.4 Visibility Analysis
The following image shows the visibility analysis results. The green cells represent high value of overall visibility while the red cells represent the low visible artworks.
Figure 10. Overall visibility of artworks
Observing Figure 10, artworks near the center of the exhibit has the highest visibility from the target points. The placement of the panel boards significantly lowered the visibility of the artworks behind it. Although that fact is expected, it is observed that the areas mostly affected by these positioning of the panel boards are the southern portion of the exhibit. Even though this section is closer to the entrance as compared to the other artworks, the walls and the panel boards made the artworks in this location to have little to low visibility. Further checking the initial floor plan, it is found out that the southern area is a former comfort room and was just recently reconstructed as exhibit area for contemporary art. Walls and dividers from the previous configuration were retained, causing the artworks in this area not readily visible to the visitors entering the museum.
4.5 Simulation in GAMA Software
The dataset outputs from the previous processes were imported into the simulation software. The simulation is run for the three cases: 10%, 20% and 30% chance. Screenshots of the actual simulation is shown in Figure 11.
Figure 11. Screenshot of the simulation for 10%, 20%, and 30% chance respectively.
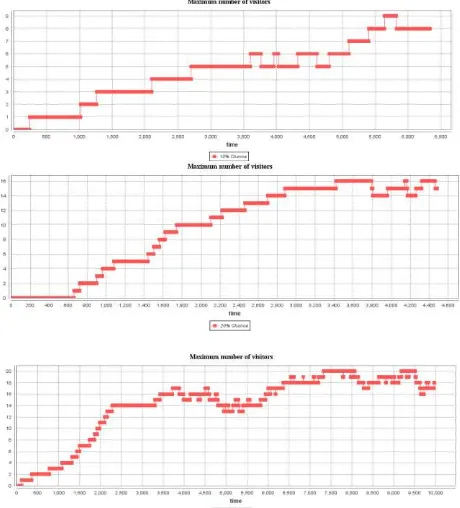
Two data charts were also displayed, along with the spatial display: the number of visitors graph, and the average visitors per artwork graph. Figure 12 shows the results of the number of visitors charts for all three chance use cases.
Figure 12. Chart of total visitors for the three chance cases
Summarizing the results from the graph in Figure 13, a maximum of 9 visitors for the 10% chance model was observed, 16 visitors for the 20% chance model, and 20 visitors for the 30% chance model. From these values, it is inferred that among the three implementation, the closest model to the actual is the 10% model with maximum of 9 people, as the Vargas Museum usually has around 5-10 visitors at a time on the average (V. Fuentes, personal interview, May 20, 2016).
Aside from the total visitors, a chart of the average visitors per artwork was also displayed. The following images show the charts for all three cases.
This contribution has been peer-reviewed.
Figure 13. Average number of viewers per artwork for 10%, 20%, and 30% chance respectively.
From Figure 13, the green circles show the time for the average visitors per artwork to be 1. This means that after that identified time, on the average, the artworks will have a minimum exposure from the visitors. The identified time for the 10% chance case is 1 hour and 40 minutes. For the 20% case, the time is 1 hour and 20 minutes, while for the 30% chance, the time is 55 minutes. These values can be used as recommended minimum viewing time for the exhibit so that each artwork will have at least one viewer.
Aside from the two graphs, heatmaps were also generated to spatially examine the viewing patterns. Since the identified closest model to the actual is the 10% chance, the heatmaps were generated only for the 10% chance. Three heatmaps were generated, once every hour of simulation and for three hours. Figure 14 shows the third hour heatmap. Red cells show the least viewers while greener cells show high viewership.
Figure 14. Heatmap of viewing patterns after three hours
Observing the three heat maps generated from the 10% chance models, it is spotted that after three hours, artworks from the eastern and western part of the exhibit area are viewed at least once. Areas such as the upper part of the exhibit shows the least number of visitors. This may be attributed to the fact that this part is the farthest from the entrance of the main exhibit. Southern part of the exhibit area has low perception results. This part has been a former comfort room, and has been consistently
low in visibility value as well.
5 CONCLUSIONSANDRECOMMENDATIONS
5.4 Conclusions
This research project aims to create a visitor perception model using visibility analysis and ABM. From the three chance models generated from the model, it is observed that the 10% Chance simulation model is considered as the closest simulation model to the current Vargas Museum visitor profile of around 5-10 visitor count at a time.
From the 10% chance model, the average recommended minimum viewing time is around 1 hour and 20 minutes. For maximum viewing experience and maximum perception over all art exhibits, the recommended minimum time limit of museum viewing is 1 hour and 20 minutes.
As seen in the results, it is observed that GAMA is a potential tool in modelling social behavior scenarios particularly in art perception and preferences. Incorporating GIS and Agent Based Simulation is one important aspect in GAMA which can be utilized for spatial analysis and applications. This has been one of the advantages of GAMA, being able to easily incorporate GIS dataset to the simulation.
In general, Agent-Based Models such as these are helpful in scenarios which require to model actual movement of people. Such model can be used for management of visitors, as well as positions of artwork for maximizing viewing experience. One can get insights about the effectiveness of the current spatial distribution of artworks, and formulate possible museum guidelines for planning exhibit layouts.
5.5 Recommendations
This study models the social behavior of the visitors as a simple choice using the overall visibility as the sole parameter. This is however not the real case since a lot of factors may come into play into a visitor’s mind when viewing an artwork. Factors such as visitor preferences, and art appreciation level of people can be used as one way of creating a more complex decision making visitors. Multi-Criteria Decision Making (MCDM) Analysis can be incorporated to this model for more realistic approach.
This study also modelled visitors as a single unit, meaning, each visitor enters the museum individually. The model can be more realistic if more complex visitor to visitor relationship (such as group movement, companionships) can be added in the model. This will be an added factor to the decisions of the visitors.
ACKNOWLEDGEMENTS
The researcher would like to thank Dr. Ariel C. Blanco and Asst. Prof. Edgardo Macatulad for their contribution to the conception, development, and completion of this research project. Also, the researcher would like to express gratitude to the people and agencies provided the needed datasets such as to the University of the Philippines Campus Architect and Vargas Museum management, and the respondents of the Art Perception Survey form.
REFERENCES
Bianchi, A., and Zancanaro, M.: Tracking users’ movements in an artistic physical space. In: The i3 Annual Conference, Siena, Italy, October 20-22, pp. 103–106 (1999). Web
Chen, X., and F. B. Zhan. "Agent-based Modelling and Simulation of Urban Evacuation: Relative Effectiveness of Simultaneous and Staged Evacuation Strategies." J Oper Res Soc Journal of the Operational Research Society 59.1 (2006): 25-33. Web.
Chittaro, L., and Ieronutti, L.: A visual tool for tracing users’ behavior in virtual environments. In: AVI 2004: Proceedings of the working conference on Advanced visual interfaces, pp. 40–47. ACM, New York (2004). Web
Gabrielli, F., Marti, P., and Petroni, L.: The environment as interface. In: The i 3 Annual Conference, Siena, Italy, October 20-22, pp. 44–47 (1999). Web.
Hatala, M., and Wakkary, R.: Ontology-based user modeling in an augmented audio reality system for museums. User Modeling and User-Adapted Interaction (3-4), 339–380 (2005). Web.
I. Roes, Personalized Museum Tour with Real-Time Adaptation on a Mobile Device with Multi-Point Touch Interface, Mater Thesis, Eindhoven University of Technology, 2010. Web.
K. Sookhanaphibarn and R. Thawonmas, A Movement Data Analysis and Synthesis Tool for Museum Visitors' Behaviors, in: Proceedings of the 10th Pacific Rim Conference on Multimedia: Advances in Multimedia Information Processing, Springer-Verlag, Bangkok, Thailand, 2009. Web. Macatulad, Edgardo G. "3D GIS Based Multi-Agent Geosimulation Model for Building Evacuation." Thesis. National Graduate School of Engineering, University of the Philippines - Diliman, 2015. Print.
Macatulad, E. G., and A. C. Blanco. "3DGIS-Based Multi-Agent Geosimulation and Visualization of Building Evacuation Using GAMA Platform." Int. Arch. Photogramm. Remote Sens. Spatial Inf. Sci. ISPRS - International Archives of the Photogrammetry, Remote Sensing and Spatial Information Sciences XL-2 (2014): 87-91. Web.
"Principles and Concepts of Agent-Based Modelling for Developing Geospatial Simulations." Academia.edu. Centre for Advanced Spatial Analysis University College London, Sept. 2006. Web. 27 May 2016.
"The Building and Galleries." Wordpress. University of the Philippines, Jose B. Vargas Museum and Filipiniana Research Center, nd. Web. 29 May 2017.
Taillandier, Patrick, Duc-An Vo, Edouard Amouroux, and Alexis Drogoul. "GAMA: A Simulation Platform That Integrates Geographical Information Data, Agent-Based Modeling and Multi-scale Control." Principles and Practice of Multi-Agent Systems Lecture Notes in Computer Science (2012): 242-58. Web.
Veron, E., Levasseur, M.: Ethnographie de l’Exposition. Bibliothque publique d’Information, Centre Georges Pompidou, Paris (1983). Web.
Zancanaro, M., Kuflik, T., Boger, Z., Goren-Bar, D., Goldwasser, D.: Analyzing museum visitors’ behavior patterns. In: Conati, C., McCoy, K., Paliouras, G. (eds.) UM 2007. LNCS (LNAI), vol. 4511, pp. 238–246. Springer, Heidelberg (2007). Web.
This contribution has been peer-reviewed.