OPEN JOURNAL SYSTEMS
US ER
Usernam e Password
Rem em ber m e Log In
N O TI FI CA T I O N S
View
Subscr ibe /Unsubscribe
JOU RN A L CON TEN T S e a r c h
All Search
B r o w s e
By I ssue By Aut hor By Tit le Ot her Journals
FO N T S I Z E
I N FORM A TI ON
For Readers For Aut hor s For Librar ians
HOME ABOUT LOG I N REGI STER SEARCH CURRENT ARCHI VES
Ho m e > Ab o u t t h e Jo u r n al > Ed i t o r i a l T e a m
Editorial Team
Editor-in-Chief
I Way an Nuarsa, Facult y of Agricult ur e Udayana Univer sit y, I ndonesia
Co-Editor-in-Chief
Abd. Rahman As- sy akur, [ Scopus I D: 54406513400, h- index: 4] Cent er for Rem ot e Sensing and Ocean Science ( CReSOS) ,
Udayana Universit y. Gedung Pascasarj ana, Lt 3. Jl. PB Sudirm an, Denpasar - 80232, Bali, I ndonesia
Dr. Way an Gede Ariast ina, Depar t m ent of Elect rical Engineer ing, Facult y of Engineering, Udayana Universit y, Bali, I ndonesia,
I ndonesia
Associate Editor
Assoc . Prof . Dr. T akahiro Osaw a, [ Scopus I D: 47861975900, h- index: 3] Pr ogram St udi Magist er I lm u Lingkungan, Program
Pascasar j ana, Universit as Udayana, Bali, I ndonesia
Prof . Dr. I Way an Budiarsa Suy asa, Program St udi Magist er I lm u Lingkungan, Pr ogr am Pascasarj ana, Univer sit as Udayana, Bali,
I ndonesia
Prof . Dr. Ket ut Wikant ika, Cent er for Rem ot e Sensing ( CRS) , I nst it ut e of Technology Bandung ( I TB) , Bandung, I ndonesia,
I ndonesia
Editorial Board
Dr. I Gust i Bagus Sila Dharma, Marine Science Depart m ent , Facult y of Marine Science and Fisher ies, Udayana Universit y, Bukit
Jim bar an, Bali 80361, I ndonesia
Prof . Dr. T asuku T anaka, Gr aduat e School of Science and Engineering, Yam aguchi Universit y, Yam aguchi, Japan, Japan
Prof . Dr. I Way an Art hana, [ Scopus I D: 55486654300, h- index: 1] Progr am St udi Magist er I lm u Lingkungan, Pr ogram
Pascasar j ana, Universit as Udayana, Bali, I ndonesia
Prof . Dr. Sudiana Mahendra, Pr ogr am St udi Magist er I lm u Lingkungan, Program Pascasar j ana, Universit as Udayana, Bali,
I ndonesia
Prof . Dr. I Gede Mahardika, [ Scopus I D: 6602795841, h- index: 2] Pr ogr am St udi Magist er I lm u Lingkungan, Program
Pascasar j ana, Universit as Udayana, Bali, I ndonesia
Prof . Dr. I r Way an Kasa, FMI PA Universit as Udayana, Denpasar , Bali, I ndonesia
I da Ay u Ast arini, [ SCOPUS I D: 6507072613, h- index: 4] ( Genet ika dan Molekuler ) Jur usan Biologi, FMI PA, Universit as Udayana
This work is licensed under aCreat iv e Commons At t ribut ion 4. 0 I nt ernat ional Lic ense.
Copyright 2014 - 2015 Journal of Environm ent
Published by Gr aduat e St udy of Environm ent al Sciences,Uday ana Univ ersit y
j . environm ent (I SSN 2356- 3125)
J o u r n a l o f E n v i r o n m e n t
Editorial Team http://ojs.unud.ac.id/index.php/environment/about/editorialTeam
OPEN JOURNAL SYSTEMS
U S ER
User nam e Passw or d
Rem em ber m e
Log In
N O T I FI CA T I O N S
View
Subscr ibe / Unsubscr ibe
JO U RN A L CO N T EN T S e a r c h
All
Search
B r o w s e
By I ssue
By Aut hor By Tit le Ot her Journals
FO N T S I Z E
I N FO RM A T I O N
For Reader s For Aut hor s For Librar ians
HOME ABOUT LOG I N REGI STER SEARCH CURRENT ARCHI VES
Hom e > Ar ch i v es > V o l 1 , N o 1 Vol 1, No 1
Table of Con ten ts
Articles
Monit oring of Merapi Volc ano Def ormat ion Using I nt erf eromet ry Sy nt het ic Apert ure Radar ( I nSAR)
T ec hnique
Ayu Margaworo Pam ungkas, Takahiro Osawa, I Way an Sandi Adnyana
Numeric al Simulat ion on Shoreline Change in West ern Region of Badung Regenc y , Bali, I ndonesia PDF
Andhit a Triwahyuni, Koj i Asai
Phy t oplankt on Div ersit y as Ec ologic al I ndic at or in Jimbaran Bay Wat ers PDF
I m a Yudha Perwira, Dev i Ulinuha
Predic t ing Flood Vulnerable Areas by Using Sat ellit e Remot e Sensing I mages in Kumamot o Cit y - Japan PDF
A. Besse Rim ba, Fusanori Miura
St udy on Grow t h Rat e and Seaw eed Euc heuma spinosum And Euc hema c ot t oni in Wat ers of Kut uh
Village, Sout h Kut a Sub- Dist ric t , Dist ric t of Badung- Bali
Dwi Budi Wiy ant o
St udy on Mollusk and Algae or Phy t oplankt on Communit y in Sout heast Wat ers of Bali PDF
Dev i Ulinuha, I m a Yudha Perwira
This work is licensed under a Creat iv e Commons At t ribut ion 4. 0 I nt ernat ional Lic ense. Copyright 2014 - 2015 Journal of Environm ent
Published by Graduat e St udy of Env ironm ent al Sciences, Uday ana Univ ersit y j . envir onm ent (I SSN 2356- 3125)
J o u r n a l o f E n v i r o n m e n t
Vol 1, No 1 http://ojs.unud.ac.id/index.php/environment/issue/view/1307/showToc
Journal of Environment, 1, (2014), 36–42
Original Paper
Study on Growth Rate and Seaweed Eucheuma spinosum
And Euchema cottoni in Waters of Kutuh Village, South
Kuta Sub-District, District of Badung-Bali
Dwi Budi Wiyanto *
a Study Program of Marine Sciences, Faculty of Fisheries and Marine Sciences, Udayana University, Bali -
Indonesia
* Corresponding author: Dwi Budi Wiyanto; E-Mail: [email protected]
Tel.: +62 361 702802
Received: 29 May 2014 / Accepted: 9 November 2014 / Published: 13 November 2013
Abstract
:
Seaweed is a non-fish fishery commodity. The market demand for seaweed, both
from the domestic and foreign markets has a bright future as a trade commodity on the
international market. Bali is one of the islands of seaweed producers in Indonesia. Seaweed
production in Bali in 2008, decreased to 15.2% compared to that in 2007. The purpose of
this study was to determine how big the difference between the growth rate of E. cottonii
seaweed and that of E. spinosum. Seaweed cultivation was conducted using raft off the
base (off bottom method) of 2 units with the size of 5 x 2.5 meters each. Spacing of each
seed was 25 -30 cm. Seed weight of seaweed E. cottonii and E. spinosum is equal to 100
grams. Maintenance time was for 40 days, and the sampling was done once every 10 days
as many as 10 samples of seaweed. The results showed that seaweed E. cottonii had faster
growth compared with E. spinosum. Seaweed daily growth of the species E. spinosum in
the first 10 days was faster than the seaweed of the species E. cottonii. However, the
second 10 days to the third 10 days E. cottonii seaweed growth was faster than E.
spinosum. The average weight of Euheuma cottonii for 40 days planting was 189.29 grams
while the average weight of Eucheuma spinosum was 185.55 grams. Water condition in
the location of research was still in the normal range for the growth of two species of
seaweed cultivated.
Keywords
:
Growth; Seaweed; Eucheuma spinosum; Euchema cottoni
1. Introduction
Seaweed is a non-fish fishery commodity. Foreign
demand for Indonesian seaweed in 1990 amounted to
10779 tons with a total value of US $ 7.16 million it
kept increasing and ever reached 28104 tons in 1995
with a total value of US $ 21.30 million (Junaidi et
J. Environment 1(2014): 36–42 37
Bali is one of the islands of seaweed producers in
Indonesia. Seaweed production in Bali in 2008
decreased to 15.2% compared to that in 2007. One of
the centers of cultivation of seaweed in Bali is in the
village of Kutuh, sub-district of South Kuta, Badung,
from the above data the researcher deems it necessary
to do other research on the growth of seaweed in
order to improve seaweed production and utilization
of cultivated land which is still not optimal.
The objective to be achieved in the implementation of
this study was to determine how big the difference
between the growth rate of E. cottonii seaweed and E.
spinosum in the waters of Kutuh Village, South
Kuta-Bali Badung regency
2. Methods
2.1. Research Methods
The method used in this study was a sample survey
method or field survey (Hadi, 1986). Data would be
analyzed using T test, and then the results of the
analysis were displayed in tables and graphs as well
as descriptive information.
Weight measurement data of seaweed was
analyzed using t-test. T-test was used to compare
between the two examples and different types
(Romimohtarto and Heilbron, 1999).
Seaweed cultivation was conducted using a raft off
the base (off bottom method) of 2 units with straps
size of 3 meters each. Spacing of each seed is 15-20
cm. Type of seaweed used is Eucheuma cottoni and
Eucheuma spinosum. Seed weight of E. cottonii and
E. spinosum seaweed is equal to ± 100 grams.
Maintenance time was for 40 days, and the sampling
was done once every 10 days as many as 10 samples
of seaweed.
2.2. Main Parameters
Calculation of absolute growth was done by using
an absolute formula, standard and average daily
growth according to Effendi (1997).
1. Absolute Growth
t Wo Wt Gr Wo Wt G / − = − = (1) Specification :
G : Absolute Growth
Gr : Daily Growth Rate
Wt : weight at the time of observation (gr)
Wo : Initial Weight (grams)
t : time (days)
2. Absolute Growth
% 100 ln ln x t wo wt
SGR= − (2)
Specification :
SGR : Standard Growth Rate (%)
lnwt : Seaweed Final Weight (grams)
lnwo : Seaweed Start Weight (grams)
t : time (days)
3. Average Daily Growth
% 100 1 x wo
wt
ADG t ⎟
⎠ ⎞ ⎜ ⎝ ⎛ − = (3) Specification :
ADG : Daily Growth (%)
Wt : Weight after t days (gram)
Wo : Initial Weight (grams)
t : time (days)
2.3. Supporting Parameters
Measured parameters are temperature, pH, salinity,
currents and brightness. The parameters measured in
situ at each weight measurement of seaweed.
2.4. Data Analysis
Analysis of the data used was t-test. T-test can be
J. Environment 1(2014): 36–42 38
the hypothesis of 1-sample and t-test used for
hypothesis testing of 2-sample.
3. Results and Discussion
3.1. Seaweed Growth
Based on the measurement results of the average
growth of 10 first ten days, Eucheuma cottonii was
equal to 130.89 grams, while the Eucheuma spinosum
growth during the first ten days was 134.11 grams.
During the growth in the first ten days, there was a
difference between the two species, in which
Eucheuma spinosum had faster growth than
Eucheuma cottonii. The results of data analysis using
t-test showed that there is a difference in both of the
average weight of a sample of the first ten days. It is
shown by the significant value of α> 0.05. This value
is stated that the two species have different growth
rates, i.e. t count > t table where t count was -1.409
and t table was 1.734.
Measurement of growth of the second 10 days on
Eucheuma cottonii amounted to 168.26 grams, while
the Eucheuma spinosum amounted to 168.31 grams.
Eucheuma spinosum had faster growth than
Eucheuma cottonii. The results of data analysis using
t-test, showed that there was a difference in both the
average weight of a sample of the second ten day. It is
shown by the significant value of α> 0.05. This value
is stated that the two species have different growth
rates, i.e. t count > t table where t count was -0.009
and t table was 1.734.
Observations and Measurements on the third 10
days of Eucheuma cottonii’s growth amounted to
207.82 grams while the growth in Eucheuma
spinosum amounted to 203.65. In the third ten days of
this observation, there was a difference where
Eucheuma cottonii had faster growth compared with
Eucheuma spinosum. The results of data analysis
using t-test, showed that both the average weight of a
sample of the third ten days there was a difference. It
is shown by the significant value of α> 0.05. This
value is stated that the two species have different
growth rates, i.e. t count > t table where t count was
0.840 and t table was 1.734.
In the observation and measurement of the fourth
ten days, the growth of Eucheuma cottonii reached
250.20 grams, while the growth of Eucheuma
spinosum reached 236.13. Growth in Eucheuma
cottonii was faster than Eucheuma spinosum. On the
fourth 10 days of measurement, the two species had
very low growth; this is because at the fourth 10 days
of seaweed cultivation, both species were attacked by
pests, small fish around the site. The results of data
analysis using t-test showed that there was a
difference in the average weight of both samples
during the fourth ten days. It is shown by the
significant value of α> 0.05. This value states that the
two species had the same growth rate, i.e. t count > t
table where t count was 4.067 and t table was 1.734.
From the data analysis results, it can be seen that
the average weight of Euheuma cottonii for 40 days
planting was 189.29 grams while the average weight
of Eucheuma spinosum was 185.55 grams. From
these data, there was evidently a weight difference
between the two species.
3.2. Absolute Growth
Results calculated for absolute growth rate and daily
growth rate are shown in Table 1. Based on the results
of the calculation, the average value of the absolute
growth between E. Cottonii and E. Spinosum can be
seen in Figure 1.
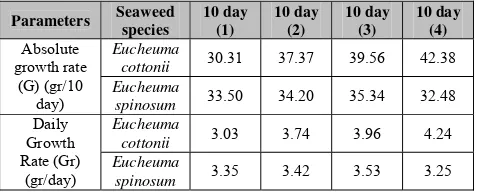
Table 1. Absolute growth rate (G) and Daily Growth
Rate (Gr).
Parameters Seaweed species 10 day (1) 10 day (2) 10 day (3) 10 day (4)
Eucheuma
cottonii 30.31 37.37 39.56 42.38
Absolute growth rate
(G) (gr/10 day)
Eucheuma
spinosum 33.50 34.20 35.34 32.48
Eucheuma
cottonii 3.03 3.74 3.96 4.24
Daily Growth Rate (Gr)
(gr/day)
Eucheuma
J. Environment 1(2014): 36–42 39
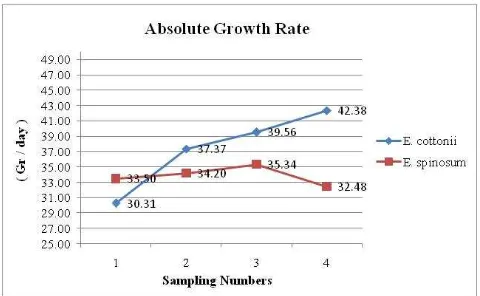
Figure 1. Graph Absolute Growth Rate
Absolute growth rate in E. cottonii and E.
spinosum is noticeable. At the first sampling, the
absolute growth rate of E. spinosum was faster than
that of E. cottonii, i.e. the rate of growth in E. cottonii
amounted to 30.31 g / 10 days, whereas the growth
rate of E. spinosum 33.50 g/10 days.
In the second sampling, the absolute growth rate of
E. cottonii was faster than that of E. spinosum, i.e. the
rate of growth in E. cottonii amounted to 37.37 g/10
days, whereas the growth rate of E. spinosum was
34.20 g/10 days.
In the third sampling, the absolute growth rate of
E. cottonii was faster than the absolute growth rate of
E. spinosum, i.e. the rate of growth in E. cottonii was
39.56 g/10 days and the rate of growth of E. spinosum
was 35.34 g/10 days.
While in the fourth sampling, the absolute growth
rate of E. cottonii was faster than the absolute growth
rate of E. spinosum, i.e. the rate of growth of E.
cottonii was 42.38 g/day, while the rate of growth in
E. spinosum was 32.48 g/10 days. In the measurement
of the growth rate of the fourth 10 days seaweed
growth of E. Spinosum species tended to decline, it is
because the seaweed is disturbed by pest, which is
eaten by fish.
From the analysis, the calculation of daily growth
rate values between Eucheuma cottonii and
Eucheuma spinosum were obtained. This can be seen
in Figure 2.
Daily growth rate in E. cottonii and E. spinosum is
noticeable. At the first sampling, E. spinosum daily
growth rate was faster than the daily growth rate of E.
cottonii, the daily growth rate of E. cottonii was 3:03
g /day, while the daily growth rate of E. spinosum
was 3:35 g / day.
Figure 2. Graph Daily Growth Rate
In the second sampling, daily growth rate of E.
cottonii was faster than the daily growth rate of E.
spinosum, the daily growth rate of E. cottonii was
3.74 g / day, while the daily growth rate of E.
spinosum was 3.42 g/day. In the second 10-day
sampling measurement, daily growth rate of E.
cottonii was likely to increase from the first 10 days
of measurement, from 3:03 g / day to 3.74 g / day. In
E. spinosum, daily growth rate also increased, namely
3.35 g / day up to 3.42 g/day.
In the third sampling, daily growth rate in E.
cottonii was faster than the daily growth rate of E.
spinosum, namely daily growth rate of E. cottonii was
3.96 g / day, while the growth rate of E. spinosum
was 3.53 g / day. Daily growth rate of E. cottonii
tended to increase the daily growth rate measurements
the second 10 days, i.e. from 3.74 g / day down to
3.96 g / day. Similarly, the daily growth rate of E.
Spinosum tended to increase from 3.42 g / day up to
3.53 g / day.
In the fourth sampling, daily growth rate in E.
cottonii was faster than the daily growth rate of E.
spinosum, namely daily growth rate of E. cottonii was
4.24 g / day, while the growth rate of E. spinosum
was 3.25 g / day. Daily growth rate in E. spinosum
J. Environment 1(2014): 36–42 40
rate of the third 10 days, i.e. from 3.53 g / day down
to 3.25 g / day. Decreased daily growth rate in E.
spinosum was caused by pests, namely fish.
3.3. Standard Growth
At the first sampling, standard growth rate of E.
spinosum appeared higher than E. cottonii, which is
standard on the growth rate of E. cottonii, i.e. 2.63%,
while the standard growth rate of E. spinosum was
2.87%.
In the second sampling, standard growth rate of E.
cottonii looked higher than the standard growth rate
of E. spinosum, which is standard on the growth rate
of E. cottonii of 2.51%, while the standard growth
rate of E. spinosum was 2.27%. In the standard
growth rate of seaweed species E. Spinosum, there
was a decline compared to the first 10 days of
sampling, i.e. from 2.87% down to 2.27%.
In the third sampling, standard growth rate of E.
cottonii looked higher than the standard growth rate
of E. spinosum, which is standard on the growth rate
of E. cottonii at 2.11%, while the standard growth rate
of E. spinosum was 1.91%. In both species of
seaweed decreased percentage of growth rate
compared to the standard second 10-day sampling, in
which the standard growth rate of E. cottonii
decreased from 2.51% to 2.11%, while the decline in
the growth rate of E. spinosum was from 2.27% up to
1.91%.
Fourth sampling measurements, the standard
growth rate of E. cottonii looked higher than the
standard growth rate of E. spinosum, namely the
standard growth rate of E. cottonii was 1.86%, while
the standard growth rate of E. spinosum was 1.48%.
Of both species, there was a percentage decrease in
standard growth rate compared with the third
sampling, namely the E. cottonii from 2.11% to
1.86%, whereas in E. spinosum from 1.91% down to
1.48% as seen in Figure 3 and Table 2.
Figure 3. Graph of Standard Growth Rate
Table 2. Standards Growth Rate (SGR)
Seaweed species
10 day (1)
10 day (2)
10 day (3)
10 day (4) Eucheuma
cottonii 2.63 2.51 2.11 1.86 Eucheuma
spinosum 2.87 2.27 1.91 1.48
3.4. Average Daily Growth
From the calculation of Average Daily Growth
(ADG) obtained value growth rate between E. cottonii
and E. spinosum are presented in Figure 4 and Table
3.
Figure 4. Graph Average Daily Growth
Based on the analysis, average daily growth of
seaweed on the first sampling, showed that the
average daily growth results are not much different,
i.e the percentage of E. cottonii average daily growth
is 1.41%, whereas in E. spinosum is 1.42 %.
In the second sampling, the percentage of average
J. Environment 1(2014): 36–42 41
percentage of average daily growth of E. spinosum,
i.e. the percentage of average daily growth of E.
cottonii was 1.40%, while the percentage of average
daily growth in E. spinosum was 1.38%. In
percentage of average daily growth both types of
seaweed decreased compared to the first 10 days of
sampling, namely the E. cottonii from 1.41% down to
1.40% while the E. spinosum decreased from 1.42%
to 1.40%.
Table 3. Average Daily Growth (ADG)
Seaweed species
10 day (1)
10 day (2)
10 day (3)
10 day (4) Eucheuma
cottonii 1.41 1.40 1.37 1.35 Eucheuma
spinosum 1.42 1.38 1.36 1.32
In the third sampling, the percentage of average
daily growth in E. cottonii looked higher than the
percentage of average daily growth of E. spinosum,
i.e. the percentage of average daily growth of E.
cottonii was 1.37%, while the percentage of average
daily growth in E. spinosum was 1.36%. In both
species of seaweed, there was a decrease in the
percentage of average daily growth compared to the
second 10-day of sampling, where the percentage of
average daily growth of E. cottonii decreased from
1.40% to 1.37%, while the decline in the growth rate
of E. spinosum from 1.38% to 1.36%.
In the fourth sampling measurements, the
percentage of average daily growth in E. cottonii
looked higher than the percentage of average daily
growth of E. spinosum, i.e. the percentage of average
daily growth of E. cottonii was 1.35%, while the
standard growth rate of E. spinosum was 1.32%. Of
both species, there was a daily percentage decline in
growth rate compared to the third sampling, namely
in the E. cottonii from 1.37% to 1.35%, whereas in E.
spinosum from 1.36% to 1.32%.
3.5. Supporting Parameters
In general, water conditions for the cultivation of
seaweed was still within tolerated limits for seaweed
cultivation of E. Cottonii and E. Spinosum. Water
quality parameters measured during the process of
observation and calculation of seaweed weight,
measurement of water quality parameters underwent
three repetitions, i.e. morning, afternoon, and evening
time. The results of measurements of water quality
parameters can be seen in Table 4, namely:
Table 4. Average results of measurements of water
quality for seaweed cultivation.
Sampling Numbers Parameters
0 1 2 3 4
Salinity (‰) 34.3 34.4 34.8 35.4 34.4
Temperature
(⁰C) 29.8 30.8 28.6 28.3 29.7
pH 8.6 8.5 9.1 9.2 9.1
Flow (m/sec) 0.1 0.1 0.1 0.1 0.1
Visibility (%) 100 100 100 100 100
4. Conclusions and Suggestions
4.1 Conclusions
From the results of this study can be concluded that:
1. E. Cottonii seaweed and E. Spinosum were
cultivated on the same methods and locations,
seaweed E. cottonii had faster growth compared
with E. spinosum.
2. The daily growth of seaweed of E. spinosum
species during the first 10 days was faster than
seaweed of the species E. cottonii. However,
during the second 10 days to the third 10 days, E.
cottonii seaweed growth was faster than E.
spinosum.
3. The average weight of Euheuma cottonii for 40
days planting was 189.29 grams while the average
J. Environment 1(2014): 36–42 42
From these data, there was a weight difference
between the two species.
4. Conditions of waters in research location were
still in the normal range for growth of the two
species of seaweed cultivated.
4.2. Suggestions
The suggestion that can be made from the research
activities of seaweed growth rate is that that further
research needs to be done, with different treatment
methods, i.e. having to do with the methods of
cultivation and treatment place or a different location,
so as to know the different growth in different
locations.
References
Afrianto dan Liviawati, 1993.
Budidaya Rumput
Laut dan Cara Pengolahannya.
Bharata:
Jakarta
Anggadiredja, J, T., 2006.
Rumput Laut
. Penebar
Swadaya. Jakarta.
Arikunto, S. 1993.
Prosedur Penelitian Suatu
Pendekatan Praktek
. Rineka Cipta Jakarta.
Aslan, L. M., 2006.
Budidaya Rumput Laut
.
Kanisius . Yogyakarta.
Anugarah, 1990.
Potensi dan Pengembangan
Budidaya Perairan di Indonesia
. Lembaga
penelitian Indonesia. Jakarta.
Bambang, D., 2006.
Kajian Parameter
Oceanografi Terhadap Pertumbuhan Rumput
Laut (Eucheuma cottonii)
di Perairan Bluto
Sumenep Jawa Timur. Universitas Trunujoyo
Bangkalan Madura.
Deny, 2007. Uji Statistika (
Speak With Date
).
Forum Statistika Jakarta.
Dinas Kelautan dan Perikanan Provinsi Bali,
2009. Produksi Rumput Laut di Bali turusn
15,2%.
http://www.kabarbisnis.com/read/
282238
.
Depertemen Pertanian, 1992.
Budidaya Beberapa
Hasil Rumput Laut
. Departemen Pertanian.
Jakarta.
Hadi, S. 1986
. Metodology Research I.
Yayasan
Penerbit Fakultas Psikologi, UGM.
Yogyakarta.
Indriani, H., dan Sumiarsih, E., 2003.
Budidaya,
Pengolahan, dan Pemasaran Rumput Laut
(cetakan 7)
Penebar Swadaya, Jakarta.
Nazam, M. P. dan A. Surahman, 2004.
Dampak
Pengkajian Budidaya Rumput Laut di Nusa
Tenggara Barat.
Balai Pengkajian Teknologi
Pertanian NTB.
Santosa, G.W. 2003.
Budidaya Rumput Laut di
Tambak
. Program Community College.
Industri kelautan dan perikanan. Universitas
Diponegoro. Semarang.
Sediadi dan Budihardjo., 2000.
Rumput Laut
Komuditas Unggulan.
Grasindo Jakarta.
Setyati, A. W., 2003.
Pemasaran Budidaya
Rumput Laut.
Program Community College.
Industri Kelautan dan Perikanan. Universitas
Diponegoro Semarang. Semarang.
Soenardjo N., 2003.
Membudidayakan Rumput
laut
, Balai Pustaka Semarang.
Suptijah, 2002.
Rumput Laut.
http://
www.rumput
laut /com. Institut pertanian
Bogor. Bogor.
Winarno, 1996.
Teknik Pengolahan Rumput
Laut.
Pustaka Sinar Harapan. Jakarta.
© 2014 by the authors; licensee Udayana University, Indonesia. This article is an open access article distributed under the terms and conditions of the Creative Commons Attribution license