CHAPTER III
RESEARCH METHOD
In this chapter the writer explains about the research methodology. This chapter consists of approach and type of the study, place and time of the study, the population and sample of the study, research instrument try out, research instrument validity, research instrument reliability, the data collecting procedure and the data analysis procedure.
A. Method of the Study
The method in the study was Quantitative method. The writer used this method because the writer wanted to measure the effectiveness of using realia media in teaching vocabulary by test pretest and posttest. Quantitative research Inquiry employed operational definitions to generate numeric data to answer predetermined hypotheses or questions.1
B. Research Design
The design of this study was experimental design. Experimental design is a plan for an experiment that specifies what independent variables can be applied, the number of levels of each, how subjects are assigned to groups, and the dependent variable.2 The writer used the experimental design because the writer wanted to measure the effectiveness of using realia media in teaching vocabulary.
1
Donal Ary, Introduction to Research in Education (Eight edition), United State: Wadsworth (engage learning), 2010 p.648
2
Ibid, p. 641
The type of this study was Pre-experimental design. Pre-experimental designs do not have random assignment of subjects to groups or other strategies to control extraneous variables.3 The writer used Pre-experimental by One-Group Pre test–Post test Design, The one-group pre test–post test design usually involves three steps: (1) administering a pre test measuring the dependent variable; (2) applying the experimental treatment X to the subjects; and (3) administering a post test, again measuring the dependent variable. Differences attributed to application of the experimental treatment are then evaluated by comparing the pre test and post test scores. There was no control group. The writer gave pre-test to students, and then gave them treatment. After treatment was given, the writer gave students post-test. The writer used Pre-experimental design because the writer was not the real teacher of that school, so that the writer was not haved the authority to arrange the students into new groups such as the true experimental study. In this experiment the writer taught the students directly, firstly the writer to measure the students’ ability in vocabulary using realia media. The writer taught the students for six times by using realia media and then there was posttest in order to measure the students’ ability after treatment.
Table 3.1
One-Group Pretest–Posttest Design
Pretest Independent Posttest
Y1 X Y2
3
Notes:
Y1 : Pre-test.
X : Independent variable (Realia) Y2 : Post-test
C. Time and place of the study.
The place study was of SMP Islam Nurul Ihsan Palangka Raya. It located at Jl.Murjani. In this study, the writer conducted the study two months to collect the data. It was begun on Agustus 27th until September 26th 2015.
D. Population and Sample of the Study
1. Population
A population is defined as all members of any well-defined class of people, events, or objects.4 The population of this study was seventh grade students at SMP Islam Nurul Ihsan of Palangka Raya, there were four classes and the number of students were:
Table 3.2 Population
NO CLASSES NUMBER OF STUDENT
1 VII-1 31
2 VII-2 31
3 VII-3 31
4 VII-4 31
Total 124
2. Sample
A sample is a portion of a population.5 The techniques used in this study subjects are not randomly assign. In this study, the writer used cluster sample for the study. Cluster sampling according to Donal Ary is the unit chosen is not an individual but a group of individual who are naturally together.6 Then the writer took one class it was VII-1 which consisted of 31 students. In this study the writer taught by using realia media.
E. Research Instruments
1. Research Instrument
To get the data, the writer used test in this study. a. Test
A test is a set of stimuli presented to an individual in order to elicit responses on the basis of which a numerical score can be assigned.7 To get the data, the writer gave the test; it consists of pre test and post test. The function of pre test was to know pre-ability students’ vocabulary mastery before they used realia media. And the function of post test was to know post-ability students’ vocabulary mastery after they used realia media. The test was used to see the result of students’ vocabulary mastery. The score of the test was used to measure the effectiveness of realia media.
students’ vocabulary mastery. As Madsen’s suggestion that a good vocabulary test
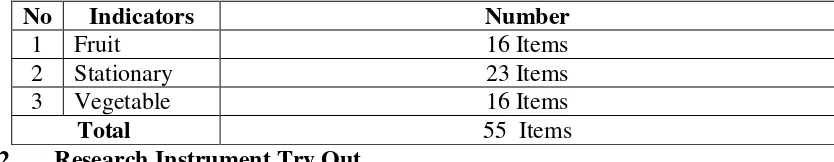
type for students who can read in the foreign language is multiple-choice completion because it makes the students depend on the context clues and sentences meaning.8 According to J.B Heaton, he states multiple choices in this type of recognition item the stem is replaced by a picture. The testees see the picture and have to select the most appropriate word relating to the picture from 4 or 5 options.9 The test was constructed in the form of multiple choices which consisted of 55 items test. 16 items test of concrete noun about fruit, 23 items test of concrete noun about stationary, and 16 items test of concrete noun about vegetable as were showed in table 3.3.
Table 3.3
The Content Specification of Test Items
No Indicators Number Ihsan Palangka Raya (VII-2). It was conducted on Thursday, Agustus 27th, 2015, at 11.45 – 13.05 pm; in VII-2 room with the number of student were 31 students which consisted of 100 items tes. To get the data of try out, the writer used some procedures as follows:
8
Harold S. Madsen, technique in testing, New York: Oxford University Press, 1983, p.16 9
a. The writer made and prepare test of try out. b. The writer gave test of try out to the students c. The writer asked the students to do test of try out. d. The writer collected the student’s answer.
e. The writer calculated and gave score to the students’ answer.
f. The writer analyzed the result of try out to know valid of test try out.
g. If the results were valid, it means that the test items as the instrument of this study was suitable to be give.
3. Research Instrument Validity
a. Instrument Validity
Validity of a test is the extent to which the test measures what is intended to measure.10 There are three types of validity:
a) Face Validity
Face validity is if a test item looks right to other testers, teachers, moderators, and testes.11 Descriptive Text was the learning material in the first semester at Junior High School. The writer made the type of test items suitable to the same level in the first year students at SMP Islam Nurul ihsan Palangka Raya. The face validity of the test items as follow:
1. The kind of test was Vocabulary Test.
2. The form of test items was Multiple Choices.
10
Norman E. Gronlund, Measurement And Evaluation In Teaching (Fifth Edition), New York: Macmilan Publishing Company, 1985, p. 11.
11
3. The language of items used English.
4. The test items were suitable to the Junior High School. 2. Content Validity
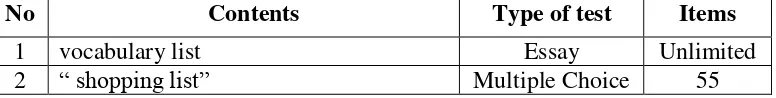
This kind of validity depends on a careful analysis of the language being tested and of the particular course objectives. The test should be so constructed as to contain a representative sample of the course, the relationship between the test items and the course objectives always being apparent.12 In making the test, the writer tried to match each of the test items with the syllabus and English book that used by SMP Islam Nurul Ihsan Palangka Raya. The writer made the test content (question) was related with material was taught to the students.
Table 3.4
Specification of Content Validity
No Contents Type of test Items
1 vocabulary list Essay Unlimited
2 “ shopping list” Multiple Choice 55
3. Construct Validity
If a test has construct validity, it is capable of measuring certain specific characteristics in accordance with a theory of language behaviour and learning.13 Type of test was vocabulary test; the forms of test were the students made list of vocabulary that they have and multiple choices test, and the test was written test. To
12
measure the validity of the instrument, the writer used software ANATES. Anates is software for the analysis item using Indonesian developed by Drs. Karnato, Pd, and Yudi Wibisono, ST., Registration number Copyright in the director general IPR: C00200400291-338. 14
The distribution of t table at alpha 5% and degree of freedom (n-2) with the measurement of validity using these criteria:
t observed ˃ t table = valid
t observed ˂ t table = invalid
To know the validity level of the instrument, the result of the test was interprets to the criteria below:15
0,800 - 1000 = very high validity 0,600 - 0,799 = high validity 0,400 - 0,599 = fair validity 0,200 - 0,399 = poor validity 0,00 - 0,199 = very poor validity
From the measurement of validity of the try out that was consisted 100 items was known that there were 55 valid items (item 1, 2, 8, 13, 14, 15, 17, 18, 19, 20, 22, 24, 25, 30, 31, 34, 37, 39. 40, 41, 42, 43, 44, 45, 46, 47, 48, 49, 50, 51, 53, 54, 55, 56, 57, 58, 60, 61, 62, 66, 67, 69, 73, 74, 75, 78, 79, 84, 86, 87, 88,94, 95 and 100), and there
14
Syahabuddin Nur, Analisis Kualitas Butir Soal Mata Pelajaran Bahasa Arab Kelas V Di Madrasah Ibtidaiyah Negeri Tempel Sleman Yogakarta Tahun Ajaran 2011-2012, Yogakarta: Universitas Islam Negeri Sunan Kalijaga Yogyakarta, 2012, P. 38
15
were 45 invalid items (item 3, 4, 5, 6, 7, 9, 10, 11, 12, 16, 21, 23, 26, 27, 28, 29, 32, 33, 35, 36, 38, 52, 59, 63, 64, 65, 68, 70, 71, 72, 76, 77, 80, 81, 82, 85, 89, 90, 91, 92, 93, 96, 97, 98 and 99).
4. Index difficulty
The index of difficulty (or the facility value) of an item simply shows how easy or difficulty the particular item proved in the test. The index of difficulty (F.V) is generally expressed as the fraction (or percentage) of the students who answered the item correctly. It was calculated by using ANATES software.
The result of the test was interpreted to the criteria below:16 0,00 – 0,30 = Difficult
0,31 – 0,70 = Fair 0,71 – 1,00 = Easy
The result of index difficulty measurement of the try out showed that there were 6 difficult items (item 46, 53, 64, 77 82, and 96), there were 11 easy items (item 2, 13, 28, 40, 44, 55, 61, 67, 87, 94 and 95), and there were 15 fair items (item 41, 42, 48, 50, 54, 56, 57, 62, 68, 73, 79, 81, 83, 86 and 100).
4. Research Instrument Reliability
Reliability also means the consistency with which a test measures the same thing all the time. Reliability of a test refers to its consistency with which it yields the
16
same rank for an individual taking the test several times.17 The reliability of the whole test can be estimated by using ANATES software.
The steps in determining the reliability of the test were: 18 a. Oppen ANATEST inc. Click ANATEST
b. Enter data, click New File, enter the data as follows:
Number of Subjects, Number of items, and the Number of Answers, Click OK.
c. Enter the answer key to the first line
d. Enter the students name on the column name or subject
e. Enter the students' answers on the cell / column is white, if the student not answering fill in the asterisks (*)
f. Click reliability, the output of result reliability is processed.
The result showed that the instrument was reliable. The reliability score was 0.90 while the standard of reliable is 0.60. Hence, it can be concluded that is reliable. At last, the writer limited the questions into 55 from 100 questions that were tested, with 45 questions were eliminated and some others were chosen as the questions after edited.
17
Norman E. Gronlund, Measurement And Evaluation In Teaching (Fifth Edition), New York: Macmilan Publishing Company, 1985, p. 14
18
F. Data Collection Procedure
To get the data, the writer used some procedures as follows: 1. The writer chosed the place of the study.
2. The writer determined one group, it is experiment group. 3. The writer gave pre test to experiment classes.
4. The writer checked the result of pre test.
5. The writer gave treatment to the experiment group using realia media, Such as: a. The teacher greets the students.
b. The teacher checks the attendance list.
c. The teacher motivates the students by asking some question. a. The teacher explains about vocabularies related to “shopping list”.
b. The teacher teaches vocabularies with the theme of “shopping list” by using realia.
c. The teacher gives some repetition to the students related to the teaching of vocabulary by using realia. To make students more creative and motivated in learning English, especially in learning vocabulary by using realia. Can make students easy to remember the word.
d. The teacher gives some question to the students about vocabulary “ shopping list”
f. The teacher evaluates for the students achievement by analyzing the score and exercise to the students.
6. The writer gave post test to experiment classes. 7. The writer checked the result of post test.
8. The writer gave score to students’ answer (pre test and post test). G. Data Analysis procedure
To analyze the data collect; the writer used some procedures in this study: 1. The writer gave collected the student’s score of pre test and post test at SMP
Islam Nurul Ihsan Palangka Raya.
2. The writer collected the data of the students’ test result.
3. The writer gave score the students’ test result by using the formula:
Score = 𝐵
𝑁× 100%
Where:
B : Frequency of the correct answer N : Number of test items
4. The writer tabulated the data into the distribution of frequency of score table, then looking for the mean, median and modus of students’ score, standard
deviation, and standard error of experiment group. a. Mean
𝑀𝑥 = ∑𝑓𝑥
Where: Mx : Mean
Fx : Total result product between each score with frequency N : Number of case
b. Median
𝑀𝑑𝑛 = 1 +
1 2
𝑁 − 𝑓𝑘𝑏
𝑓𝑖 ×𝑖
Where:
Mdn : Median
N : Number of case
Fkb : Cumulative frequency located in under interval contain median Fi : Authentic frequency (frequency of score contain median) I : Interval class
c. Modus
𝑀𝑜 = 1 + 𝑓𝑎
𝑓𝑎+𝑓𝑏×𝑖
Where:
Mo : Modus
Fa : frequency located in above interval contain modus Fb : frequency located in under interval contain modus I : Interval class19
d. Standard Deviation
𝑆𝐷 = ∑𝑓𝑥²
𝑁 Where:
SD : Standard Deviation i : Interval
N : Number of students e. Standard Error
𝑆𝑒𝑚= 𝑠𝑑
𝑛−1 Where:
Sem : Standard Error Sd : Standard Deviation N : Number of students20
5. The writer calculated normality and homogeneity. a. The writer calculated normality by using SPSS 20
Normality used to know the normality of the data that is going to be analyzed whether have normal distribution or not.
b. Homogeneity
It was used to know whether experimental group, that are decided, come from population that has relatively same variant or not. The formula is:21
20Ibid , p. 60 21
F = Bigger Variant Smaller Variant
Where:
F : Frequence
The hypotheses in homogeneity:
Fvalue ≤ Ftable, means both of variants are homogeneity. Fvalue > Ftable, both of variants are homogeneity.
If calculation result of F was lower than F table by 5% degree of significance so Ho was accepted, it meant that group have same variant. 6. The writer calculated the data by using statistical t-test to answer the problem of
the study.
To analyzed the data, the writer used “t” test. “t” Test to test the hypothesis of
the study. To examine the hypothesis, the writer used t-test formula as follows:
t0 = 𝑀𝐷
𝑆𝐸𝑀𝐷
MD : Mean of difference
SEMD : The standard error of the mean difference.
To know the hypothesis is accepted or rejected using the criterion: a) If t-test (the value) ≥ ttable it means Ha is accepted and Ho is rejected. b) If t-test (the value) ≤ ttable it means Ha is rejected and Ho is accepted.22
7. The writer calculate the degree of freedom by using the following formula: Df = N – 1
8. The writer determined the level of significant of tobserved by comparing the tobserved with the ttable.
9. The writer interpreted the result of analyzing.
10. The writer discussed and concluded the result of the data analysis. H. Scoring rubric
To gave score the students’ test result was done by using the formula:
a. Formula = scores acquisition / high scores x 100.23
b. Score: x100% N
B
B : frequency of the crect answere N : Number of test item.
23