NONPARAMETRIC STABILITY ANALYSIS OF YIELD FOR NINE CHILI PEPPER
(Capsicum annuum
L.
)
GENOTYPES IN EIGHT ENVIRONMENTS
Vitria Puspitasari Rahadi1), Muhamad Syukur2*), Sriani Sujiprihati2) and Rahmi Yunianti2) 1) Center for Tropical Horticulture Studies Bogor Agricultural University Baranangsiang
Jl. Padjajaran Bogor West java Indonesia
2) Horticulture and Agronomy Department Faculty of Agriculture Bogor Agricultural University Darmaga Jl. Meranti Bogor West java Indonesia
*) Corresponding author Phone: +62-251- 8629348 Email : [email protected]
Received: January 11, 2013/ Accepted: May 18, 2013
ABSTRACT
The objectives of this study were to compare nonparametric stability measures, and to identify promising high yield and stability of chili pepper (Capsicum annuum L.) genotypes in eight environments. In every environment, a Randomized Complete Block Design was used with three replications. The method of Nassar and Huehn, Kang, Fox, and Thennarasu was used to analyze the stability and high yield. Spearman’s correlation and Principal Component analysis distinguishes the methods based on two different concepts of stability: the static (biological) and dynamic (agronomic) concepts. The top method was found to be the dynamic stability. Meanwhile, the methods of Si1, Si2, Si3, Si6, Npi1, NPi2, NPi3 and NPi4 were found to be the static stability. Based on the ranking frequency stability of the nonparametric method, the genotypes with the highest frequency of static stability ranking were genotypes IPB002003, IPB002046, IPB009019 and Tit Super, whereas IPB009002 and Tombak were categorized as those of dynamic stability. Genotype IPB120005 and IPB019015 were less adaptable in the multiple environments tested. It shows that the genotypes were specific in certain environments. IPB120005 had high yield and specific location in Boyolali in dry season and IPB019015 genotype was specific in Bogor in wet season.
Keywords: chili pepper, nonparametric stability, high yield, dynamic stablility
INTRODUCTION
Stable yield is very substantial in the formation of high yielding varieties (Aryana, 2009). This needs to be considered systematically and
continuously, starting from the establishment of the base population to the testing of candidate varieties. The appearance of plants depends on the genotype, environmental conditions, and interaction between genotype and environment. Plant growth is the function of genotype and environment. Specific plant responses to diverse environments lead to an interaction between genotype and environment (G x E); a great effect of interaction would directly reduce the contribution of genetic components to the final appearance of plants (Anniciarico, 2002). This suggests that the development of plants should be directed to obtain varieties that can adapt to a wide variety of environmental conditions. The testing of yield stability through a series of multi-location testing is an important step before a new variety is released. The result of multi-location testing is expected to obtain genotypes that can adapt well and be stable in certain environments (Sujiprihati et al., 2006).
Yield stability studies based on the interaction of genotype x environment have been widely conducted among others by the Finlay-Wilkinson (1963), Eberhart and Russell (1966), Francis and Kannenberg (1978), and Gauch (2006). Mattjik et al. (2011) reported that the interaction of genotype and environment is complex because of the variations in the environmental components. The interaction of genotype and environment can also hinder the progress of selection, disrupt the selection of exellent varieties in a testing of varieties (Eberhart and Russell 1966), and make it difficult to make appropriate conclusion if a genotype test is performed in a wide range of environments (Nasrullah, 1981).
The testing of yield stability on the genotypes of free pollinated chili pepper in this study used a non parametric method. Huehn in Akcura and Kaya
Accredited SK No.: 81/DIKTI/Kep/2011
(2008) suggests that the nonparametric procedure has several advantages compared to the parametric stability. These benefits are the reduction of bias caused by outliers, no assumptions needed of the observed values, and ease of use in interpreting, adding, or deleting unsuitable genotypes.
The nonparametric method put forwad by Huehn (1990), Nassar and Huehn (1987), Kang (1988), Fox et al. (1990), and Thennarasu (1995) was based on the ranking of genotypes in each environment. Genotypes are considered stable if they are in the top rank. Nonparametric methods in the analysis of stability can give the response pattern of a genotype to environmental changes so that it can facilitate the selection of varieties suitable for environment and provide optimal yield. This study was aimed to 1) compare and explore different methods of nonparametric stability analysis, 2) identify genotypes free pollinated chili that has a good stability and high yield potential.
MATERIALS AND METHODS
The testing of yield stability on chili was conducted in four locations (Bogor, Boyolali, Riau and Sumedang) and in two growing seasons (July 2010 - January 2011, February-July 2011). A total of 20 genotypes were used in the experiments, consisting of 15 genotypes of free pollinated chili, namely: IPB120005, IPB110005, IPB001004, IPB002003, IPB002005, IPB002046, IPB015002, IPB002001, IPB009002, IPB009003, IPB009004, IPB009015, IPB 009019, IPB015008, IPB019015 and 5 commercial varieties of free-pollinated chili for comparison, namely Gelora, Tit Super, Tombak, Lembang and Trisula.
The testing in each location used a randomized complete block design with three replications in each experimental site and nested
replications within the site. Each location had 60 experiment units, each of which consisted of 20 plants. Chili seeds were planted in trays of sterile seedling media. Transplanting seedlings to the field was done after the age of 7 weeks after sowing. Each replication was divided into 20 beds with the size of 1 x 5 m and the height of beds of 20 cm, and 50 cm spacing between beds. Calcification was then performed with a dose of 1.5 tons/ha and base fertilizer (Urea of 150 kg/ha, SP-18 of 300 kg/ha and KCl of 200 kg/ha, the beds were covered with silver-black plastic mulch and the planting holes were made using cemplong method with the distance of 50 cm x 50 cm with the depth of 20 cm. Plant maintenance involved replanting, watering, fertilizing, weeding and
cutting unproductive branches. Pest and disease control was intensively given as needed. Harvesting was done twice a week after the population produced 75% of ripe fruits.
Data analyses consisted of the analysis of variance followed by nonparametric stability analysis with 10 methods of Si1, Si2, Si3 dan Si6 (Nassar and Huehn, 1987), Rank-Sum (Kang 1988), Top (Fox et al., 1990) and NPi1, NPi2, NPi3 and NPi4 (Thennarasu, 1995) against the production characteristics of each plant.
RESULTS AND DISCUSSION
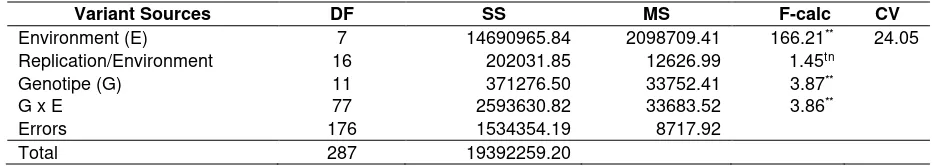
The variant analysis of the combined 12 chilli genotypes tested in 8 environments showed that the environment, genotype and the interaction of genotype x environment had significant effect on the production characteristics of each plant (Table 1). This suggests that different environments have different response to the tested genotypes. Mattjik
et al. (2011) states that the extent of the effect of G x E interaction is highly dependent on the genotype and the complexity of environment influence.
Table 1. Variant analysis of the combined production per plant
Variant Sources DF SS MS F-calc CV
Environment (E) 7 14690965.84 2098709.41 166.21** 24.05 Replication/Environment 16 202031.85 12626.99 1.45tn Genotipe (G) 11 371276.50 33752.41 3.87** G x E 77 2593630.82 33683.52 3.86** Errors 176 1534354.19 8717.92
Total 287 19392259.20
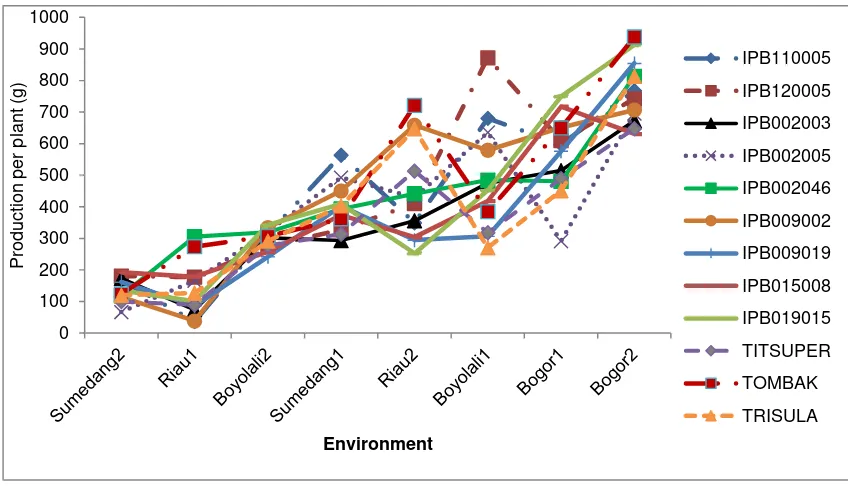
Figure 1. Response of genotipe x environment interaction (GxE) The interaction response was mainly
indicated by the production fluctuations, resulting in an increased productivity that was different in the genotypes in each testing site (Figure 1). A genotypes or even a variant would not always produce the same yield when grown in different environments. This is because of the high variability in the macro geophysical environment that will result in a very large diversity in the growing environment (Satoto et al., 2009).
The genotype of IPB001004 had the highest production per plant compared with other genotypes (Table 2), and also the highest yield per plant in the environment of Boyolali 1 and Sumedang 2. The Genotype of IPB019015 had the highest average of production per plant compared
with other genotypes in Bogor. The highest production per plant in Riau 1 and Riau 2 were respectively from IPB019015 and IPB009002 genotypes, whereas in Sumedang 1 it was from IPB110005.
The average yield of Bogor in season 2 is higher than that of Bogor in season 1. This is thought so because high rainfall leads to high frequency of diseases. In contrast, Sumedang and Boyolali in season 1 had higher production per plant than that of season 2. This is due to the high intensity of pest attacks in the dry season. The low production in Riau 1 was caused by the frequent attack of Gemini virus and the delayed wet season. In general, Bogor environment is better than other environments.
0 100 200 300 400 500 600 700 800 900 1000
Pro
d
u
c
ti
o
n
p
e
r p
la
n
t
(g
)
Environment
IPB110005
IPB120005
IPB002003
IPB002005
IPB002046
IPB009002
IPB009019
IPB015008
IPB019015
TITSUPER
TOMBAK
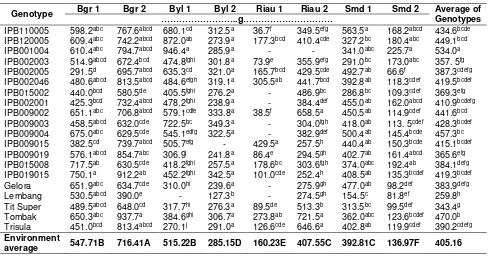
Table 2. Production per plant 15 chili genotypes in 8 environment
Genotype Bgr 1 Bgr 2 Byl 1 Byl 2 Riau 1 Riau 2 Smd 1 Smd 2 Average of Genotypes ………..g………
IPB110005 598.2abc 767.6abcd 680.1cd 312.5a 36.7f 349.5efg 563.5a 168.2abcd 434.6bcde IPB120005 609.4abc 742.2abcd 872.0ab 273.9a 177.3bcd 410.4cde 327.2bc 180.4abc 449.1bcd IPB001004 610.4abc 794.7abcd 946.4a 285.9a - - 341.0abc 225.7a 534.0a IPB002003 514.9abcd 672.4bcd 474.8fghi 301.8a 73.9e 355.9efg 291.0bc 173.0abc 357. 5fg IPB002005 291.5d 695.7abcd 635.3cd 321.0a 165.7bcd 429.5cde 492.7ab 66.6f 387.3cdefg IPB002046 480.6abcd 813.5abcd 484.6efgh 319.1a 305.5ab 441.7bcd 392.8ab 118.3cdef 419.5bcdef IPB015002 440.0bcd 580.5de 405.5fghi 276.2a - 486.9bc 286.8bc 109.3cdef 369.3efg IPB002001 425.3bcd 732.4abcd 478.2fghi 238.9a - 384.4def 455.0ab 162.0abcd 410.9bcdefg IPB009002 651.1abc 706.8abcd 579.1cdfe 333.8a 38.5f 658.5a 450.5ab 114.9cdef 441.6bcd IPB009003 458.5abcd 632.0cde 722.5bc 349.3a - 304.0fgh 418.0ab 113. 5cdef 428.3bcdef IPB009004 675.0abc 629.5cde 545.1edfg 322.5a - 382.9def 500.4ab 145.4bcde 457.3bc IPB009015 382.5cd 739.7abcd 505.7efg - 429.5a 257.5h 440.4ab 150.3bcde 415.1bcdef IPB009019 576.1abcd 854.7abc 306.9i 241.8a 86.4e 294.5gh 402.7ab 161.4abcd 365.6efg IPB015008 717.5ab 630.5cde 418.2fghi 257.5a 178.6bc 303.6fgh 374.0abc 192.4ab 384.1defg IPB019015 750.1a 912.2ab 452.2fghi 342.5a 101.0cde 252.4h 408.5ab 135.3bcdef 419.3bcdef Gelora 651.9abc 634.7cde 310.0hi 239.6a - 275.9gh 477.0ab 98.2def 383.9defg Lembang 530.5abcd 390.0e - 127.3b - 274.5gh 154.5c 81.8ef 259.8h Tit Super 489.5abcd 648.0cd 317.7hi 276.3a 89.5de 513.3b 313.5bc 99.5def 343.4g Tombak 650.3abc 937.7a 384.6ghi 306.7a 273.8ab 721.5a 362.0abc 123.6bcdef 470.0b Trisula 451.0bcd 813.4abcd 270.1j 291.0a 126.6cde 646.6a 402.8ab 119.9cdef 390.2cdefg
Environment
average 547.71B 716.41A 515.22B 285.15D 160.23E 407.55C 392.81C 136.97F 405.16
Remarks: Bgr1 (Bogor season 1), BGR 2 (Bogor season 2), Byl 1 (Boyolali season 1), Byl 2 (Boyolali season 2), Riau 2 (Riau season 2), Smd 1 (Sumedang season 1), Smd 2 (Sumedang season 2).The numbers followed by the same letter in the same column and a number followed by a capital letter on the line means not significantly different based on Duncan's test at the level of 0.05%.
Nonparametric stability analysis in this study measured the stability of nine chili genotypes based on ranks in 8 environments. Table 3 shows the mean production of 12 genotypes of chili and the resulted calculation of nonparametric stability index. The genotype of Tombak produced the highest yield per plant compared with other genotypes, then followed by the genotypes of IPB120005, IPB009005 and IPB110005.
Nonparametric Stability Index (NSI) based the method of Nassar and Huenh (1987) showed that Tit Super was the most stable genotype. This is because Tit Super has the smallest NSI on Si2, Si3 dan Si6. The next stable genotype is IPB002003, while the genotype IPB019015 is an unstable one.
Kang Method (1988) (RS) is the sum of the rankings in production with the Shukla method. The smallest value from the sum indiactes the genotype is stable. Kang method found the
genotype IPB002046 to be the most stable, followed by the genotypes IPB110005 and IPB009002. Kang method also found that the genotype IPB002005 was unstable (Table 4).
Table 3. Average production and nonparametric stability values of 9 chili genotypes in 8 environments
Genotype Y Si1 Si2 Si3 Si6 Top RS NPi1 NPi2 NPi3 NPi4 IPB110005 435 5.86 12.84 15.98 6.89 37.50 3 2.63 0.48 0.21 0.76 IPB120005 449 5.71 11.36 13.83 8.02 37.50 6 2.63 0.44 0.21 0.73 IPB002003 357 5.43 7.27 6.26 5.85 12.50 4 2.50 0.31 0.14 0.49 IPB002005 387 6.64 16.29 17.54 10.38 37.50 12 3.13 0.57 0.20 0.71 IPB002046 420 5.07 8.55 10.64 4.76 37.50 1 1.88 0.38 0.16 0.57 IPB009002 442 5.79 13.70 17.84 8.52 62.50 3 3.13 0.89 0.23 0.80 IPB009019 366 6.21 10.57 9.25 3.75 12.50 8 3.13 0.39 0.14 0.49 IPB015008 384 7.07 18.41 18.75 8.44 37.50 11 3.38 0.42 0.20 0.72 IPB019015 419 5.79 14.13 20.28 4.67 50.00 8 3.00 0.67 0.26 0.95 Tit Super 343 5.14 5.55 4.26 1.78 12.50 8 2.50 0.26 0.10 0.34 Tombak 470 5.43 11.27 16.18 7.85 50.00 6 4.13 0.83 0.31 1.06 Trisula 390 5.79 9.64 9.31 3.12 12.50 11 2.75 0.39 0.17 0.60
Remarks: Y average production per plant from 9 genotypes in 8 environments, Si1,Si2,Si3and Si4 (Nassar and Huenh 1987), Top (Fox et al., 1988), RS (Kang, 1990). NPi1,NPi2, NPi3, NPi4 (Thennarasu, 1995)
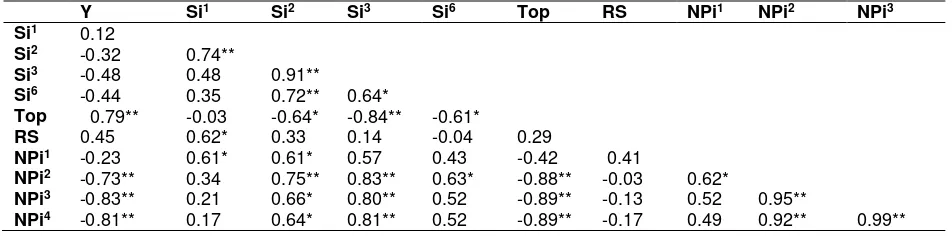
Table 4. Spearman correlation of nonparametric stability parameter against the yield of 9 chili genotypes in 8 environments
Y Si1 Si2 Si3 Si6 Top RS NPi1 NPi2 NPi3
Si1 0.12
Si2 -0.32 0.74**
Si3 -0.48 0.48 0.91**
Si6 -0.44 0.35 0.72** 0.64*
Top 0.79** -0.03 -0.64* -0.84** -0.61*
RS 0.45 0.62* 0.33 0.14 -0.04 0.29
NPi1 -0.23 0.61* 0.61* 0.57 0.43 -0.42 0.41
NPi2 -0.73** 0.34 0.75** 0.83** 0.63* -0.88** -0.03 0.62*
NPi3 -0.83** 0.21 0.66* 0.80** 0.52 -0.89** -0.13 0.52 0.95**
NPi4 -0.81** 0.17 0.64* 0.81** 0.52 -0.89** -0.17 0.49 0.92** 0.99** Remarks: * and ** : significant at the levels of 0.05 % and 0.01% Y: average production per plant of 9 genotypes in 8
environments, Si1,Si2,Si3and Si4 (Nassar and Huenh, 1987), Top (Fox et al., 1988), RS (Kang, 1990). NPi1,NPi2, NPi3, NPi4 (Thennarasu, 1995)
The stability values were obtained from the Thennarasu method from the corrected ranking. The smallest value indicates that a genotype is more stable compared with other genotypes. Based on the stability index of Thennarasu, Tit super and IPB002003 were the most stable genotypes, while Tombak variety was the most unstable (Table 3).
Each method of nonparametric stability analysis produced a different ranking for each genotype. To demonstrate the relationship of the various methods of stability and production, this study used the Spearman correlation. Table 4 shows that the average production of chili is significantly and positively correlated to the Top
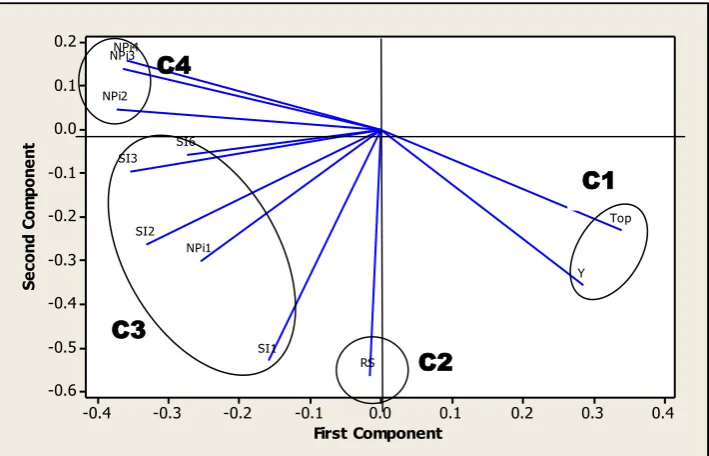
Figure 2. Principal Component Analysis of production ranking and 10 nonparametric stability methods in 9 chili genotypes in 8 environments
The result of Principal Component Analysis (PCA) describes the relationship between the nonparametric stability methods based on the correlation matrix already made (Figure 2). Zulhayana (2010) said that nonparametric stability index of a high and positive correlation with production can identify dynamically stable genotype. PCA divides the nonparametric stability methods into 4 groups. Top parameter and average production (Y) are in the same group (C1). Rank-Sum (RS) is in group C2. Methods Si1, Si2, Si3, Si6, and Npi1 are in group C3, whereas NPi2, NPi3 and NPi4 are in group C4.
Principal component analysis separates different methods based on two concepts of stability, namely dynamically stable (agronomic) and statically stable (biological). Group C1 shows the concept of dynamic stability. This is because the Top method has the highest and positive correlation with the average production, 0.79. Sabaghnia et al. (2006) and Mut et al. (2008) state that Top and RS methods are included in the dynamic stability concept. Mohammadi et al. (2007) adds that Top method is related to high production. Based on the results of this study, RS method did not have a correlation with production and top method. This is
because the calculated stability value of RS method was the sum of the production rankings and shukla variants. The effect of high environmental diversity leads to changes in the stability value by RS method.
The stability of groups C2, C3 and C4 shows the concept of static stability. This is because the stability method of the three groups is significantly and negatively correlated to production. Sabaghnia
et al. (2006), Mohammadi and Amri (2008) report that a significant correlation with the methods Si1, Si2, Si3 and Si6 was found on legume crops. Nassar and Huehn (1987) suggest that the methods of Si1 and Si2 are related to the concept of static stability. Stability methods can be used in selecting the best genotypes of a high production. Mut et al. (2009) adds that a stable genotype classification is based on different environmental conditions.
The production component is an important characteristic in stability testing of chili pepper plants. The stability of a genotype is determined based on the number of ranking frequencies obtained from the stability methods. Table 5 shows the ranking frequency for the two stability concepts: dynamic and static.
C1
C3
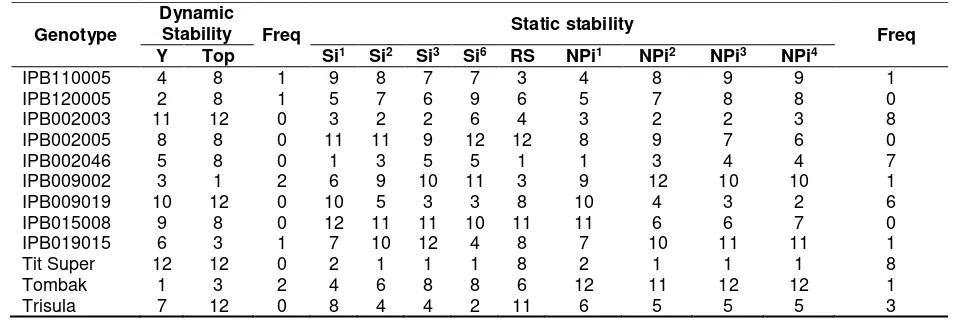
Table 5. Ranking of production and nonparametric stability of 12 genotypes in 8 environments
Genotype
Dynamic
Stability Freq Static stability Freq Y Top Si1 Si2 Si3 Si6 RS NPi1 NPi2 NPi3 NPi4
IPB110005 4 8 1 9 8 7 7 3 4 8 9 9 1 IPB120005 2 8 1 5 7 6 9 6 5 7 8 8 0 IPB002003 11 12 0 3 2 2 6 4 3 2 2 3 8 IPB002005 8 8 0 11 11 9 12 12 8 9 7 6 0 IPB002046 5 8 0 1 3 5 5 1 1 3 4 4 7 IPB009002 3 1 2 6 9 10 11 3 9 12 10 10 1 IPB009019 10 12 0 10 5 3 3 8 10 4 3 2 6 IPB015008 9 8 0 12 11 11 10 11 11 6 6 7 0 IPB019015 6 3 1 7 10 12 4 8 7 10 11 11 1 Tit Super 12 12 0 2 1 1 1 8 2 1 1 1 8 Tombak 1 3 2 4 6 8 8 6 12 11 12 12 1 Trisula 7 12 0 8 4 4 2 11 6 5 5 5 3
Remarks: Y= average production per plant of 9 genotypes in 8 environments, Si1,Si2,Si3and Si4 (Nassar and Huenh, 1987), Top (Fox et al. 1988), RS (Kang 1990). NPi1,NPi2, NPi3, NPi4 (Thennarasu, 1995)
The genotypes with the highest rank of static stability frequencies are IPB002003, IPB002046, IPB009019 and Tit Super. The concept of static stability is highly dependent on the range of region and testing sites. If the range of testing sites is more extensive, resulting in more diverse site conditions, then the concept of stability will change. The genotypes categorized as dynamically stable frequency based on ranking frequency are IPB009002 and Tombak. Both genotypes are sensitive to environmental changes and adapt specifically to optimum environment.
The genotypes of IPB120005 and IPB019015 were less adaptative to some environments tested. It can be seen from the different production per plant in each environment (Table 2). However, in certain environments both genotypes resulted in high production. This shows that the genotypes are specific to certain environments. Based on the potential production, the genotype IPB120005 is suitable to grow in Boyolali in the dry season, while IPB019015 is suitable in the rainy season in Bogor.
The concept of static and dynamic stability can also be based on the comparison of genotypes tested. The static stability of a geno-type compares the yield variability in some environments,while the dynamic stability compares the yield variability of a genotype in some environments and the yield variability of other genotypes in a single set of testing. This indicates that the concept of dynamic stability explains the genotype variability by comparing
directly with other genotypes. The concept of dynamic stability is more appropriate as the basis of selecting genotypes at the time of releasing genotype varieties because this stabiltity concept can explain the stability and adaptability of a genotype. However, the production potential of a genotype should still be considered. This is related to the purpose of releasing varieties that still need improvement in production quantity.
CONCLUSION
Based on the testing of nonparametric stability methods, two concepts of stability are obtained, namely dynamic stability (agronomic) and static stability (biological). The Top Method is included in the concept of dynamic stability. The methods of Si1, Si2, Si3, Si6, Npi1, NPi2, NPi3 and NPi4 are included in the concept of static stability. Based on the ranking frequency of nonparametric stability methods, four genotypes are obtained and categorized as genotypes with static stability, namely IPB002003, IPB002046, IPB009019 and Tit Super, while the genotypes categorized as those of dynamic stability are IPB009002 and Tombak.
ACKNOWLEDGMENTS
Many thanks are delivered to the team of Grant Research I-MHERE B2c IPB 2010. On behalf of Dr. Muhamad Syukur, SP, Msi
REFERENCES
Akcura, M and Y. Kaya. 2008. Nonparametric stability methods for interpreting genotipe by environment interaction of bread wheat genotypes (Triticum aestivum L.). Genetics and Molecular Biology 31: 906-913.
Annacchiarico, P. 2002. Genotype x environment interaction, challenges and opportunities for plant breeding and cultivar recommendation. Rome: Food and Agriculture Organization of the Unites Nations. pp.105.
Aryana, I.G.P.M. 2009. Adaptation and yield stability of red rice line in three growing environments. J Agron Indonesia. 37 (2): 95-100
Eberhart, S.A. and W.A. Russel.1966. Stability parameters for comparing varieties. Crop Sci 6: 36-40.
Finlay, K.W. and G.N. Wilkinson.1963. The analysis of adaptation in a plant breeding programme. Aust J Agric Res 14: 742-754.
Francis, T.R. and L.W. Kannenberg.1978. Yield stability studies in short-season maize. A descriptive method for grouping geno-types. Can J Plant Sci. 58: 1029-1034. Fox, P.N., B.K. Skovmand, H.J. Braun and R.
Comier. 1990. Yield and adaptation of hexaploid spring triticale. Eupthyca 47: 57-64.
Huehn, M. 1990. Non parametric measures of phenotypic stability. Eupthyca7: 189-194 Gauch, H.G. 2006. Statistical analtsis of yield trials by AMMI and GGE. Crop Sci 46 : 1488-1500.
Kang, M.S. 1988. A rank-sum method for selecting high yielding, stable corn genotypes. Cereal Res Comm 16: 113-115.
Nasrullah, 1981. A Modified procedure for identifying varietal stability. Agric Sci. 3(4): 153-159.
Nassar, R. and M. Huehn. 1987. Studies on estimation of phenotypic stability : test of significance for parametric measures of phenotypic stability. Biometric 43: 45-53. Mattjik, A.A., I.M. Sumertajaya, A.F. Hadi, and
G.N.A. Wibawa. 2011. Additive Main-effect and Multiplicative Interaction (AMMI) Modeling : present and future (in Indonesia). Bogor : IPB Press. 271p. Mohammadi, R., A. Abdulahi, R. Haghoarast, M.
Aghaee, and M. Rostaee. 2007. Non-parametric methods for evaluating of winter wheat genotypes in multi-environment trial. Agric.Sci.3(2):137-242. Mohammadi, R. and A. Amri. 2008. Comparison of parametric and nonparametric methods for selecting stable and adapted durum wheat genotypes in variable environ-ments. Eupthyca 159: 419-255.
Mut, Z., N. Aydin, H.O. Bayramoglu and H. Ozcan. 2009. Interpreting genotipe x environment interaction in bread wheat (Triticum aestivum L.) genotipes using nonparametric measures. Turk J Agric
33: 127-137
Sabaghnia,N.,H.Dehghani and S.H.Sabaghpour. 2006. Nonparametric methods for interpreting genotipe x environment interaction of lentil genotipes. Crop Sci
46: 1100-1106.
Satoto, S.T.W. Utomo, Y. Widyastuti and I.A. Rumanti. 2009. Submission of release for new hybrid rice variety H45, H47, H64, H68 and H78. [Paper of Variety Release on Trial]. Subang : Balai Besar Penelitian Padi. pp.20.
Sujiprihati, S. M. Syukur and R. Yunianti. 2006. The analysis of stability of seven sweet corn populations using Additive Main Effect Multiplicative Interaction (AMMI) (In Indonesia). Bul. Agron 34(2): 93-97. Thennarasu, K. 1995. On certain non parametric
procedures for studying genotype-environment interactions and yield stabilitiy [Thesis]. New Delhi : PJ School, IARI. pp.54.