Site this Article As ……….
Paper Accepted : January, 30th 2018
Paper Published : March, 8th 2018 87
DETERMINATION OF STANDARD TIME IN PACKAGING
PROCESSING USING STOPWATCH TIME STUDY TO FIND
OUTPUT STANDARD
Rio Prasetyo Lukodono1), Siti Kholisotul Ulfa2) 1), 2)Department of Industrial Engineering
Universitas Brawijaya Malang
Abstract Time is one of the factors to assess a worker's performance in utilizing the available resources.
Operator in his work requires efficient time to improve work productivity. One of factory in produce a shrimp feed in Surabaya has a large production level. In the production process, the packaging department in this company still uses human resources in their production process and the company define the standard of production without using standard time. This paper investigates the opportunity a logical analysis in determining the standard time in this company. The determination of the standard time in the packaging process requires comprehensive analysis. Objects observed are four operators in the packaging department that carried out the activities of filling bag the shrimp feed with 40 replication for each data. The workmeasurement was conducted by direct method using Stopwatch Time Study (STS) with snap-back method. The
results of this study indicate the standard time value of the four lines packaging is not much different or almost the same. Sequentially the standard time workers line 1 to line 4 is 7.325 seconds, 7.240 seconds, 7.225 seconds, and 7.065 seconds. Allowance used for workers is 8%. However, the existing production rate of company is higher than the production rate of work measurement calculation. This is due to the difference of definition in employee allowance rate and performance rating.
Keywords: Output Standard , Productivity, Standard time, Stopwatch time study
1. Introduction
Industrial competition make the company will always grow and provide the difference in the form of competitive advantage. To have a competitive advantage the company will seek to optimize their inputs consisting of machinery, labor, energy, capital, information to produce a product. One of the characteristics of a company that has a competitive advantage is a company that is able to respond to customer demand quickly. Timeliness is one factor in generating competitive advantage in addition to unique products, customer value, and financial value[1]. Company must be able to improve production activities in order to supporting the company's efforts in meeting the needs. one way that companies can do to improve productivity is through work measurement [2]. Production is related to time in every company. Company must balanced the processing time in order to ensure the
* Corresponding author. Email : [email protected] Published online at http://Jemis.ub.ac.id
Copyright ©2017 JTI UB Publishing. All Rights Reserved
smoothness of flow processing.
Conversely, if the process time is not balanced, then the production process is not optimal and cause the bottle neck problem. Company engaged in the manufacture of shrimp feed is one of the processes still use human in department of packaging. But in the process the company has not set the standard time in accordance with the rules that can later be used in the calculation of standard output. Work measurement will make the job easier due to standard work elements and timings that eliminate waste and inconsistency [3], [4]. In addition, through work measurement can also improve efficiency in the use of equipment that can support efficiency in the man machine interactions [5].
Site this Article As ……….
Paper Accepted : January, 30th 2018
Paper Published : March, 8th 2018 88
The determination of this standard time is very important for production especially for production which still uses manual process (human labor) as main factor. Anything that supports the workforce should be considered including performance rating and allowance. Performance rating is an activity used to assess or evaluate the speed of an operator's work [8]. Performance rating is done by comparing the assessment with the ability of existing standards that is the standard of the worker's ability under normal conditions. While allowance is the calculate the standard time on 4 line packaging of shrimp feed product, to determine the allowance that can be given during work, and determine the comparative analysis of output from company with standard output calculation. This research was conducted by observing the 4 operators in each line packaging in process of filling shrimp feeding bag. The data taken in 40 replication consisting of 3 elements of work. The timing of work standard is to use direct measurement which is stopwatch time study with snap back method. Measurement performance rating using Westing House System Rating. Assuming Confidence Level of 95% and Degree of Accuracy of 5%, and normal distribution of data.
2. Research Methods
This study was conducted by measuring working time by sequence such as activity time measurement, uniformity test, adequacy test,
determination of performance rating,
allowance, standard time, and standard output.
a. Measurement of activity time
b. This measurement is to identify the
average time of shrimp feed filling activity. This time measurement is done by using stopwatch time study with snap back method. The result will be tested for
𝑥̅ : average of processing time
𝜎 : deviation standard of data
d. Testing adequacy of Data
Testing adequacy of data is done on result of a set activity time with the aim whether data collection has been sufficiently representative of the population. To perform this test use 5% accuracy and 95% confidence [9].
e. Determination of performance rating
The determination of the performance rating is to observe the activities 1) Personal needs of the operator
2) Fatigue performance rating and allowance. This standard time is useful for companies in
Site this Article As ……….
Paper Accepted : January, 30th 2018
Paper Published : March, 8th 2018 89
After obtaining the standard time, we can calculate the standard output (unit) with equation 3 [6].
𝑂𝑢𝑡𝑝𝑢𝑡 𝑠𝑡𝑎𝑛𝑑𝑎𝑟𝑑 =𝑊𝑠1 (3)
3. Result and Discussion
In this section, explained about data collection, data processing, and data interpretation. The following is a description of the results and discussion related to the standard time and standard output of shrimp feed companies.
3.1 Data Collection
Prior to data collection, the equipment required for a working measurement activity with stopwatch include:
1. Stopwatch 2. Time study board 3. Time study form
4. Stationery 5. Calculator
Then separate of work into several elements of work. Below is the elements in the packaging process.
Table 1. Element of work at Packaging Processing
No Work Element Symbol
1 Loading shrimp feed bag into
machine A
2 Fill the bag with shrimp feed
untill full B
3 Set the bag for sewing process C
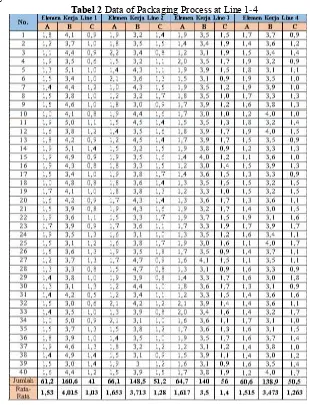
Time data (second) taken from packaging departemen we can see at table 2. To analyze the conformity of time given to the target set by the company that we can see at table 3, we need amount of data and hours of employee out source as a comparative calculation.
Site this Article As ……….
Paper Accepted : January, 30th 2018
Paper Published : March, 8th 2018 90
Table 3. The Amount of Data dan Feed Processing Time
Table 4. The Amount of Data and Total Production Time
Line Total
Pallet Amount of Unit Work Hour
1 24 1680
3.2.1 Uniformity Test at Packaging
The following is a uniformity test of data for each work element's data:
For example the uniforminty fof data from line 1.
Average processing time at work element A with interval confidency 95%, k = 2
𝑋̅ =∑ 𝑋𝑖
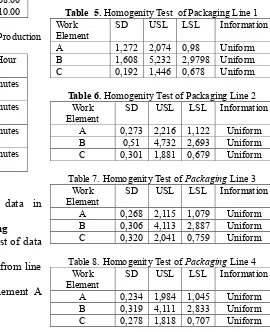
From the graph at figure 1 explains that the data value of each element A lies between the upper limit data control value and the lower control limit. So the data value is not the outlier (in control). With the same calculation obtained the following results at table 5 until table 8.
Figure 1. Graph Test Uniformity Test Elements A Line 1
Table 5. Homogenity Test of Packaging Line 1 Work
Element SD USL LSL Information
A 1,272 2,074 0,98 Uniform
B 1,608 5,232 2,9798 Uniform
C 0,192 1,446 0,678 Uniform
Table 6. Homogenity Test of Packaging Line 2 Work
Element SD USL LSL Information
A 0,273 2,216 1,122 Uniform
B 0,51 4,732 2,693 Uniform
C 0,301 1,881 0,679 Uniform
Table 7. Homogenity Test of Packaging Line 3 Work
Element SD USL LSL Information
A 0,268 2,115 1,079 Uniform
B 0,306 4,113 2,887 Uniform
C 0,320 2,041 0,759 Uniform
Table 8. Homogenity Test of Packaging Line 4 Work
Element SD USL LSL Information
A 0,234 1,984 1,045 Uniform
B 0,319 4,111 2,833 Uniform
C 0,278 1,818 0,707 Uniform
3.2.2 Adequate Test Packaging Data
From the test, indicates that the data is sufficient with indication the number of samples (N) = 40 is greater than the number of samples that should be taken (N ') = 13. With same calculation Table 9 show us about the result of adequate test for other line.
3.2.3 Allowance Values for Packaging
Operator
Site this Article As ……….
Paper Accepted : January, 30th 2018
Paper Published : March, 8th 2018 91
from operator moving pallet to storage.
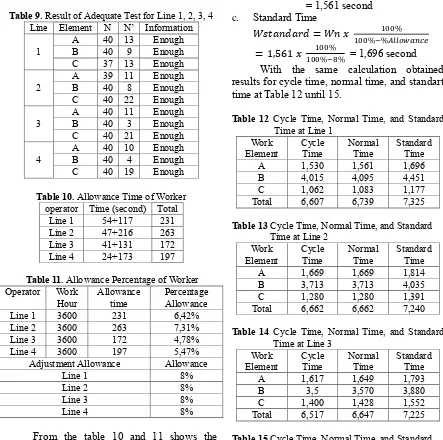
Table 9. Result of Adequate Test for Line 1, 2, 3, 4
Table 10. Allowance Time of Worker operator Time (second) Total
Line 1 54+117 231
Line 2 47+216 263
Line 3 41+131 172
Line 4 24+173 197
Table 11. Allowance Percentage of Worker
Operator Work
Hour Allowance time Percentage Allowance
Line 1 3600 231 6,42% allowance on each worker by rounding up. The result of allowance is used in the next calculation.
3.2.4 Calculation of Cycle Time, Normal
Time, Standard Time, Standard Output at Packaging Process
Calculating of cycle time, normal time, and standard time we considering the value of the predetermined peformance rating and allowance. Below is the example. line 1:
Element 1:
With the same calculation obtained results for cycle time, normal time, and standart time at Table 12 until 15.
Table 12 Cycle Time, Normal Time, and Standard Time at Line 1
Work
Element Cycle Time Normal Time Standard Time
A 1,530 1,561 1,696
B 4,015 4,095 4,451
C 1,062 1,083 1,177
Total 6,607 6,739 7,325
Table 13 Cycle Time, Normal Time, and Standard Time at Line 2
Work
Element Cycle Time Normal Time Standard Time
A 1,669 1,669 1,814
Element Cycle Time Normal Time Standard Time
A 1,617 1,649 1,793
B 3,5 3,570 3,880
C 1,400 1,428 1,552
Total 6,517 6,647 7,225
Table 15 Cycle Time, Normal Time, and Standard Time at Line 4
Work
Element Cycle Time Normal Time Standard Time
A 1,515 1,575 1,713
B 3,473 3,611 3,925
C 1,263 1,313 1,427
Total 6,250 6,500 7,065
Result of standard time in at line 1-4 use to calculate output standard using equation 3.
1. Output standard for line 1
𝑂𝑢𝑡𝑝𝑢𝑡 𝑠𝑡𝑎𝑛𝑑𝑎𝑟𝑑 =𝑆𝑡𝑎𝑛𝑑𝑎𝑟𝑑 𝑇𝑖𝑚𝑒1 = 7,3251 unit/second = 0,137 unit/second
Site this Article As ……….
Paper Accepted : January, 30th 2018
Paper Published : March, 8th 2018 92
2. Output standard for line 2
𝑂𝑢𝑡𝑝𝑢𝑡 𝑠𝑡𝑎𝑛𝑑𝑎𝑟𝑑 =𝑆𝑡𝑎𝑛𝑑𝑎𝑟𝑑 𝑇𝑖𝑚𝑒1 = 7,2401 unit/second = 0,138 unit/second
= 8,287 unit/minutes ≈ 9 unit/minutes
3. Output standard for line 3
𝑂𝑢𝑡𝑝𝑢𝑡 𝑠𝑡𝑎𝑛𝑑𝑎𝑟𝑑 =𝑆𝑡𝑎𝑛𝑑𝑎𝑟𝑑 𝑇𝑖𝑚𝑒1
= 7,2251 unit/second = 0,138 unit/second
= 8,303 unit/minutes ≈ 9 unit/minutes
4. Output standard for line 3
𝑂𝑢𝑡𝑝𝑢𝑡 𝑠𝑡𝑎𝑛𝑑𝑎𝑟𝑑 =𝑆𝑡𝑎𝑛𝑑𝑎𝑟𝑑 𝑇𝑖𝑚𝑒1 = 7,0651 unit/second = 0,142 unit/second
= 8,492 unit/minutes ≈ 9 unit/minutes
3.3 Data Interpretation
The company in calculating the productivity of workers in the packaging only by dividing the number of production units with total working hours.
Productivity =𝑂𝑢𝑡𝑝𝑢𝑡 𝑝𝑎𝑐𝑘𝑎𝑔𝑖𝑛𝑔 (𝑢𝑛𝑖𝑡 𝐼𝑛𝑝𝑢𝑡)𝑤𝑜𝑟𝑘 ℎ𝑜𝑢𝑟𝑠(𝑂𝑢𝑡𝑝𝑢𝑡) (4)
Based on the company's production data can be calculated as follows:
Line 1 :
Final Output = 560 unit : 60 minutes = 9,333 unit/minutes ≈ 10 unit/minutes Line 2 :
Final Output akhir = 560 unit : 60 menit = 9,333 unit/menit
≈ 10 unit/minutes
Line 3 :
Final Output = 490 unit : 60 minutes = 8,167 unit/minutes ≈ 9 unit/minutes Line 4 :
Final Output = 560 unit : 60 menit = 9,333 unit/menit ≈ 10 unit/menit
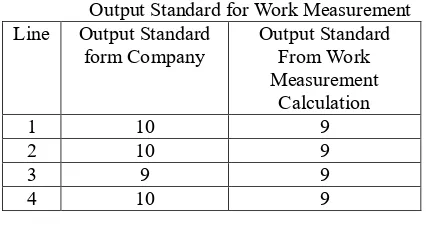
Based on Table 16. Shows the results of calculation of productivity of the company is greater than the results of the calculation of the
work measurement. This is because the company does not take into account the allowance and performance rating for workers.
Table 16. Comparison Between Output Target with Output Standard for Work Measurement Line Output Standard
form Company Output Standard From Work Measurement workers, 8 percent allowance can be used for all workers in every working hours. Calculations by the authors can be used as a reference or standard of the productivity of each worker. Thus, workers are expected to increase productivity over time to be able to exceed output targets. In addition, from the company at least also helps increase the productivity of 98.20%; then the OEE values obtained 81.73%. The dominant factor of losses is high downtime due to mechanical motor breakdown that is 24% or 1160 minutes, and duration of setup time is 19.4% or 935 minutes.
Site this Article As ……….
Paper Accepted : January, 30th 2018
Paper Published : March, 8th 2018 93
materials and fuel, as well as conducting training to employees at all levels.
4. Conclusion
From result of observation of work measurement by using stopwatch method of Time Study at 4 line packaging can be concluded as follows: Standard time is a reasonable time required by a normal worker to complete his work done in the best working system of the day. From the calculation results obtained standard time required in completing the target company of 4 line packaging is not much different / almost the same. Sequentially the standard time workers line 1 to line 4 is 7.325 seconds, 7.240 seconds, 7.225 seconds, and 7.065 seconds. Thus, have a level of ability or productivity that is not much different. Allowance is special times needed for personal needs, rest breaks, and other reasons out of control. The sharing of this case study allowance is to chat with co-workers, clean hands of feed dust, and influence the waiting time for forklifts from carriers that move pallets to storage. Determination of allowance can be the largest allowance has been able to represent a small allowance. Comparison of company output with standard timing output on 4 line packaging, ie the output produced by the company is higher than the calculation output. Ouput company with calculation output there is difference difference, sequentially from line 1 to line 4 workers that is 1 unit / minute, 1 unit / minute, 0 unit / minute, and 1 unit / minute in reaching production target. This is due to the influence of employee allowance and performance rating.
Suggestions that can be given are: The addition of a forklift to reduce the waiting time on moving the pallet to the warehouse or by changing the warehouse layout to facilitate the searching or placement of the finished feed. Companies may use standard time to make judgments in determining hours of work or
incentives for workers.
REFERENCES
[1] Pearce dan Robinson. Manajemen
Strategis. Jakarta: Binarupa Aksara; 1997.
[2] Hartanti, Lusia Permata Sari. Work
Measurement Approach To Determine Standard Time In Assembly Line. International Journal of Management and Applied Science. 2016; ISSN: 2394-7926 Volume-2, Issue-10, Special Issue-1
[3] Bon, Abdul Talib, Ariffin, Aliza. An
Impact Time Motion Study In The Automation Process. J Nov App Sci. 2012; 1 (1): 17-24
[4] Bhiradi, Iswar, Singh, B.K. Work
Measurement Approach For Productivity Improvement In A Heavy Machine Shop. 5th International & 26th All India Manufacturing Technology, Design and Research Conference (AIMTDR 2014). 2014; December 12th–14th, IIT Guwahati, Assam, India
[5] Patel, Nirav. Reduction In Product Cycle
Time in Bearing Manufacturing Company. International Journal of Engineering Research and General Science. 2015;
Volume 3, Issue 3, May-June
[6] Wignjosoebroto, Sritomo. 2008. Ergonomi
Studi Gerak dan Waktu. Surabaya: Surabaya: Guna Widya.
[7] Raut, Satish Keru.A Case Study of
Productivity Improvement by using IE Tools, Novateur Publications International
Journal Of Innovations In
Engineeringresearch And Technology
[IJIERT]. 2014: VOLUME 1, ISSUE 1
NOV 2014
[8] Satriyanto, Edi, Yuwono, Wiratmoko.
Pembuatan Media Teknik Pengukuran Produktivitas Pekerja Terintegrasi Pada
Perangkat Pengamat Waktu. Prosiding
Site this Article As ……….
Paper Accepted : January, 30th 2018
Paper Published : March, 8th 2018 94
[9] Barnes, R. M. 1980. Motion and Time
Study, Design and Measurement of Work.