49
EVALUATION OF PHYSIOLOGICAL RESPONSE TO STRESS
USING FUZZY LOGIC
Wisnu Wijayanto Putro
Department of Industrial Engineering /Faculty of Engineering, Brawijaya University
Abstract
The human stress level is rather intangible, and therefore cannot be directly measured. However,this stress can be correlated to external and/or internal factors, which are rather tangible things, such as heart rate, Systolic-Diastolic Blood Pressure, salivary α-amylase, and skin temperature. These factors measurements are provided in wide ranges and vary individually lends itself naturally to fuzzy sets and fuzzy logic. This research is aimed at assessing respondents stress level through the changes of physiological factors above over time. The subjects of this study are 10 healthy adults, aged between 23-35 years old. The measurement time divided into four periods, namely pre-stressor, stressor-I, stressor-II and post stressor period. Pauli-test and mental arithmetic test was used as stressors. Obtained data were analyzed using Fuzzy Inference System (FIS) toolbox in MATLAB. By using fuzzy inference system model, the system succeeds to predict subject stress value/index based on subject physiological value. The result showed that the changes in human factors affects human stress value/index, although the subjects stated that their stress level on the same level their physiological factors were changed during measurement, and the models showed the changes of subject stress value during different period of measurement time.
Keywords: stress, physiological factors, fuzzy logic, fuzzy inference system, stress value/index
1. INTRODUCTION
Stress is tension forms of physical, psychological, emotional and mental. Form of this tension affect an individual's daily performance. Even stress can make productivity decreased, pain and mental disorders. Basically, stress is a form of tension, both physical and mental. According to Vermeulen [6], stress is anything that cause an individual to feel they are losing control. It includes anxiety and fear. Anxiety deals with imagined or unreal dangers. Fear deals with ‘actual’ or ‘threatened’ dangers. Kirschbaum and Hellhammer [5] classified stress as human body stress and cell stress, psychological stress and physical stress, as well as eustress and distress. Eustress is a psychological condition that comfortable and have a positive impact (comfortable and/or positive psychological states), and distress is uncomfortable and have a negative impact (uncomfortable and/or negative psychological states). Hans Selye [6] defined stress in physiological terms as, ‘a non-specific or generalized bodily response. This response results when any demand is made on the body, whether it is an environmental condition that an individual must survive, or a demand that is being made in order to accomplish a personal
* Corresponding author. Email : [email protected] Published online at http://Jemis.ub.ac.id
Copyright ©2016 JTI UB Publishing. All Rights Reserved
goal.Every living creature had experienced stress in their life. Stress is an uncomfortable condition that is felt by individuals due to exposure to a stressor that has not been or cannot be addressed by the mechanisms of homeostasis. Physical or mental stimulation or both can be a stressor. Stimulus provided by the stress contributed to the change and growth of individuals. Humans are creatures who always respond and adapt to stress. Stress response is adaptive and protective. Homeostasis is a dynamic mechanism, because this mechanism is always related to the dynamics activities of individual that are always changing [2].
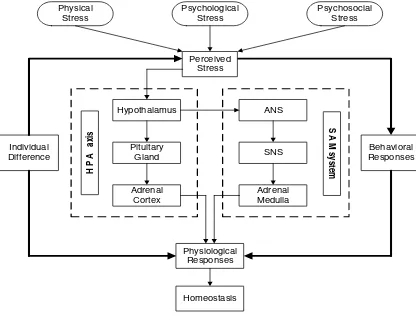
Response to stress involves several physiologic activities, among others, the activation of autonomic nervous system, the HPA axis (hypothalamic-pituitary-adrenal), and immune systems, which work in a coordinated, simultaneous, interactive and complex to avoid damage caused by stressors or stress.
50 ways, simultaneously and in an unconscious
state, includes the function of regulating, coordinating, and adjusting vital functions, among others, blood pressure and blood flow, body temperature, respiration, digestion, metabolism, and elimination. Autonomic nervous system is strongly influenced (strongly affected) by the emotional or psychological and also an important part of the expression associated with psychomotor behavioral aspect. Some of ANS's expressions include blushing, pallor, palpitations of heart rate, clammy hands, and dry mouth [3].
Figure 1. The pathway of stress
There are two branches of the ANS that are designed to regulate the fight-or-flight response on a constant basis. The sympathetic nervous system is the part of the ANS that is responsible for initiating the fight-or-flight response. Each time when human have a thought of danger or pain, the sympathetic nervous system initiates the fight-or-flight response to prepare the body to handle the potential danger or pain. The other branch of the autonomic nervous system is called the parasympathetic nervous system. This branch of nervous activity is designed to return the physiology to a state of homeostasis, or balance, after the threat, danger, or potential pain is no longer perceived to be imminent [1], the illustration of stress pathway inside human body is described in Fig. 1
2. STUDY RATIONALE
Understanding human stress level is something complicated. Humans in their response to stress is different for each individual. Human experience in overcoming problems / situations, individual characteristics, gender, age, physical or mental condition of the
individual and the behavioral difference when the stress response itself will give variations on individual stress level. Based on that, individual's stress response systems (i.e. HPA axis and SAM system) will reacts differently from each individual to another when imposed to stressor. Therefore, the physiological responses to stress of human beings is different each other. In other word, each human bodies have different reaction in order to maintain their body system in homeostasis state when human felt threatened or in dangerous situation.
Most of human's difficult to describe their stress level in some situation, they can felt if their body is in under stress , but it’s difficult to judge their stress level, whether the stress level is on low, medium or high level. Sometimes human also describe that their stress level on the same level, even though their physiological response have different value from time to time (i.e. pre-stressor, stressor-I, stressor-II, and post-stressor). According to those facts, it is believed that there is different value/index of stress level if the physiological responses have different value each times. Further, it is important to know human stress value/index rather than merely described the stress level in the form of stress – not stress or low–medium–high by evaluate its physiological changes. Hence, the Concept of Assessment approach applied in this research is fuzzy logic computing. This research is aimed at assessing respondents’ stress degree through their blood pressure data, heart rate, skin temperature and concentration of salivary amylase. It is assumed that fuzzy logic approach against stress level correspond to stress condition of the respondents.
3. MATERIAL AND METHOD 3.1 Experimental Design
51 given to the subjects to produce under pressure
or under stress situation, and makes the subjects exhausted during experiment. After the subjects exhausted, mental arithmetic test was given to stress period as shown in Fig. 2.
Pre-Figure 2. Experimental design
During the experiment, heart rate data was recorded continuously using Polar system. In the other hand, the concentration of salivary amylase, blood pressure, and skin temperature were obtained intermittent for each period. Firstly, the subjects instructed to wear a Polar system on their body and start recording in sitting position after instruction was given by observer. Second, the subjects were kept in a sitting position for 10 minutes and instructed to relax. In the first 5 minutes salivary amylase, blood pressure, and skin temperature were collected in the pre-stress condition. After this, the subject were tested the Pauli-Test in a sitting position for 30 minutes and salivary amylase, blood pressure, and skin temperature were collected in the end of test. They were further tested the mental arithmetic test for 15 minutes and the same data were collected after the test finished. Finally, the subjects were maintained in the sitting position for 20 minutes while post-stress salivary amylase, blood pressure, and skin temperature were collected again in the middle of post-stress period.
2.2 Experimental Tools
2.2.1 Questionnaire and Stressor
Before the stress measurement begin, each of subject was given a questionnaire. The questionnaire ask about subject’s activities and stress/emotional conditions approximately one hour before the measurement. They were further asked to give their subjectivity about
their stress/emotional condition in every period of measurement time (i.e. pre-stressor, stressor-I, stressor-Istressor-I, and post-stressor period). In the stressor-I period, subjects were given Pauli-Test as a stimulus. The aim of this test is to create stressful conditions. On this test, subjects were instructed to do the test as fast as possible for mathematic operations and each question has different time limit to solved, it depends on the difficulty level of the question.
2.2.2 Polar System
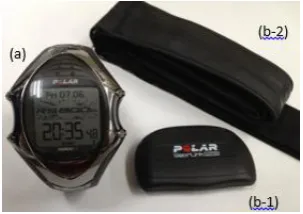
In this study we use Polar RS800CX type to record subject’s heart rate. This Polar system consists of (a) Polar RS800CX training computer to displays and records subject’s heart rate and other exercise data during exercise and (b-1,2) Polar WearLink W.I.N.D. transmitter to sends the heart rate signal to the training computer, it’s includes a connector (b-1) and strap (b-2) as shown in Fig. 3. During the experiment each subject have to wear this device properly to prevent misconnection between training computer and transmitter.
Figure 3. Polar system
2.2.3 Blood Pressure Monitor
52 pressure readings and 40 to 180 beats/minute
for pulse rates. The accuracy rate stands at ±3 mmHg for pressure and ±5 % of reading for pulse. In each period of measurement time, the subjects instructed to take their blood pressure in sitting position and are prohibited from doing any movement or speaking during blood pressure's data collecting.
Figure 4. Wrist BP monitor and Experimental setup
2.2.4 Salivary α-Amylase Monitor
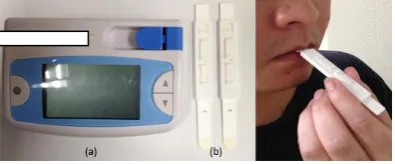
Subject’s concentration of salivary α -amylase were measured using salivary -amylase monitor (NIPRO Co., Ltd.). This device using non-invasive method to analyze salivary α -amylase and its displays a measurement range of 10 to 200 kIU/l for concentration of salivary α-amylase readings. The salivary amylase monitor consists of a measurement device and a strip-marker as shown in Fig. 5. The saliva is gathered with the strip-marker in Fig. 5(b), which the subject puts under his tongue for 30 s; the amylase is extracted using the measurement device in Fig. 5(a) for 30 s. The value of salivary α-amylase can be collected within 1 min, the salivary amylase data was collected four times during the experiment based on the period of measurement time. The salivary α-amylase index has the advantages of a short duration compared to other physiological indices. Clean saliva comes from under the tongue because an easily reached salivary gland is located there.
Figure 5. Salivary α-amylase monitor
2.2.5 Infrared Thermometer
Infrared thermometers measure temperature from a distance by detecting the amount of thermal electromagnetic radiation
emitted from the object being measured (Fig. 6). This allows observer to accurately measure subject's skin temperatures without made contact with the subject. This thermometer displays a measurement range of -60 to 500˚C. There are four reading modes in this device, i.e. maximum, minimum, differential and average. In this study, we use average reading mode to collecting subject's skin temperature, we measure both of palm hands of the subject within range of ±12 cm between skin surface and the device.
Figure 6. Infrared thermometer
2.3 MATLAB Analysis
2.3.1 Fuzzy Inference System Analysis Fuzzy inference system or fuzzy rule-based system is the process of formulating the mapping from a given input to an output using fuzzy logic. The mapping then provides a basis from which decisions can be made, or patterns discerned. The process of fuzzy inference involves all of the pieces: membership functions, fuzzy logic operators, and if-then rules. Fuzzy inference system consists of a fuzzification interface, a rule base, a database, a decision-making unit, and a defuzzification interface described in Fig. 7.
Inference system
(Decision-making unit)
Rule base
IF...THEN… IF...THEN… IF...THEN...
Database
Inputs MF
Fuzzification Interface
Defuzzification Interface Knowledge base
Input Output
(crisp) (fuzzy) (fuzzy) (crisp)
53
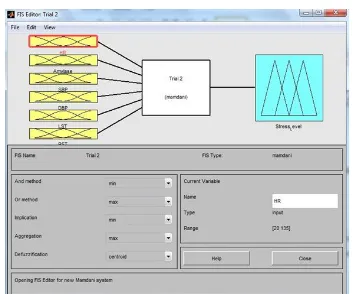
Figure 8. FIS model for stress level evaluation
In this study, MATLAB FIS Toolbox has been used as a tools to create fuzzy inference system with Mamdani-type for modeling the stress level (output) using human physiological factors namely heart rate, salivary α-amylase, blood pressure and skin temperature as input variables as shown in Fig. 8.
2.3.2 Fuzzification – Input Membership Function
The factors impact the human stress level and the stress level of different people in different ways. The amount of information presented by the various factors is enormous, thus drastically increasing the complexity of any model used to correlate the factors to the level of stress. In order to simplify the model by reducing the amount of data required to evaluate the model, we make use of fuzzy logic, where the input parameters are quantified with linguistic variables such as low, normal, and high which represent a wide range of input values. Following is a brief description of the factors used in our model and their membership function.
1. Heart Rate (HR): Three heart rate ranges are
identified, and categorized with fuzzy linguistic variable low (LHR) from 20-70 bpm, medium (MHR) from 45-100 bpm and high (HHR) from 84-135 bpm as shown in Fig. 9.
Figure 9. Heart rate membership function
2. Salivary α-Amylase (sAA): sAA measurements are given in frequency ranges, and can be represented with three linguistic variables, namely low, medium and high with ranges 10-45, 30-120 and 110-200 (kU/l) respectively.
3. Systolic Blood Pressure (SBP): Three
linguistic variables are used to implement SBP, low (70-120), medium (90-140), and high (120-200).
4. Diastolic Blood Pressure (DBP): Three
linguistic variables are used to implement DBP, low (35-75), medium (65-95), and high (80-135).
5. Skin Temperature – Left Hand (LST): Three
linguistic variables are used to implement DBP, low (18-24 ˚C), medium (24-29.5 ˚C), and high (26.5-37 ˚C).
6. Skin Temperature – Right Hand (RST): Three
linguistic variables are used to implement DBP, low (18-24 ˚C), medium (24-29.5 ˚C), and high (26.5-37 ˚C).
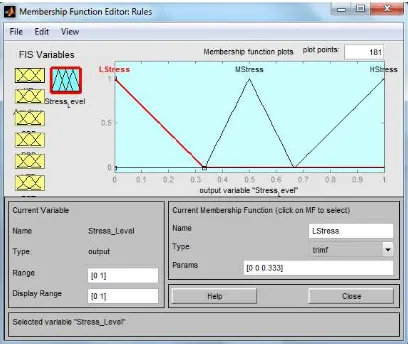
2.3.3 Fuzzification – Output Membership Function
54
Figure 10. Stress level membership function
2.3.4Fuzzification – Inference System
The correlation between the input and the output variables is done through a set of fuzzy rules. Each rule uses AND/OR connectors to connect various input factors with output variable. Three of 436 rules used in our model are listed below for illustration. In this study, rules were obtained from experiment’s data summary (see Appendix-1). For example, rule 1 shows all the input factors which produce the low stress level. In the FIS model, rules are assigned weights. The initial weights for all rules are set to 1.
1. If (HR is MHR) and (Amylase is LsAA) and (SBP is LSBP) and (DBP is MDBP) and (LST is HLST) and (RST is HRST) then (Stress_Level is LStress) (1)
2. If (HR is HHR) and (Amylase is MsAA) and (SBP is LSBP) and (DBP is LDBP) and (LST is HLST) and (RST is HRST) then (Stress_Level is MStress) (1)
3. If (HR is HHR) and (Amylase is MsAA) and (SBP is MSBP) and (DBP is LDBP) and (LST is HLST) and (RST is HRST) then (Stress_Level is HStress) (1)
2.3.5Defuzzification
When we try to solve a decision problem, we want the output to be a number (crisp value) and not a fuzzy set. For the stress level problem for instance, we do not want the system to tell us in which level the subject’s stress level for each period (i.e. low, medium, high). What we want to know is the exactly value of the stress level. Thus, the system needs to transform the fuzzy set into a single numerical value. In this
study, we used centroid of area which is one of the most popular defuzzification methods, which returns the center of the area under the fuzzy set. The output crisp value was obtained using the formula below:
∑ ( )
∑ ( ) (Eq. 1)
Where, z is the output crisp value, q is the number of rules and uc is the membership in
class c at value zj.
3. RESULT
3.1 Experiment Result
55
3.2 Fuzzy Inference System Result
After FIS success create the model, we able to enter the value of each subject’s physiological response into the model, then FIS will compute automatically the new output result in the form of value or index of stress level with range between 0 to 1. As mentioned before, we divide stress level into three levels, low (0-0.333), medium (0.333-0.666), and high (0.666-1). Figure 12 displays the stress level distribution result using fuzzy inference system’s model. By using this model, we can value is increased to 0,313. In stressor-II period, subject stress level is increased to medium level (0.462). After passed the stressor periods, subject enters the post-stressor period, where the stress level of subject still at medium level with stress level value decreased to 0.401. The fuzzy inference system’s result for all subjects is described in Appendix-3.
Figure 12. Stress distribution using fuzzy
inference system’s model
From FIS result we also know that experiment design to evaluate physiological responses to stress is shown linear correlation between measurement period and subject’s stress value/index. From the graph above, most of subject stress level value/index were increased during the pre-stressor to stressor-II period, and decreased from stressor-II to post-rather intangible, and therefore cannot be directly measured. However, this stress/emotion can be correlated to external and/or internal factors, which are rather tangible things, and hence they can be measured and analyzed.
The internal factors come from different parts of the body in several forms such as heart rate (HR), Systolic Blood Pressure (SBP), Diastolic Blood Pressure (DBP), salivary α -amylase (sAA) and skin temperature (ST). These factors’ measurements are provided in wide ranges and often their impacts vary from a person to a person and for different postures for the same person. For example, a given stressor for stress measurement may putting an individual in medium stress level based on their subjectivity, while the same stressor may reveal a rather low or high stress level for another individuals. According to Zadeh [4] this kind of behavior lends itself naturally to fuzzy sets and fuzzy logic (zero and one, true and false or black and white cannot present this kind of data). As functional - biology, each parameter is part of other parameters integratedly.
56 Figure 13. Stress distribution; subjectivity
stress vs FIS model
Although this system provides relatively easy decision-making processing, there are some difficulties to use this FIS model. The main problem is the number of variables, in this study we used seven variables (six inputs and one output) and combined it with three membership function value for each variable (low, medium, high) to create this model. Therefore, the number of variables will generate numerous number of rules, in this case the possible combinations of rules is 3^7 = 2187 rules.
In this study, 436 rules have been used to create FIS model, there are no overlapping rules, and therefore, 436 rules out of 2187 is still acceptable. Although the number of rules is acceptable, this number is too large, it can cause the decision making process consumes a lot of time. In that case, the use of adaptive neural fuzzy inference system (ANFIS) is proposed to make better and more accurate model. Adaptive neural fuzzy inference system is the combination between FIS and artificial neural network (ANN), the difference between FIS and ANFIS is in these systems’s inference system section. In FIS, we makes the rules by ourselves, it can be expert system or rule-based system. On the other hand, the ANFIS system will do self-learning to generate rules with the help of artificial neural networks system. Therefore, ANFIS will produce high speed decision-making processing in compare with FIS.
5. CONCLUSION
In this study we use a fuzzy logic inference system model to evaluate
physiological responses to stress using six different measurable human factors, and the changes of the value of these physiological factor is believed affects human stress value/index. These human factors are used as input data for the system. Subjects perceived stress also necessary as output data for the system. The factors are converted into fuzzy variables and used in a set of rules to detect the stress value/index of subjects. In conclusion, the result showed that the changes in human factors affects human stress value/index, although the subjects stated that their stress level on the same level their physiological factors were changed during measurement, and the models showed the changes of subject stress value during different period of measurement time.
REFERENCE
[1.] Sands, R 2002, ‘The Power of the Parasympathetic Nervous System,’ Stress News, October, Vol. 14, No. 4.
[2.] Burchfield, SR 1979, The Stress Response: A New Perspective, Psychosomatic
Medicine, Vol. 41, No. 8, pp. 661 – 672.
[3.] Carroll, EW, Curtis, RL 2005, Organization and Control of Neural Function, in Pathophysiology Concepts of
Altered Health States, ed. CM Port,
Lippincott Williams & Wilkins, Philadelphia, pp. 1149 – 1154.
[4.] Malkawi, M, Murad, O 2013, Artificial neuro fuzzy logic system for detecting human emotions, Human-centric
Computing and Information Sciences, Vol.
3, No. 3, pp. 1 – 13.
[5.] Yamaguchi, M, Kanemori, T, Kanemaru, M, Takai, N, Mizuno, Y, Yoshida, H 2004, Performance evaluation of salivary amylase activity monitor, Biosensor and
Bioelectronic, vol. 20, pp. 491 – 497.
57 Appendix-1. Input’s Membership Function
(a) salivary α-Amylase (sAA) MF (b) Systolic blood pressure (SBP) MF
(c) Diastolic blood pressure (DBP) MF (d) Left skin temperature (LST) MF
58 Appendix-2. Experiment’s Data Summary
Subject Periods HR sAA SBP DBP LST RST Perceived Stress
1
Pre 82 11 111 77 30.8 30.8 Low
I 87 25 111 73 29 31.3 Low
II 88 61 104 68 28.6 32.3 Medium
Post 88 38 108 75 29.4 30.3 Low
2
Pre 93 45 104 66 27.3 27.9 Medium
I 103 69 130 73 27.6 32.3 Medium
II 95 48 107 72 30.8 33 Low
Post 95 42 113 67 30.3 32.2 Low
3
Pre 96 44 110 80 27.8 28 Medium
I 109 78 114 72 31 32.9 High
II 102 52 121 86 29.4 31.9 High
Post 100 41 114 73 28.1 29.8 Medium
4
Pre 78 66 109 71 25.4 24.4 Low
I 79 54 109 56 23.3 21.3 Low
II 75 32 110 78 24.4 24.1 Low
Post 77 15 110 75 23.3 22.9 Low
5
Pre 75 116 113 63 30.1 28.6 High
I 89 149 110 64 27.9 29.6 High
II 84 162 111 82 28.6 30.3 High
Post 77 160 80 64 27.8 29.3 High
6
Pre 79 89 95 58 33.2 33.6 Medium
I 80 92 99 62 34.4 35.8 High
II 79 82 103 74 32.3 33.3 Medium
Post 76 82 99 64 32.4 33.1 Medium
7
Pre 96 51 106 71 32.9 33.8 Medium
I 111 89 116 72 33.6 34.5 High
II 103 54 111 64 32.1 33.2 Medium
Post 99 46 116 72 32.6 33 Medium
8
Pre 75 46 112 72 31.2 31 Low
I 77 57 111 90 27.9 31.3 Medium
II 70 91 120 76 28.4 30.9 High
Post 74 83 114 74 25.8 29.3 Medium
9
Pre 93 79 105 65 32.6 33.6 Medium
I 104 107 105 66 33.1 34.4 High
II 114 144 117 68 31.3 33.6 High
Post 95 87 102 67 32.3 33.2 Medium
10
Pre 101 29 128 80 31.8 28.9 Low
I 106 21 116 81 30.6 31.2 Low
II 98 72 121 69 32 27 Medium
59 Appendix-3. Fuzzy Inference System’s Result Summary
Subject Periods HR sAA SBP DBP LST RST Perceived Stress FIS Model
1
Pre 82 11 111 77 30.8 30.8 Low 0.272
I 87 25 111 73 29 31.3 Low 0.313
II 88 61 104 68 28.6 32.3 Medium 0.462
Post 88 38 108 75 29.4 30.3 Low 0.401
2
Pre 93 45 104 66 27.3 27.9 Medium 0.462
I 103 69 130 73 27.6 32.3 Medium 0.518
II 95 48 107 72 30.8 33 Low 0.475
Post 95 42 113 67 30.3 32.2 Low 0.44
3
Pre 96 44 110 80 27.8 28 Medium 0.453
I 109 78 114 72 31 32.9 High 0.513
II 102 52 121 86 29.4 31.9 High 0.533
Post 100 41 114 73 28.1 29.8 Medium 0.44
4
Pre 78 66 109 71 25.4 24.4 Low 0.367
I 79 54 109 56 23.3 21.3 Low 0.154
II 75 32 110 78 24.4 24.1 Low 0.372
Post 77 15 110 75 23.3 22.9 Low 0.154
5
Pre 75 116 113 63 30.1 28.6 High 0.532
I 89 149 110 64 27.9 29.6 High 0.848
II 84 162 111 82 28.6 30.3 High 0.852
Post 77 160 80 64 27.8 29.3 High 0.85
6
Pre 79 89 95 58 33.2 33.6 Medium 0.455
I 80 92 99 62 34.4 35.8 High 0.456
II 79 82 103 74 32.3 33.3 Medium 0.43
Post 76 82 99 64 32.4 33.1 Medium 0.456
7
Pre 96 51 106 71 32.9 33.8 Medium 0.479
I 111 89 116 72 33.6 34.5 High 0.514
II 103 54 111 64 32.1 33.2 Medium 0.5
Post 99 46 116 72 32.6 33 Medium 0.497
8
Pre 75 46 112 72 31.2 31 Low 0.437
I 77 57 111 90 27.9 31.3 Medium 0.467
II 70 91 120 76 28.4 30.9 High 0.464
Post 74 83 114 74 25.8 29.3 Medium 0.462
9
Pre 93 79 105 65 32.6 33.6 Medium 0.474
I 104 107 105 66 33.1 34.4 High 0.503
II 114 144 117 68 31.3 33.6 High 0.848
Post 95 87 102 67 32.3 33.2 Medium 0.475
10
Pre 101 29 128 80 31.8 28.9 Low 0.309
I 106 21 116 81 30.6 31.2 Low 0.303
II 98 72 121 69 32 27 Medium 0.493
