Journal of Physics: Conference Series
PAPER • OPEN ACCESS
Economic Valuation on Change of Tourism Quality
in Rawapening, Indonesia: An Application of
Random Utility Method
To cite this article: S Subanti et al 2017 J. Phys.: Conf. Ser. 824 012037
View the article online for updates and enhancements.
Related content
Economic valuation of mangrove ecosystem: empirical studies in Timbulsloko Village, Sayung, Demak, Indonesia
T A Perdana, J Suprijanto, R Pribadi et al.
-Increase Economic Valuation of Marine Ecotourism Spots In Small Islands Siska D. Rahakbauw, Wellem A. Teniwut, Meiskyana R. Renjaan et al.
-Prevalence of Antibiotic-resistance Enterobacteriaceae strains Isolated from Chicken Meat at Traditional Markets in Surabaya, Indonesia
R Yulistiani, D Praseptiangga, Supyani et al.
Economic Valuation on Change of Tourism Quality in
Rawapening, Indonesia: An Application of Random Utility
Method
1Department of Statistics Faculty of Mathematics and Natural Science, Universitas Sebelas Maret
2Department of Economic Development Faculty of Economics and Business, Universitas Sebelas Maret
3Department of Economics Faculty of Economics and Business, Universitas Kristen
SatyaWacana
4Department of Economic Development, Universitas Ahmad Dahlan 5 Faculty of Economics and Business, Universitas Darul Ulum Islamic Centre Sudirman
GUPPI
6Department of Economic Development, Universitas Terbuka 7Faculty of Economics and Business, Universitas Indonesia
8Center for Research and Development for Tourism (PUSPARI), Universitas Sebelas Maret 9Institute for Research and Social Services, Universitas Sebelas Maret
Abstract. This study aims to determine the profit (loss) earned economic actors tourism activities if the condition or quality of tourism in Rawapeningbeimproved(deteriorated). Change condition or quality can be seen by traveling expenses, natural environment, Japanese cultural performances, and traditional markets.The method used to measure changes in the economic benefits or economic loss with a random utility approach.The study was found that travel cost, natural environment, Japanese cultural performances, and traditional markets have significant factors about respondent preferences to choose the change of tourism condition. The value of compensation received by visitors as a result of changes in conditions improved by 2,932 billion, while the change in the condition worsens by 2,628 billion. Recommendation of this study is the local government should consider environmental factors in the formulation of tourism development in Rawapening.
1. Introduction
Rawapening, administratively, located in Semarang Regency, Central Java Province, Indonesia. It located in four districts, including Banyubiru, Tuntang, Bawen, and Ambarawa. Rawapening represents one of developing tourism destination. Rawapening development should pay attention to visitors preferences. It is important that changes in the condition or quality of tourism can provide multiple benefits for both the tourism (visitors) and tourism management (local government) [4].
This study analyzed changes occurring conditions associated a in the condition or quality of tourism Rawapening. Change condition or quality of tourism could be expected to affect the preferences of visitors and potential visitors to Rawapening. The combination of changes in conditions or the quality of tourism expressed regarding attributes. There are four attributes to formulate changes
Corresponding author: [email protected]
S Subanti1,8,9a), BRM B Irawan2,8,9, G Sasongko3, and A R Hakim3,4,5,6,7,9
in the condition. The four attributes are (a) travel cost, (b) the natural environment; (c) Javanese cultural arts performances and (d) traditional market.
Based on this background, the objective of this study is determinant of respondent choose the changing of tourism quality in Rawapening and how much economic value if the Rawapening condition (quality) improved or deteriorated.
2. Data And Methodology
2.1. Data
In this study, the survey concentrated on the visitors in Rawapening. We choose respondents as well as household head for an interview. Respondents defined who use the lake for recreation, and they must pay the entrance ticket. The visitors were randomly chosen for the interviews that completed the questionnaire [2,4,5].
In total, 150 copies of the questionnaire were prepared and distributed by interviewers. Of the 135 questionnaires returned, 120 could be used for analysis. The amount of 5 invalid replies because the respondents were not the household head, 8 did not complete the questions, and 2 were considered inconsistent in answer the questionnaires.
The questionnaire consisted of four sections, covering (1) information objects of study and research purposes, (2) demographic characteristics of respondents; (3) respondents perception to Rawapening, and (4) respondents rating for tourism quality. For section fourth, questionnaire consisted of multiple choice questions and dichotomous yes or no question.
2.2. Random Utility Approach
Random utility method is a method of decomposing the overall utility into two components, namely, deterministic (observed utility) and random (utilities are not observed). Utilities were not observed in the form of attributes that are not observed, unobservable taste variation, error and imperfect information, and the instrumental variables [1,2,3,6]. The random utility model is used to overcome the disadvantages of Contingency Valuation Method (Contingent Valuation Method) which based on hypothetical behavior directly. In the contingency valuation method, willingness to pay (WTP) or willingness to accept (WTA) asked directly, so it is possible that more assessment (overvalued) or even less (undervalued). This can happen because the respondents could not correctly convert their judgment in monetary units. Therefore the WTP or WTA should be estimated, not observed. Random utility models is one way to measure the WTP and WTA indirectly [1,6].
The random utility method is assuming that site characteristics are an important determinant of recreational choice decisions [8]. The method models try to determine how a representative consumer chooses from a set of discrete sites each of which embodies a vector of attributes (qualities). Following McFadden, some of the researchers make a basic model of RUM. This model consists of a deterministic core and a random component [7,8,9,10]. If known, there is a group of individuals n: i = 1, ..., i, ..., n. For every opportunity to recreation, such individuals may choose an alternative m which is part of a group of alternative preference (called AP): j = 1, ..., j, ..., m. Each has income (Mi) vectors, and then each AP has an attribute of tourism quality (Qj). Individual travel costs are Cij. In this study, j and k represent alternative development (changing conditions) in Rawapening. For individual i who chooses APj, utilities can be formulated as follows:
= − , +∈ (1)
Where ji is the unobservable component of utility and assumed to be random. The price of goods or services market (other consumption) omitted to simplify notation. From equation (1), we can derive the model for estimation as follows:
Choices = ASC + β TC + NATENV + JAVACUL + TRDMRKT +∈ (2)
Equation (2) estimates with conditional logit. It is using the method of maximum likelihood (ML). The next procedure, we must test the model, and there are three procedure, (1) individual test, this test compares p value with alpha (α), and this test uses two way hypothesis, (2) overall test, this compares likelihood ratio statistics with chi squared, and (3) goodness of fit test, this test uses Pseudo R-Squared.
The 3rd International Conference on Mathematics, Science and Education 2016 IOP Publishing IOP Conf. Series: Journal of Physics: Conf. Series 824(2017) 012037 doi:10.1088/1742-6596/824/1/012037
Last, we must estimate the welfare. It estimates in the RUM method is expected measures that depend on how the choice set is defined and how the distribution of the random error in the model. Because the observation in RUM function is ordinal and not cardinal, we can calculate welfare changes based on linear attributes assumption. So, the deterministic utility change for the representative consumer using the linear attributes as follows [7,8]:
= − / − (3)
Then, the description of the variables used in equation (2) will be explained in Table 1.
Table 1. Description of Variables
Variable Description
CHOICE Dependent variable, represent conditional probability where 1 if respondent choose a choice, 0 if respondent do not choose a choice
ASC Alternative spesific constant, used to divide choice alternative. In this model, 1 represent change condition and 0 current condition
TC Travel Cost
NATENV Tourism quality for natural Environment
JAVACUL Tourism quality for Japanese cultural performance art TRDMRKT Tourism quality for traditional market
3. Results And Discussions
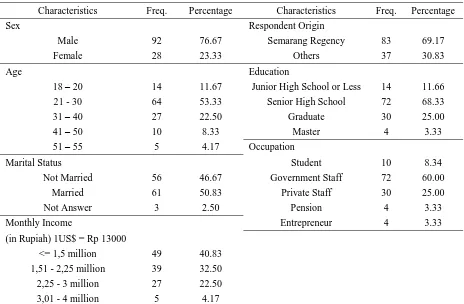
Table 2. Demographic Profile of Respondents in Rawapening
Characteristics Freq. Percentage Characteristics Freq. Percentage
Sex Respondent Origin
Monthly Income Entrepreneur 4 3.33
(in Rupiah) 1US$ = Rp 13000
<= 1,5 million 49 40.83
1,51 - 2,25 million 39 32.50
2,25 - 3 million 27 22.50
3,01 - 4 million 5 4.17
Based on table 2, the proportion of male respondents (76.67%) is higher than female respondents (23.33%). The marital status of respondents with married status represent 50.83%. It's greater than single status, represent 46.67% of respondents. Age groups were also relatively distributed, except for people age 41 – 50 or older. Majority respondents have attended senior high school, even though many respondents have attended colleges or university graduates. Respondents that have attended junior high school or less represent 11.66% of respondents, whereas 3.33% of the respondents had master degree. From another job, the majority of respondents work as government staff represent 60% of respondents. Based form respondent origin, majority respondents cames from Semarang regency with 69.17% and others only 30.83%. Persons with a monthly household income of 1.51 – 2.25 million
rupiah and 2.25 – 3 million rupiah accounted for 32.5% and 22.5%. While those, respondents with incomes less than 1.5 million rupiahs represented 40.83%. Only 4.17% of respondents had incomes over 3 million rupiahs.
Tabel 3 Estimation Results
Variable Coef. Std.Error Sign.
ASC 0.274 0.428
Based on Table 3, the attributes that affect the choice of respondents in Region Rawapening is travel cost, natural environment, Javanese cultural art performances and traditional markets. The four attributes significantly influence respondents' choice. ASC variable indicates the average individual utility when other variables unchanged. ASC value is positive for Rawapening Region, and it suggests the possibility of respondents would vote for a new scenario (scenario improved) higher than the scenario worse. Variable travel cost has a negative value. Travel expenses such as admission price, consumption while in tourist attractions, souvenirs, hand pieces, travel place transformation, and other costs (including toilets and parking). This variable can represent with a price. The sign of this variable indicates that it follows the demand functions. It can happen because visitors from different origins face different prices [5,7]. Then, natural environment variable is positive in Rawapening. This value indicates that respondents appear increasingly aware of the importance of natural environment when they are conducting activities traveled.Variable Javanese cultural art performance is positive in Rawapening. This value indicates the possibility of change scenarios selected respondents will increase along with the rise of Javanese cultural art performances held in Rawapening.
Then, traditional market variables are negative in Rawapening. This value indicates the possibility of change in the selected scenarios of respondents would decline with traditional market located in Rawapening. Based on these findings, the respondents did not pay much attention souvenir or handmade. Visitors choose a tourist attraction that has a beautiful natural environment, can interact with the local community, Javanese cultural art performance, and affordable with income respondents. In line with this opinion, the experience a visitors or recreationist is a must because they will have in particular activities at given sites [8].
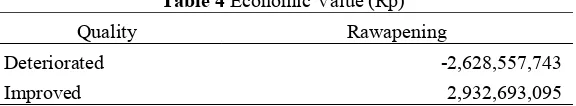
Table 4 Economic Value (Rp) Quality Rawapening
Deteriorated -2,628,557,743 Improved 2,932,693,095
Based on Table 4, the total economic value at Rawapening amounted to Rp 2.932 billion per year for improved scenario compared with worsened scenario amounted to Rp 2.628 billion per year. This calculation obtained by the attributes used in the study (the natural environment, Javanese cultural art performances, and traditional markets). Attributes are determined by comparing the change in the conditions of new scenarios to the status quo scenario. From this value, we can conclude that the sites operator and policy makers would like to keep measures of environmental quality, shopping facilities, The 3rd International Conference on Mathematics, Science and Education 2016 IOP Publishing IOP Conf. Series: Journal of Physics: Conf. Series 824(2017) 012037 doi:10.1088/1742-6596/824/1/012037
and cultural performance which visitors or recreationists perceive as important for their recreational enjoyment [9].
4. Conclusion
According to the analysis and findings, this study found that (1) all of the attributes affect the preferences of respondents in choosing the changing conditions in Rawapening. There are travel cost, natural environment, Javanese cultural performances, and traditional markets; (2) the economic per year due to changing scenario of the region improved Rawapening higher than the scenario worse. Value scenarios improved compensation Rp 2.93 billion per year, while the worsening scenario of Rp 2.62 billion per year. Recommendation from this study, (1) the government needs to formulate policies Rawapening tourism development areas better. Javanese cultural performances and traditional markets as the main visitor areas need to be updated as conditions change Rawapening more attention to the natural environment; (2) the development of cultural tourism and tourism trips can be applied to the development of Rawapening. Development of natural environment combined with an increased frequency of Javanese cultural performances earned positive response.
References
[1] A.A. Patunru, “Three Essays on Choice Based Estimations of The Economic Benefits of Contamined Site Cleanup”,Ph.D. Thesis, University of Illinois at Urbana-Champaign, 2004. [2] A.Fauzi, Economic Valuation and Assessment of Damage to Natural Resources and
Environment(IPB Press, Bogor, 2015), pp. 151 – 164.
[3] A. M. Freeman III, J. A. Herriges, and C. L. Kling, The Measurement of Environmental and Resources Values: Theory and Methods(Resources for the Future, Washington DC, 1993), pp. 386 – 410.
[4] A. R. Hakim, S. Subanti, and M. Tambunan, Journal of Sustainable Development 4 (2), pp. 91-101 (2011).
[5] J. Englin, and R. Mendelsohn, Journal of Enviromental Economics and Management 21, pp. 275 – 290 (1991).
[6] L.F. Martha, “Measuring Economic Value of Change of Tourism Environment in Tanjung Pinang : An Application of Random Utility Model”. National Seminar in Economics held by Universitas Indonesia, (2007).
[7] L.Pendleton, and R. Mendelsohn, Enviromental and Resource Economics 17, pp. 89 -108 (2000).
[8] P.W. Schuhmann, and K.A. Schwabe, Enviromental and Resource Economics 27, pp. 429 – 450 (2004).
[9] Y. Kaoru, Resource and Energy Economics 17, pp. 119 – 136 (1995).
[10] Y. Kaoru, V. Smith, and J.Liu, American Journal of Agricultural Economics 77, pp. 141 – 151 (1995).