ABSTRACT: Biodiesel (FA esters) has become very attractive as an alternative diesel fuel owing to its environmental benefits. Transesterification is the most usual and important method to make biodiesel from vegetable oils. This article investigates the potential for using Raman spectroscopy to monitor and quantify the transesterification of soybean oil to yield ethyl esters. The dif-ferences observed in the Raman spectra of soybean oil after trans-esterification were a peak at 2932 cm−1(ν
CH2), the displacement of the ν
C=Oband from 1748 to 1739 cm
−1, and the bands at 861 (ν
R-C=Oand νC-C) and 372 cm −1(δ
CO-O-C). Uni- and multivariate analysis methods were used to build several analytical curves and then applied in known samples, treated as unknowns, to test their ability to predict concentrations. The best results were achieved by Raman/PLS calibration models (where PLS = partial least squares regression) using an internal normalization standard (ν
=C-Hband). The correlation coefficient (R2) values so obtained were 0.9985 for calibration and 0.9977 for validation. Univariate re-gression analysis between biodiesel concentration and the in-creasing intensity of ν
CH2band or νC=Odisplacement showed R2 values of 0.9983 and 0.9742, respectively. Although spectro-scopic methods are less sensitive than chromatographic ones, the data obtained by spectroscopy can be correlated with other tech-niques, allowing biodiesel yield and quality to be quickly as-sessed.
Paper no. J11295 in JAOCS 83, 597–601 (July 2006).
KEY WORDS: Biodiesel, ethyl esters, multivariate analysis, par-tial least squares, quantification, Raman spectroscopy, soybean oil, transesterification.
Monoalkyl esters of long-chain FA (biodiesel) derived from re-newable resources, such as animal fats and vegetable oils, have become more and more attractive owing to their environmental benefits (1). Biodiesel is biodegradable, nontoxic, has low emission profiles, and is potentially an alternative fuel to be used either pure or blended with petroleum-derived diesel fuel (1,2).
Transesterification (also called alcoholysis) is the most widespread and important method to make biodiesel from veg-etable oils (1). It consists of the reaction between an animal fat or vegetable oil [e.g., soybean (3–5), peanut (5), rapeseed (1), palm (6), etc.] and an alcohol [e.g., methanol (5,6), ethanol
(3–5)] to form esters and glycerol. A base [e.g., NaOH (4,5), KOH (6)], an acid [e.g., H2SO4(5)], or an enzyme [e.g., lipase (7) is usually used to improve kinetics and yield (8).
Although the development and optimization of methods for the production of biodiesel have motivated a great number of publications (5,9), several studies have focused on the devel-opment of analytical methods for monitoring biodiesel produc-tion and quality (10). The analytical procedures reported in the literature include chromatographic methods [GC (11), HPLC (12), gel permeation chromatography (GPC) (10), and size ex-clusion chromatography (SEC) (3)], and spectroscopic meth-ods [1H NMR (4,13), NIR spectroscopy (2), and FTIR (3)]. Good agreement between NIR and 1H NMR spectroscopic methods (correlated by simple equations) was also reported (14).
Vibrational spectroscopic techniques are fast and can more easily be adapted to routine process analysis (10) than time-consuming and expensive methods, such as GC. They also allow nondestructive measurements of the samples (15). For example, Raman spectroscopy has been used in pharmaceuti-cal (16) and polymer industries (17), and its application in in-dustrial process control is growing quickly (18). Raman spec-tra present well-defined peaks, the intensity of which depends directly on the substance concentration (19). Since the devel-opment of NIR laser sources, many of the problems related to fluorescence in Raman spectroscopy have been overcome (20). Furthermore, the light-scattering nature of the Raman process allows the design of simple, inexpensive, efficient, and stable fiber-optic probes (18).
Uni- and multivariate analyses have been widely used to de-velop calibration models based on Raman spectroscopic data. Cooper and co-workers (21) determined octane numbers and Reid vapor pressures of commercial petroleum fuels using FT-Raman and partial least squares (PLS) regression. Yu and co-workers (22) reported a univariate linear fit between the C=O vi-brational band of the Raman spectrum and the degree of O-es-terification in isolated acetylated soy protein. Ampiah-Bonney and Walmsley (23) used Raman spectroscopy to monitor the acid-catalyzed esterification of ethanol by acetic acid and princi-pal component analysis (PCA) to extract the pure Raman signal. Multivariate analyses were applied in spectroscopy to over-come limitations of univariate calibrations. Their advantages rely on the possibility of analyzing spectral features (e.g., over-lapping bands, broad peaks, etc.) over wide ranges (24). A clear
*To whom correspondence should be addressed at Instituto de Química, Uni-versidade de Brasília, caixa postal 4478, Brasília-DF, 70904-970, Brazil. E-mail address: [email protected] or [email protected].
Application of Raman Spectroscopy to Monitor and
Quantify Ethyl Esters in Soybean Oil Transesterification
Grace F. Ghesti, Julio L. de Macedo*, Valdeilson S. Braga, Antonio T.C.P. de Souza, Vicente C.I. Parente, Esdras S. Figuerêdo,
Inês S. Resck, José A. Dias, and Sílvia C.L. Dias*
and detailed description of multivariate methods can be found in several reviews in the literature (24–27).
The goal of this research is to use and establish FT-Raman spectroscopy as a reliable method to quantify the concentration of ethyl ester in known mixtures of soybean oil and to show the differences between their respective spectra. As no reports, to the best of our knowledge, exist in the literature for monitoring the transesterification reaction of vegetable oil with alcohols using Raman spectroscopy, this technique may be of use to monitor biodiesel synthesis.
EXPERIMENTAL PROCEDURES
Commercial refined soybean oil (Bunge, Sao Pãulo, Brazil), NaOH (99%; Vetec, Rio de Janeiro, Brazil), and hexachloro-1,3-butadiene (HCBD) (97%; Aldrich, Milwaukee, WI) were used as received. Ethanol (Vetec, 99.8%), and methanol (Vetec, 99.8%) were further purified with molecular sieves 3A (Aldrich) for at least 24 h before the experiment.
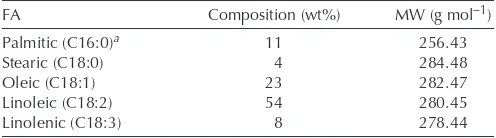
Ethyl and methyl esters were prepared by transesterification according to conditions suggested in the literature (5) for base-catalyzed reactions. The reaction was performed in a 50-mL glass round-bottomed flask containing 20.00 g of soybean oil, 6.34 g of anhydrous ethanol or 4.41 g of anhydrous methanol (1:6 oil to alcohol mole ratio), and 0.20 g of NaOH (1% w/w of oil). The system was stirred under reflux at 80°C for 90 min. Then, the product was cooled to room temperature, washed with distilled water, dried over magnesium sulfate, and kept overnight in an oven at 80°C to remove residual alcohol. The M.W. of biodiesel (306.09 g mol−1) and soybean oil (812.17 g mol−1) were calculated using the composition of FA obtained from the literature (27) (Table 1).
Ethyl and methyl ester quality parameters were verified by NMR (1H and 13C measurements at 7.05 T with a Varian Mer-cury Plus NMR spectrometer using CDCl3as solvent) and GC (GC-17A Shimadzu chromatograph with FID and polydi-methylsiloxane column, CBPI PONA-M50-042). Since no sig-nificant contaminants were observed, the products were treated as 100% ethyl and methyl esters, respectively.
FT-Raman spectra were recorded on a Bruker FRA 106/S module attached to a Bruker Equinox 55 spectrometer using a 1-cm quartz cuvette with a mirror surface toward the scattering direction (128 scans and 4 cm−1resolution). The laser excita-tion (Nd:YAG = neodymium:yttrium aluminum garnet) and laser power were 1064 nm and 250 mW, respectively, and the signal was detected by a liquid N2-cooled Ge detector.
Samples were prepared by weighing several soybean oil/ethyl ester mixtures. Twenty-one samples were prepared, ranging from 0% ethyl ester (pure soybean oil) to 100% (m/m). The mixtures were stirred for 3 min before the spectra were col-lected. All spectra were recorded at room temperature in tripli-cate (63 measurements). The integrated band of HCBD at 1611 cm−1was used as external standard. Several correlations and regression methods were tested to construct the analytical curves. For multivariate analysis, PCA (Grams PLSplus IQTM software; Thermo Electron, Sao Paulo, Brazil) and PLS-1 (OPUS-NT Quant software, from Bruker) methods were used. The entire data set (21 samples) was analyzed by PLS-1 using leave-one-out cross-validation, where a cyclic system from only one set of samples allows the entire set to be used to build the analytical curve and to validate the model. Five indepen-dent samples—0, 20, 50, 80, and 100% by weight of ethyl es-ters—were prepared outside the data set and treated as un-known to test the prediction capabilities of the models. The 0 and 100% samples were acquired from a fresh commercially refined soybean oil (Bunge) and a second transesterification re-action, respectively.
RESULTS AND DISCUSSION
The FTIR spectra of soybean oil and the respective ethyl ester are very similar, with the exception of small differences as re-ported by Zagonel and co-workers (3). On the other hand, the Raman spectra of soybean oil and the corresponding ethyl ester present several differences. Figure 1 depicts these main signals in the Raman spectra: (i) the peak at 2932 cm−1corresponds to ν
CH2formation, whereas in the soybean oil spectrum this peak
appears only as a shoulder; (ii) the ν
C=Oband is displaced from
1748 to 1739 cm−1after transesterification; and (iii) the bands at 861 (ν
R-C=OandνC-C) and 372 cm
−1 (δ
CO-O-C) are due to
ester formation. Because of these variations, it was possible to correlate the Raman spectra with biodiesel yield (19).
In transesterification, the double bond content (=C–H, C=O, and C=C) remains constant through the entire reaction and therefore can be used as an internal normalization standard, since none of the others reagents and products involved in the reaction (alcohol and glycerol) contain double bonds. This fea-ture is advantageous for in situmeasurements, because there is no need for additional internal or external standards. However, it is known that the use of external standards is extremely use-ful to correct Raman variations (e.g., signal intensity, laser power, sample positions, etc.) (28). In addition, since the C=O band also will be used in the analysis of the reaction end point and it is a weaker band compared with the IR spectrum (19), the =C–H (3012 cm−1) or C=C bands (1657 cm−1) will be used as internal normalization standards for regression analysis. Care should be taken if a different feedstock is used. Since the unsaturation degree is characteristic to each type of vegetable oil, a new calibration curve must be implemented based on that feedstock.
For the analytical curve study using univariate analysis, the concentration of ethyl esters was correlated with the integrated
TABLE 1
FA Composition of Soybean Oil (27)
FA Composition (wt%) MW (g mol−1)
Palmitic (C16:0)a 11 256.43 Stearic (C18:0) 4 284.48 Oleic (C18:1) 23 282.47 Linoleic (C18:2) 54 280.45 Linolenic (C18:3) 8 278.44
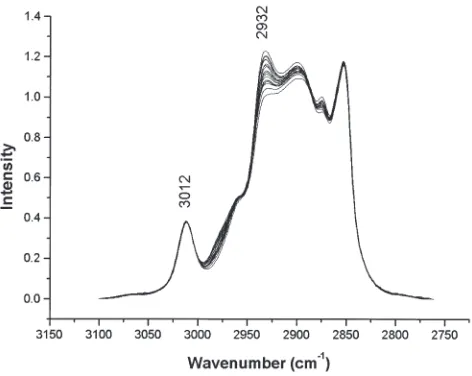
area of the band at 2932 cm−1, related to the CH2group. Be-fore analysis, all data were normalized by the area of the =C–H band at 3012 cm−1(Fig. 2). The R2value so obtained was 0.9983, showing a good correlation between the values of the weighted samples and the Raman spectra. Figure 3 shows the linear correlation curve between integration results and biodiesel conversion. When the resulting slope was applied to predict concentrations of known samples treated as unknown, it showed a correlation between true and predicted values of 0.9845. The use of an external standard did not improve the re-sults (0.9672).
For multivariate analysis, several models were built by vary-ing spectral range and preprocessvary-ing methods (normalization, second derivative, multiple scattering correction, etc.). The full
Raman spectral range of the samples was analyzed by PCA to evaluate how many factors were necessary to describe the vari-ances observed. The results showed that two principal compo-nents accounted for 99.995% of the total spectral variance. Based on this result, all models tested in Table 2 were analyzed by fixing the two predominant factors. By reducing the spec-tral range to the CH stretching region and applying PCA, two principal components accounted for 100% of the spectral vari-ance.
All tested models achieved good validation results, with R2
values ranging from 0.9846 to 0.9985. Table 2 shows the best results obtained for the Raman/PLS models. For model 1, the full spectral range (3500–152.4 cm−1) with all 63 measure-ments (i.e., the triplicates of each spectrum) was used to esti-mate the concentrations. An excellent correlation was obtained by cross-validation (R2= 0.9953 for validation and 0.9967 for calibration). Model 2 shows that when the average spectra were used, an improvement of R2(0.9973 for validation and 0.9987 for calibration) and root mean square error (RMSE) values (from 2.05 in model 1 to 1.56 in model 2) was obtained. How-ever, when applied to the unknown samples, both methods showed identical results, 0.9987 and 0.9987 for correlation be-tween true and predicted values for models 1 and 2, respec-tively. Even when the spectral range was minimized to the re-gions with bands only (see model 3 in Table 2), which im-proved the model and reduced the RMSE, there was only a small enhancement in the results. Model 4 uses the CH stretch-ing region (3100–2740 cm−1) normalized with the =C–H band. These conditions, although there was no significant improve-ment in R2and RMSE values, gave the best results with the un-known samples, with correlations of 0.9994 and 0.9993 for models 4 and 5, respectively. Table 3 reports the results found for Raman/PLS models 4 and 5 when used to estimate values of known samples treated as unknown. All the predicted val-ues showed good correlations with the true ones. Figure 4
FIG. 1.FT-Raman spectra of pure soybean oil (a) and ethyl esters (b) ev-idencing their respective spectral differences, i.e., a peak at 2932 cm−1,
the displacement of the C=O band from 1748 to 1739 cm−1, and the
bands at 861 and 372 cm−1.
FIG. 2.FT-Raman spectra of several soybean oil/biodiesel mixtures nor-malized by the =C–H band at 3012 cm−1.
FIG. 3.Analytical curve for the univariate analysis using the 21 samples (average based on triplicate determinations). Y=−142.45 + 58.73X,R2
shows the cross-validation curves obtained by models 4 and 5. For in situ measurements, the alcohol excess can distort the analysis in the C-H vibration spectral region. For this purpose, other spectral regions of analysis are suggested from this work. The displacement of the C=O band does not require standard-ization and can be used in Raman and IR spectroscopy (3). A linear regression between biodiesel concentration and the C=O displacement showed a good correlation (R2= 0.9742). Other bands that can be used for analysis are those, due to the forma-tion of the ester, at 861 and 372 cm−1. These weak bands are strong evidences of biodiesel synthesis. Most of the reaction analysis in this work was focused on the C–H vibration region, where a clear difference between soybean oil and ethyl esters was found. Good correlations were established by both uni- and multivariate analysis. However, the best results were obtained by PLS regression, showing that Raman and multivariate analysis are an attractive alternative to chromatographic meth-ods. The Raman spectra of soybean oil and the respective methyl ester present fewer differences than the above-men-tioned for ethyl esters, but with a robust model this work could be extended to FAME analysis. Beattie and co-workers (29) discussed the Raman spectra of FAME, but no reports were found describing the spectra of the ethyl esters.
ACKNOWLEDGMENTS
The authors are grateful to Conselho Nacional de Desenvolvimento Científico e Tecnológico (CNPq) for a scholarship to pursue a
Doc-TABLE 2
Optimization Results for PLS Regression Analysis of Raman Spectra Using the Two Factors Determined by PCA
Spectral Validation results Calibration results
#a Data set range (cm−1) R2 RMSE R2 RMSE Pre processing
1 63 3500–152.4 0.9953 2.05 0.9967 1.76 External standardc 2 21b 3500–152.4 0.9973 1.56 0.9987 1.18 External standardc 3 21b 3098.4–2649.0 0.9977 1.44 0.9985 1.23 External standardc
1798.4–795.5 398.2–344.2
4 21b 3052.1–2764.7 0.9977 1.43 0.9985 1.27 Internal standardd 5 63 3052.1–2764.7 0.9963 1.83 0.9967 1.75 Internal standardd
a
Best tested models.
b
Twenty-one samples averaged from 63 measurements.
c
Integrated band of hexachloro-1,3-butadiene at 1611 cm−1.
d
Integrated band of =C–H at 3012 cm−1. PLS, partial least squares; PCA, principal component analysis; RMSE, root
mean square error.
TABLE 3
Predicted Values by the Raman/PLS Models 4 and 5 for Samples of Known Composition Treated as Unknown That Were Prepared Separately to Test the Models
True values Model 4 predicted values Model 5 predicted values (wt%) (wt%) (wt%)
0.00 0.52 0.12
20.01 21.88 21.18
49.82 50.28 49.86
79.69 80.64 80.64
100.00 98.34 97.92
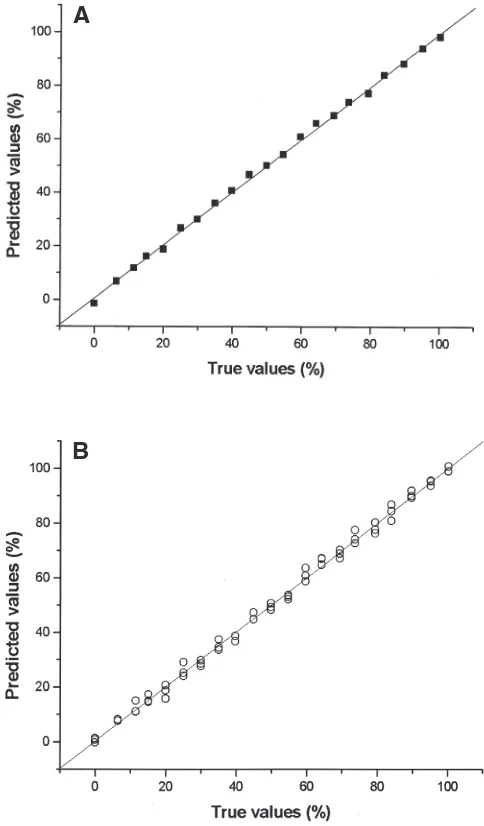
FIG. 4.Validation curves for different Raman/PLS models. Model 4 (A), 21 samples, R2= 0.9977 and RMSE = 1.43. Model 5 (B), 63 samples,
R2= 0.9963 and RMSE = 1.83. PLS, partial least squares; RMSE, root mean square error.
A
torate (J.L.M. and V.S.B.) and a Master’s degree (G.F.G), and finan-cial support given by Universidade de Brasília–Instituto de Química (Fundo de Pesquisa: FUNPE), Fundação de Empreendimentos Cien-tíficos e Tecnológicos (FINATEC), CNPq, Fundação de Apoio a Pesquisa do DF (FAPDF)/Secretaria Para Desenvolvimento da Ciên-cia e Tecnologia do DF (SCDT)/CNPq, FinanCiên-ciadora de Estudos e Projetos (FINEP/CT-Petro), and FINEP/CT-Infra for the develop-ment of this research.
REFERENCES
1. Ma, F., and M.A. Hanna, Biodiesel Production: A Review, Bioresour. Technol. 70:1–15 (1999).
2. Knothe, G., Rapid Monitoring of Transesterification and Assess-ing Biodiesel Fuel Quality by Near-Infrared Spectroscopy UsAssess-ing a Fiber-Optic Probe, J. Am. Oil Chem. Soc. 76:795–800 (1999). 3. Zagonel, G.F., P. Peralta-Zamora, and L.P. Ramos, Multivariate Monitoring of Soybean Oil Ethanolysis by FTIR, Talanta 63:1021–1025 (2004).
4, Neto, P.R.C., M.S.B. Caro, L.M. Mazzuco, and M.G. Nasci-mento, Quantification of Soybean Oil Ethanolysis with 1H NMR, J. Am. Oil Chem. Soc. 81:1111–1114 (2004).
5. Freedman, B., E.H. Pryde, and T.L. Mounts, Variables Affect-ing the Yields of Fatty Esters from Transesterified Vegetable Oils, Ibid. 61:1638–1643 (1984).
6. Darnoko, D., and M. Cheryan, Kinetics of Palm Oil Transesteri-fication in a Batch Reactor, Ibid. 77:1263–1267 (2000). 7. Jackson, M.A., and J.W. King, Methanolysis of Seed Oil in
Flowing Supercritical Carbon Dioxide, Ibid. 73:353–356 (1996).
8. Schuchardt, U., R. Sercheli, and R.M. Vargas, Transesterifica-tion of Vegetable Oils: A Review, J. Braz. Chem. Soc. 9:199–210 (1998).
9. Warabi, Y., D. Kusdiana, and S. Saka, Reactivity of Triglyc-erides and Fatty Acids of Rapeseed Oil in Supercritical Alco-hols, Bioresour. Technol. 91:283–287 (2004).
10. Knothe, G., Analytical Methods Used in the Production and Fuel Quality Assessment of Biodiesel, Trans. ASAE 44:193–200 (2001).
11. Plank, C., and E. Lorbeer, Simultaneous Determination of Glyc-erol, Mono-, Di-, and Triglycerides in Vegetable Oil Methyl Es-ters by Capillary Gas Chromatography, J. Chromatogr. A 697:461–468 (1995).
12. Holˇcapek, M., P. Jandera, J. Fischer, and B. Prokeˇs, Analytical Monitoring of the Production of Biodiesel by High-Performance Liquid Chromatography with Various Detection Methods, Ibid. 858:13–31 (1999).
13. Geldard, G., O. Brés, R.M. Vargas, F. Vielfaure, and U.F. Schuchardt, 1H Nuclear Magnetic Resonance Determination of the Yield of the Transesterification of Rapeseed Oil with Methanol, J. Am. Oil Chem. Soc. 72:1239–1241 (1995).
14. Knothe, G., Monitoring a Progressing Transesterification Reac-tion by Fiber-Optic Near-Infrared Spectroscopy with Correla-tion to 1H Nuclear Magnetic Resonance Spectroscopy, Ibid. 77:489–493 (2000).
15. Drago, R.S., Physical Methods for Chemists, Saunders College Publishing, New York, 1992, pp. 162–192.
16. Vankeirsbilck, T., A. Vercauteren, W. Baeyens, and G. Van der Weken, Applications of Raman Spectroscopy in Pharmaceutical Analysis, TrAC, Trends Anal. Chem. 21:869–877 (2002). 17. Chalmers, J.M., and N.J. Everall, FTIR, FT-Raman and
Chemo-metrics: Applications to the Analysis and Characterisation of Polymers, Ibid.15:18–25 (1996).
18. Cooper, J.B., K.L. Wise, and B.J. Jensen, Modulated FT-Raman Fiber-Optic Spectroscopy: A Technique for Remotely Monitor-ing High-Temperature Reactions in Real-Time, Anal. Chem. 69:1973–1978 (1997).
19. Bara´nska, H., A.
´
Labudzi´nska, and J. Terpi´nski, Laser Raman Spectroscopy: Analytical Applications, Ellis Horwood, Chich-ester, 1987, pp. 151–168.20. Skoog, D.A., F.J. Holler, and T.A. Nieman, Principles of Instru-mental Analysis, Saunders College Publishing, Philadelphia, 1997, pp. 429–443.
21. Cooper, J.B., K.L. Wise, J. Groves, and W.T. Welch, Determi-nation of Octane Numbers and Reid Vapor Pressure of Commer-cial Petroleum Fuels Using FT-Raman Spectroscopy and Partial Least-Squares Regression Analysis, Anal. Chem. 67:4096–4100 (1995).
22. Yu, Z., C.Y. Ma, S.N. Yuen, and D.L. Phillips, Raman Spectro-scopic Determination of Extent of O-Esterification in Acetylated Soy Protein Isolates, Food Chem. 87:477–481 (2004).
23. Ampiah–Bonney, R.J., and A.D. Walmsley, Monitoring of the Acid Catalysed Esterification of Ethanol by Acetic Acid Using Raman Spectroscopy, Analyst 124:1817–1821 (1999).
24. Thomas, E.V., A Primer on Multivariate Calibration, Anal. Chem. 66:795A–804A (1994).
25. Geladi, P., Chemometrics in Spectroscopy, Spectrochim. Acta Part B 58:767–782 (2003).
26. Hopke, P.K, The Evolution of Chemometrics, Anal. Chim. Acta 500:365–377 (2003).
27. Gunstone, F.D., Fatty Acid and Lipid Chemistry, Blackie Acad-emic & Professional, Chapman & Hall, London, 1996, p. 61. 28. Mendes, L.S., F.C.C. Oliveira, P.A.Z. Suarez, and J.C. Rubim,
Determination of Ethanol in Fuel Ethanol and Beverages by Fourier Transform (FT)-Near Infrared and FT-Raman Spec-trometries, Anal. Chim. Acta 493:219–231 (2003).
29. Beattie, J.R., S.E.J. Bell, and A.W.A. Moss, Critical Evaluation of Raman Spectroscopy for the Analysis of Lipids: Fatty Acid Methyl Esters, Lipids 39:407–419 (2004).