Katalog BPS: 2101018
Proyeksi Penduduk Indonesia
Indonesia Population Projection
2010-2035
ISBN: 978-979-064-606-3
No. Publikasi/
Publication Number
: 04110.1301
Katalog BPS/
BPS Catalogue
: 2101018
Ukuran Buku/
Book Size
: 17,6 cm x 25 cm
Jumlah Halaman/
Total Pages
: 468 halaman/
pages
Naskah/
Manuscript
:
Subdirektorat Demografi
Subdirectorate of Statistical Demographic
Gambar Kulit/
Cover Design
:
Subdirektorat Publikasi dan Kompilasi Statistik
Subdirectorate of Statistical Compilation and Publication
Diterbitkan oleh
/Published by
:
Badan Pusat Statistik, Jakarta-Indonesia
BPS - Statistics Indonesia
Dicetak oleh/
Printed by
:
-Boleh dikutip dengan menyebut sumbernya
May be cited with preferences to the source
FOREWORD
The National Long-term Development
Plan (locally known as RPJPN) 2005-2025
is the elaboration of the goals of the
Indonesian goverment, as stated in the
preamble of Constitution 1945 (UUD
1945), setting out the vision, mission and
the direction of national development over
the next 20 years. The RPJPN document
should be complemented by information of
current and future population size, which
is necessary for development planning.
Hence, it is essential to provide population
data and information to support development
planning, both at national and provincial
level.
In addition, it is also important to obtain
the projection of population parameter, such
as population age structure, total fertility
rate, as well as life expectancy. Therefore,
planning activities require the preparation
of population projection.
This projection is a result of
collaboration between Bappenas, BPS,
UNFPA and Demography experts. In this
regard, the technical aspect of calculating
the population projection is the responsibility
KATA PENGANTAR
Rencana Pembangunan Jangka
Panjang Nasional (RPJPN) 2005-2025
merupakan penjabaran dari tujuan
dibentuknya pemerintahan Negara Republik
Indonesia yang tercantum dalam pembukaan
Undang-undang Dasar Negara Republik
Indonesia Tahun 1945 (UUD 1945), dalam
bentuk visi, misi, dan arah pembangunan
nasional, yang mencakup kurun waktu 20
tahun. Dokumen RPJPN harus dilengkapi
dengan informasi tentang jumlah penduduk
saat ini dan yang akan datang yang sangat
diperlukan dalam penyusunan perencanaan
pembangunan. Dalam memenuhi tujuan
tersebut diperlukan informasi kependudukan
yang dapat menunjang perencanaan
pembangunan di masa yang akan datang,
baik tingkat nasional maupun tingkat provinsi.
Di samping jumlah penduduk, juga perlu
diketahui proyeksi parameter kependudukan,
seperti struktur umur penduduk, angka
kelahiran total, serta angka harapan hidup
penduduk. Oleh karena itu, sebagai bahan
perencanaan pembangunan tersebut perlu
dilakukan penyusunan proyeksi penduduk.
Penyusunan ini dilakukan atas kerja
sama antara Bappenas, BPS, UNFPA
serta para pakar demografi. Dalam hal
ini penghitungan secara teknis menjadi
tanggung jawab BPS.
Akhir kata, kami ucapkan terima kasih
kepada semua pihak yang telah membantu
dalam penyusunan proyeksi ini, mulai dari
penyiapan data sampai dengan penulisan
naskah. Semoga publikasi ini bermanfaat
dan dapat memenuhi kebutuhan semua
pihak, baik pemerintah pusat dan daerah,
dunia usaha, perguruan tinggi, lembaga
swadaya masyarakat, maupun masyarakat
luas. Kritik dan saran sangat diharapkan
untuk penyempurnaan penyusunan
proyeksi penduduk di masa yang akan
datang.
Finally, we would like to express our
sincere gratitude to all those who assisted
us in compiling this population projection,
from preparing the data to completing the
report. We hope this report will be beneficial
to all stakeholders, including central and
local governments, businesses, universities,
NGOs, as well as civil societies. Feedback and
suggestions are highly appreciated in order to
improve future reports.
Jakarta, Oktober 2013
Armida S. Alisjahbana
Menteri Negara
PerencanaanPembangunan
Nasional/
Kepala Bappenas
Suryamin
Kepala BPS
Jose Ferraris
Representative
UNFPA
UCAPAN TERIMA KASIH
Penghargaan dan ucapan terima
kasih kami sampaikan kepada Dra. Nina
Sardjunani, MA, Drs. Wynandin Imawan,
M.Sc, Dr. Wendy Hartanto, MA, dr. Slamet
Riyadi Yuwono, MPH, Dr. Richard Makalew,
Drs. Razali Ritonga, MA, Ir. Thoman Pardosi,
SE, M.Si, dan Dr. Indra Murty Surbakti,
MA yang telah memberi saran dan koreksi,
serta memfasilitasi dan mengelola rangkaian
kegiatan penyusunan buku ini.
Penghargaan dan ucapan terima kasih
juga kami sampaikan kepada para penyusun
buku, yang dengan tekun dan tak kenal
lelah telah memformulasikan metodologi
dan asumsi dasar, serta perhitungan
proyeksi penduduk Indonesia 2010-2035,
yaitu Direktorat Statistik Kependudukan dan
Ketenagakerjaan–Badan Pusat Statistik:
Dendi Handiyatmo, S.ST, M.Si, Poetrijanti,
S.Si, Hermawan Agustina, S.Kom, Elfrida
Zoraya, S.Si, Yogo Aryo Jatmiko, S.ST,
Dwi Trisnani, S.ST, Nuraini, S.ST, Trophy
Endah Rahayu, M.Si, Parwoto, M.Stat,
Sri Wahyuni, M.Si, Subekti, M.Sc, Ari
Purbowati, S.Si, Apriliani Nurida D.A, S.Si,
Zairina, dan Ardiyanti Hermin. Direktorat
Kependudukan, Pemberdayaan Perempuan,
dan Perlindungan Anak–Badan Perencanaan
Pembangunan Nasional: Dr. Sanjoyo, M.Ec,
ACKNOWLEDGEMENT
We would like to express our sincere
appreciation and gratitude to Dra. Nina
Sardjunani, MA, Drs. Wynandin Imawan,
M.Sc, Dr. Wendy Hartanto, MA, dr. Slamet
Riyadi Yuwono, MPH, Dr. Richard Makalew,
Drs. Razali Ritonga, MA, Ir. Thoman Pardosi,
SE, M.Si, and Dr. Indra Murty Surbakti, MA
for their advice and feedback, as well as for
facilitating and managing all the efforts in
compiling this publication.
Special thanks and appreciation are
also expressed to those who were involved in
compiling the publication, who tirelessly and
meticulously formulated the methodology,
base assumptions and calculations of the
population projection for 2010-2035. We
thank in particular: Dendi Handiyatmo, S.ST,
M.Si, Poetrijanti, S.Si, Hermawan Agustina,
S.Kom, Elfrida Zoraya, S.Si, Yogo Aryo
Jatmiko, S.ST, Dwi Trisnani, S.ST, Nuraini,
S.ST, Trophy Endah Rahayu, M.Si, Parwoto,
M.Stat, Sri Wahyuni, M.Si, Subekti, M.Sc,
Ari Purbowati, S.Si, Apriliani Nurida D.A,
S.Si, Zairina, and Ardiyanti Hermin from the
Population and Manpower Directorate;
Dr. Sanjoyo, M.Ec and Ir. Ani Pudyastuti, MA
from the Directorate of Population, Women’s
Empowerment and Child Protection at the
National Development Planning Agency:
Ir. Ani Pudyastuti, MA, Badan Kependudukan
dan Keluarga Berencana Nasional: Drs. Satrijo
Pramono Hindarto, M.Sc, Dr. Ukik Kusuma
Kurniawan, SKM, MA, Kementerian
Kesehatan: Dr. Atmarita, MPH, UNFPA:
Ewang Yuono, SE.
Di samping itu, penghargaan dan
terima kasih kami sampaikan kepada Badan
Kependudukan dan Keluarga Berencana
Nasional, Kementerian Kesehatan,
Kementerian Dalam Negeri, Lembaga Ilmu
Pengetahuan Indonesia, dan Lembaga
Demografi–Universitas Indonesia; yang telah
memberikan masukan-masukan yang tak
ternilai. Juga kepada para narasumber:
Prof. Dr. Sri Moertiningsih Adioetomo,
Prof. Budi Oetomo, Dr. Soeharsono
Soemantri, Dr. Omas Bulan Rajagukguk,
dan Prof. Aris Ananta.
Akhirnya, tidak lupa kami ucapkan
terima kasih kepada pihak-pihak lain yang
telah membantu kelancaran penyusunan
buku ini. Kritik membangun sangat kami
harapkan demi kesempurnaan publikasi ini.
Dr. Satrijo Pramono Hindarto, M.Sc and
Dr. Ukik Kusuma Kurniawan, SKM, MA
from the National Population and Family
Planning Board; Dr. Atmarita, MPH from the
Ministry of Health; and Ewang Yuono, SE
from UNFPA.
In addition, we would like to express
our appreciation and gratitude to the National
Population and Family Planning Board, the
Ministry of Health, the Ministry of Home
Affairs, the National Institute of Sciences, and
the Demographic Institute at the University
of Indonesia for providing valuable input. We
also thank our panel of experts; Prof. Dr. Sri
Moertiningsih Adioetomo, Prof. Budi Oetomo,
Dr. Soeharsono Sumantri, Dr. Omas Bulan
Rajagukguk, and Prof. Aris Ananta.
Finally, we would like to thank
everyone who assisted us in preparing
this publication. Critiques are greatly
appreciated in enhancing this publication.
DAFTAR ISI
TABLE OF CONTENTS
Halaman
Page
KATA PENGANTAR
INTRODUCTION
i
UCAPAN TERIMA KASIH
ACKNOWLEDGEMENTS
iii
DAFTAR ISI
TABLE OF CONTENTS
v
DAFTAR TABEL
LIST OF TABLES
ix
DAFTAR GAMBAR
LIST OF FIGURES
xi
BAB I.
PENDAHULUAN
CHAPTER I.
FOREWORD
1
1.1. Latar Belakang
1
1.2. Isi Publikasi
Content of Publication
3
BAB II.
METODOLOGI, ASUMSI, DAN PROYEKSI KILAS BALIK
CHAPTER II.
METHODOLOGY, ASSUMPTION, AND BACKCASTING
PROJECTION
5
2.1.
Metode
Proyeksi
Projection Method
5
2.2.
Sumber
Data
Source of Data
6
2.3. Evaluasi Data Dasar
Evaluation of Basic Data
7
2.3.1. Evaluasi Data Umur dan Jenis Kelamin
Evaluation of Age and Sex Data
7
2.3.2. Perapihan Umur
Age Adjustment
11
2.4.
Penentuan
Asumsi
Determination of Assumptions
13
2.4.1. Asumsi Fertilitas
Fertility Assumption
14
2.4.2. Asumsi Mortalitas
Background
2.4.3.
Asumsi
Migrasi
Migration Assumption
16
2.4.3.1. Migrasi Internasional
International Migration
17
2.4.3.2. Migrasi Antar Provinsi
Inter-Provincial Migration
21
2.5.
Urbanisasi
Urbanization
26
2.6. Proyeksi Kilas Balik (Backcasting)
Backcasting Projection
29
BAB III. HASIL PERHITUNGAN
CHAPTER III. CALCULATION RESULT
31
3.1. Jumlah dan Laju Pertumbuhan Penduduk
Population Size and Growth Rate
31
3.2. Susunan Umur Penduduk
Age Composition of the Population
35
3.3. Net Reproduction Rate (NRR)
Net Reproduction Rate (NRR)
42
3.4. Umur Harapan Hidup
Life Expectancy
42
3.5. Urbanisasi
Urbanization
46
3.6. Proyeksi Kilas Balik (Backcasting)
Backcasting
50
BAB IV. PENUTUP
CHAPTER IV. CONCLUSION
51
DAFTAR PUSTAKA
Halaman
Page
LAMPIRAN /
APPENDIX
1.
INDONESIA
INDONESIA
57
LAMPIRAN /
APPENDIX
2.
PROVINSI
PROVINCE
71
LAMPIRAN /
APPENDIX
2.1.
PROVINSI ACEH
PROVINCE
OF
ACEH
73
LAMPIRAN /
APPENDIX
2.2.
PROVINSI SUMATERA UTARA
PROVINCE
OF NORTH SUMATERA
85
LAMPIRAN /
APPENDIX
2.3.
PROVINSI SUMATERA BARAT
PROVINCE
OF
WEST
SUMATERA
97
LAMPIRAN /
APPENDIX
2.4.
PROVINSI RIAU
PROVINCE
OF
RIAU
109
LAMPIRAN /
APPENDIX
2.5.
PROVINSI JAMBI
PROVINCE
OF
JAMBI
121
LAMPIRAN /
APPENDIX
2.6.
PROVINSI SUMATERA SELATAN
PROVINCE OF SOUTH SUMATERA
133
LAMPIRAN /
APPENDIX
2.7.
PROVINSI BENGKULU
PROVINCE
OF
BENGKULU
145
LAMPIRAN /
APPENDIX
2.8.
PROVINSI LAMPUNG
PROVINCE
OF
LAMPUNG
157
LAMPIRAN /
APPENDIX
2.9.
PROVINSI KEP. BANGKA BELITUNG
PROVINCE
OF
BANGKA
BELITUNG
ISLANDS
169
LAMPIRAN /
APPENDIX
2.10.
PROVINSI KEP. RIAU
PROVINCE
OF
RIAU
ISLANDS
181
LAMPIRAN /
APPENDIX
2.11.
PROVINSI DKI JAKARTA
PROVINCE
OF
DKI
JAKARTA
193
LAMPIRAN /
APPENDIX
2.12.
PROVINSI JAWA BARAT
PROVINCE
OF
WEST
JAVA
205
LAMPIRAN /
APPENDIX
2.13.
PROVINSI JAWA TENGAH
PROVINCE
OF
CENTRAL
JAVA
217
LAMPIRAN /
APPENDIX
2.14.
PROVINSI DI YOGYAKARTA
LAMPIRAN /
APPENDIX
2.16.
PROVINSI BANTEN
PROVINCE
OF
BANTEN
253
LAMPIRAN /
APPENDIX
2.17.
PROVINSI BALI
PROVINCE
OF
BALI
265
LAMPIRAN /
APPENDIX
2.18.
PROVINSI NUSA TENGGARA BARAT
PROVINCE OF WEST NUSA TENGGARA
277
LAMPIRAN /
APPENDIX
2.19.
PROVINSI NUSA TENGGARA TIMUR
PROVINCE
OF
EAST
NUSA
TENGGARA
289
LAMPIRAN /
APPENDIX
2.20.
PROVINSI KALIMANTAN BARAT
PROVINCE
OF
WEST
KALIMANTAN
301
LAMPIRAN /
APPENDIX
2.21.
PROVINSI KALIMANTAN TENGAH
PROVINCE
OF
CENTRAL
KALIMANTAN
313
LAMPIRAN /
APPENDIX
2.22.
PROVINSI KALIMANTAN SELATAN
PROVINCE
OF
SOUTH
KALIMANTAN
325
LAMPIRAN /
APPENDIX
2.23.
PROVINSI KALIMANTAN TIMUR
PROVINCE
OF
EAST
KALIMANTAN
337
LAMPIRAN /
APPENDIX
2.24.
PROVINSI SULAWESI UTARA
PROVINCE
OF
NORTH
SULAWESI
349
LAMPIRAN /
APPENDIX
2.25.
PROVINSI SULAWESI TENGAH
PROVINCE
OF
CENTRAL
SULAWESI
361
LAMPIRAN /
APPENDIX
2.26.
PROVINSI SULAWESI SELATAN
PROVINCE
OF
SOUTH
SULAWESI
373
LAMPIRAN /
APPENDIX
2.27.
PROVINSI SULAWESI TENGGARA
PROVINCE
OF
SOUTH
EAST
SULAWESI
385
LAMPIRAN /
APPENDIX
2.28.
PROVINSI GORONTALO
PROVINCE
OF
GORONTALO
397
LAMPIRAN /
APPENDIX
2.29.
PROVINSI SULAWESI BARAT
PROVINCE
OF
WEST
SULAWESI
409
LAMPIRAN /
APPENDIX
2.30.
PROVINSI MALUKU
PROVINCE
OF
MALUKU
421
LAMPIRAN /
APPENDIX
2.31.
PROVINSI MALUKU UTARA
PROVINCE OF NORTH MALUKU
433
LAMPIRAN /
APPENDIX
2.32.
PROVINSI PAPUA BARAT
PROVINCE
OF
WEST
PAPUA
445
LAMPIRAN /
APPENDIX
2.33.
PROVINSI PAPUA
DAFTAR TABEL
LIST OF TABLES
Halaman
Page
Tabel /
Table
2.1.
Rasio Jenis Kelamin menurut Kelompok Umur, 1971-2010
Sex Ratio by Age Group 1971-2010
10
Tabel /
Table
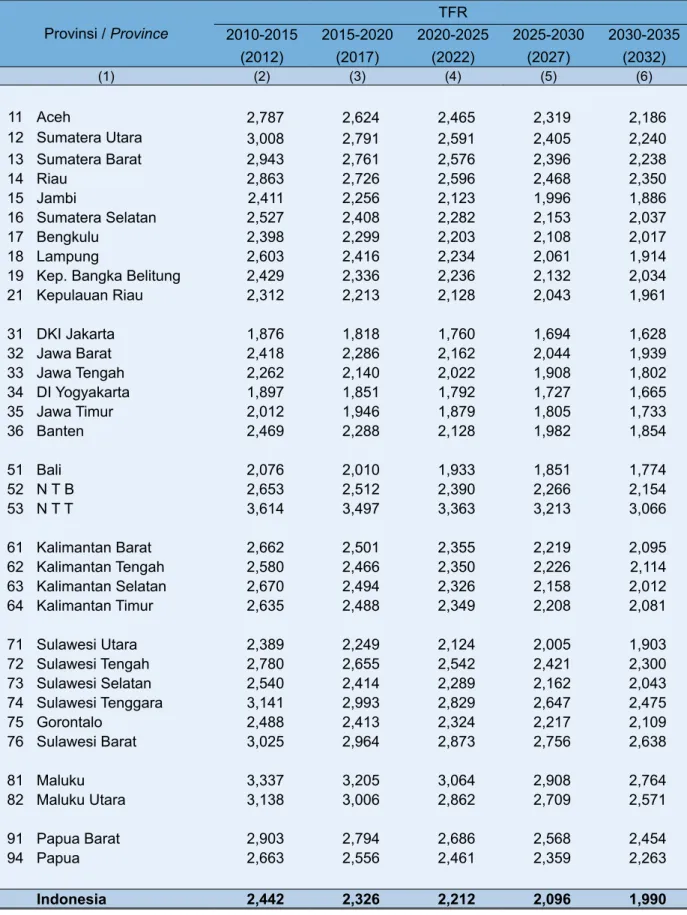
2.2.
Proyeksi Angka Kelahiran Total (TFR) menurut Provinsi, 2010-2035
Projected Total Fertility Rate (TFR) by Province, 2010-2035
19
Tabel /
Table
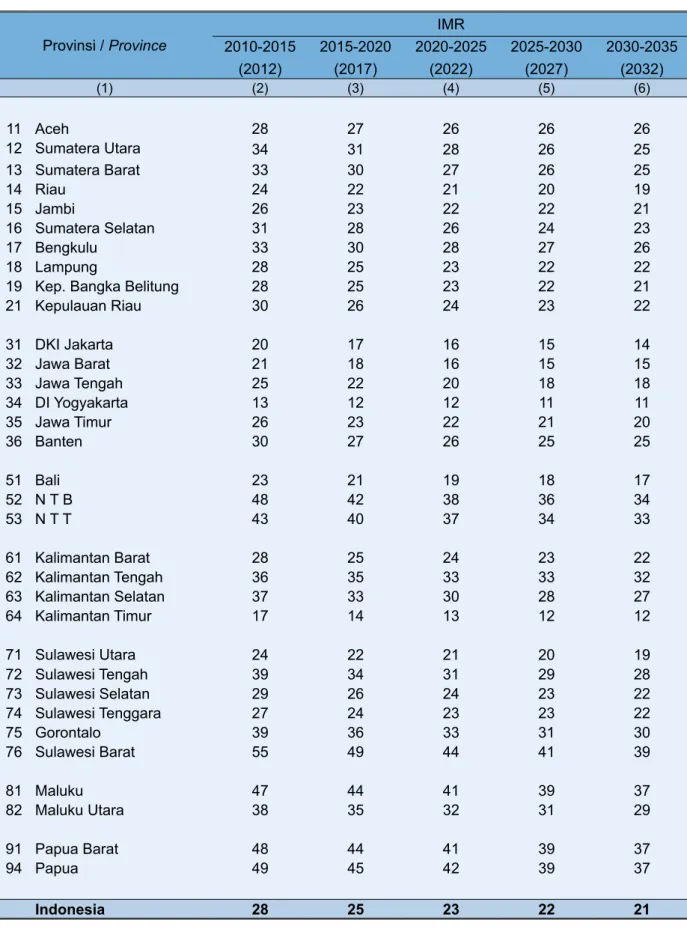
2.3.
Proyeksi Angka Kematian Bayi (IMR) menurut Provinsi, 2010-2035
Projected Infant Mortality Rate (IMR) by Province, 2010-2035
20
Tabel /
Table
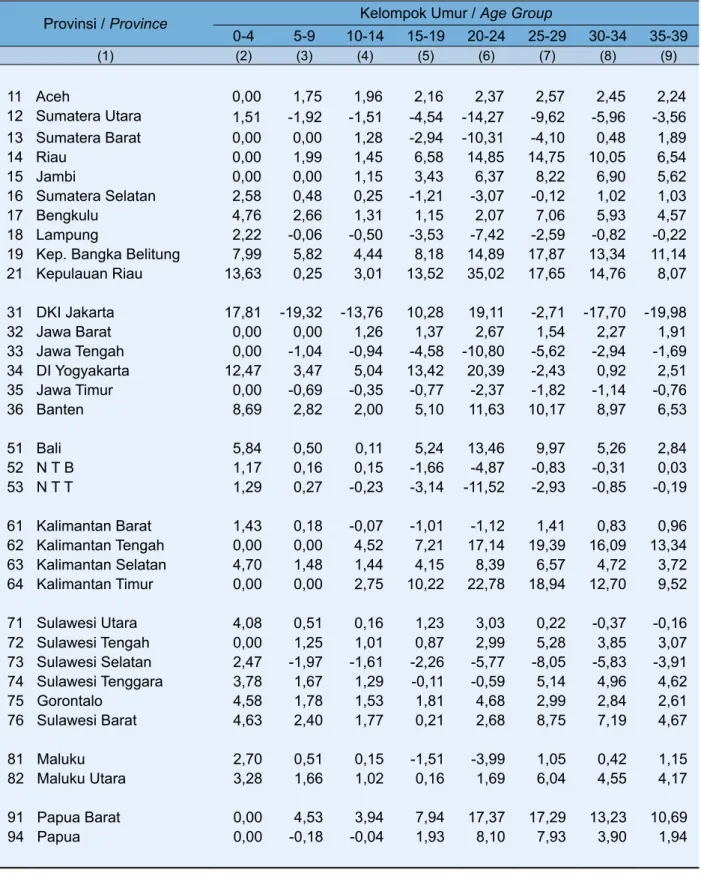
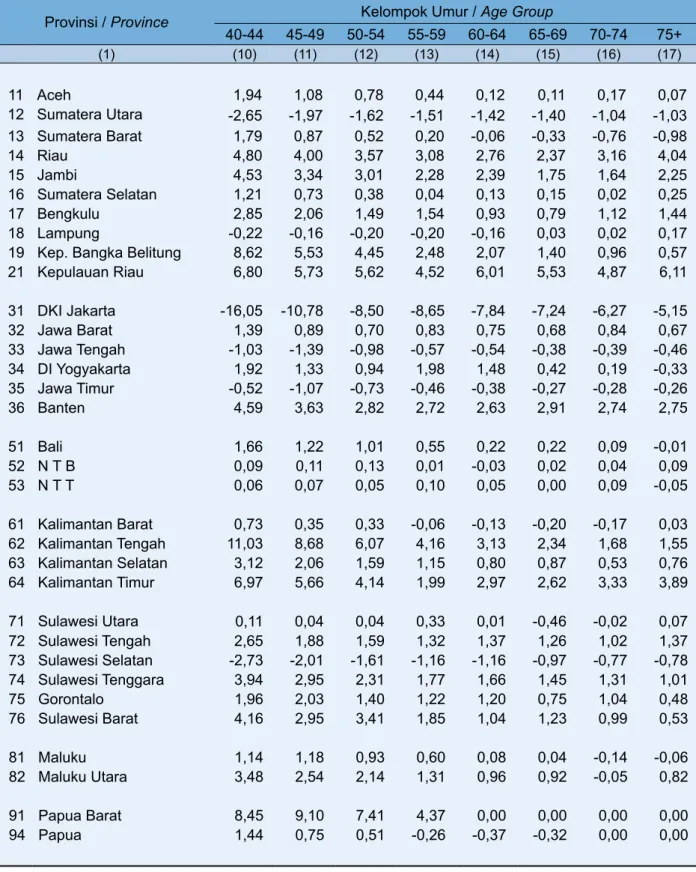
2.4.
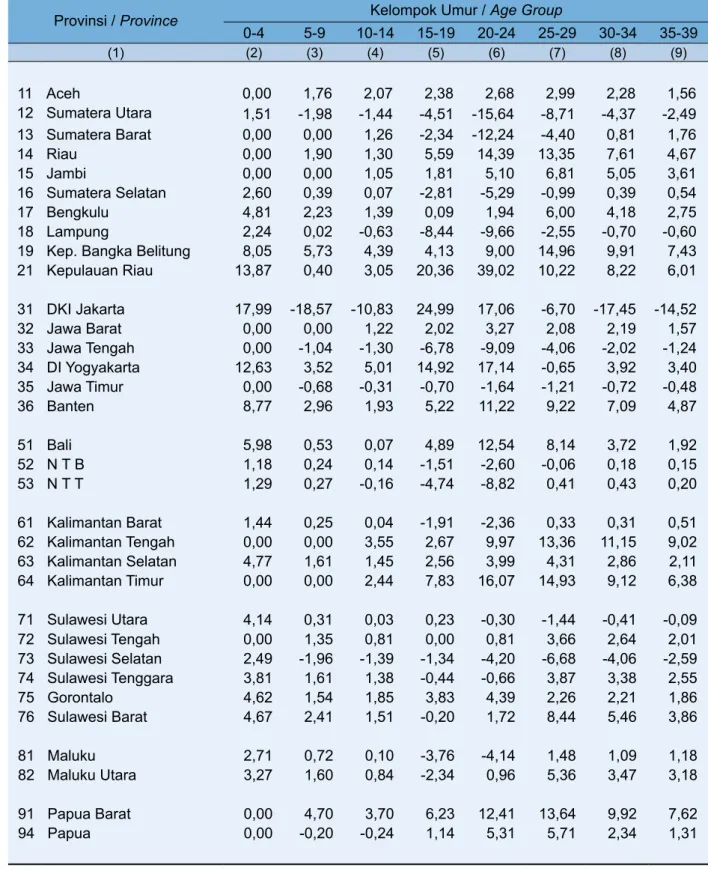
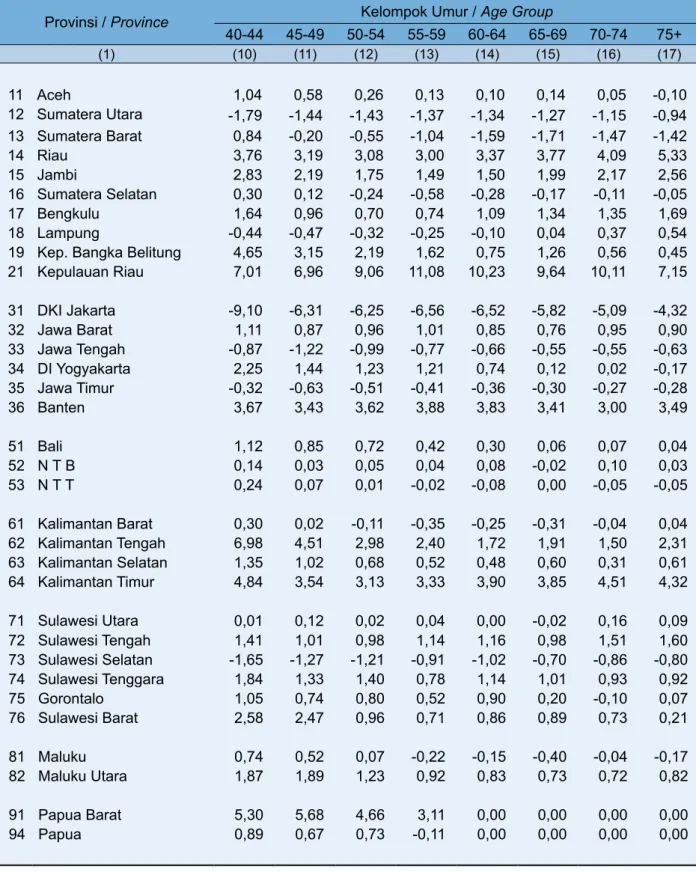
Migrasi Neto Laki-laki menurut Kelompok Umur
Net Migration of Male by Age Group
22
Tabel /
Table
2.5.
Migrasi Neto Perempuan menurut Kelompok Umur
Net Migration of Female by Age Group
24
Tabel /
Table
2.6.
Perbedaan Laju Pertumbuhan Penduduk Daerah Perkotaan dan Perdesaan
(URGD) per Provinsi, 2010-2035
Urban and Rural Population Growth Rate Difference (URGD) by Province,
2010-2035
28
Tabel /
Table
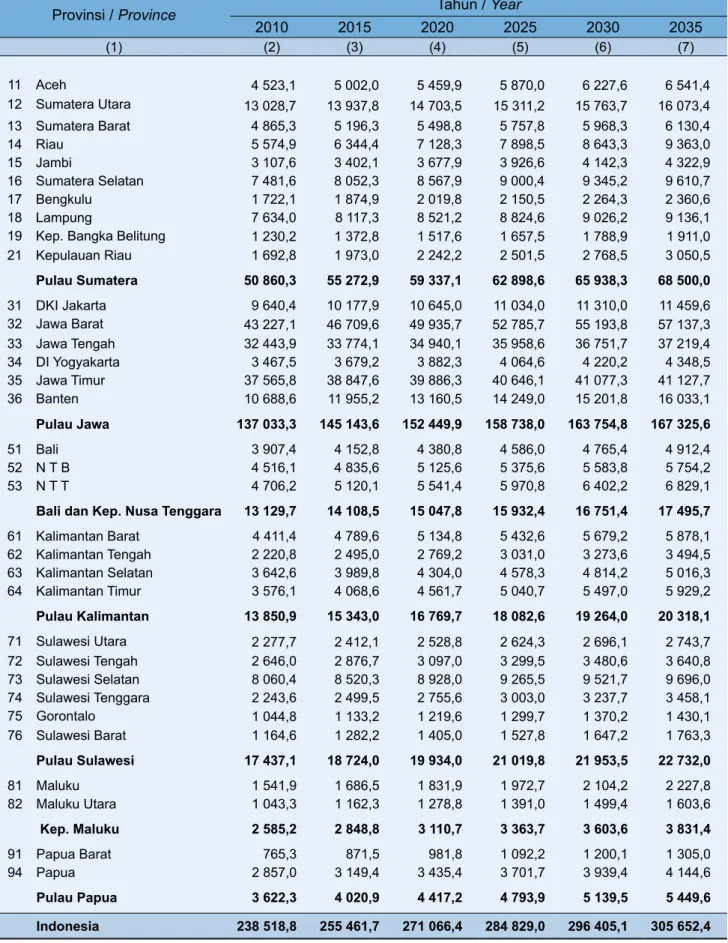
3.1.
Proyeksi Penduduk menurut Provinsi, 2010-2035 (Ribuan)
Population Projected by Province, 2010-2035 (in thousands)
33
Tabel /
Table
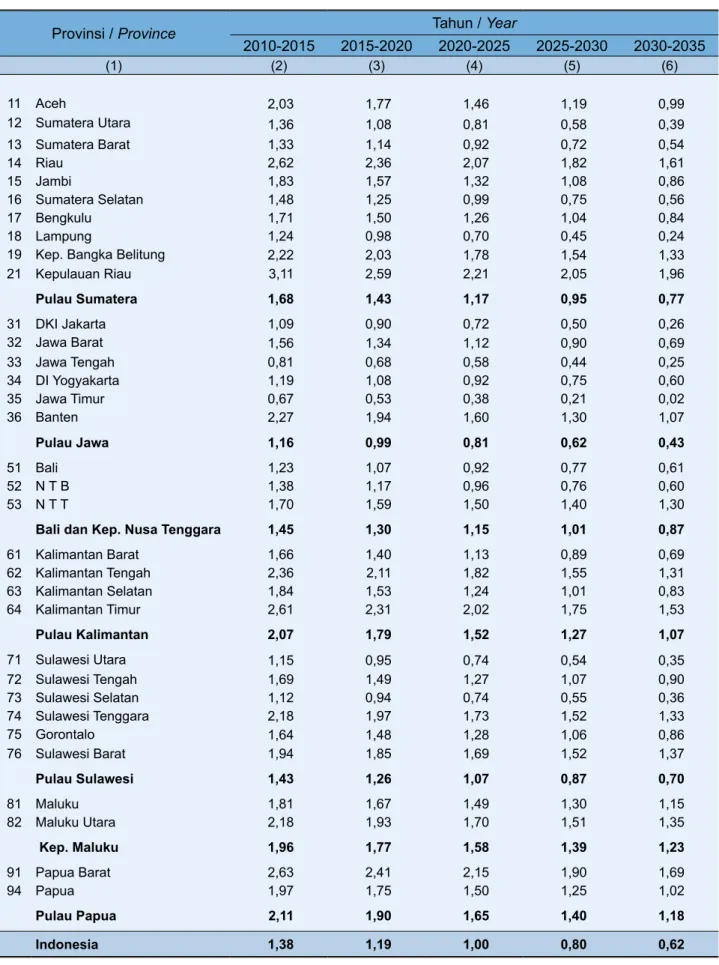
3.2.
Laju Pertumbuhan Penduduk menurut Provinsi, 2010-2035
Population Growth Rate by Province, 2010-2035
34
Tabel /
Table
3.3.
Proyeksi Proporsi Penduduk Umur 0-14 menurut Provinsi, 2010-2035 (%)
Ratio Projected Population of Age 0-14 by Province, 2010-2035 (%)
37
Tabel /
Table
3.4.
Proyeksi Proporsi Penduduk Umur 15-64 menurut Provinsi, 2010-2035 (%)
Ratio Projected Population of Age 15-64 by Province, 2010-2035 (%)
38
Tabel /
Table
3.5.
Proyeksi Proporsi Penduduk Umur 65+ menurut Provinsi, 2010-2035 (%)
Ratio Projected Population of Age 65+ by Province, 2010-2035 (%)
39
Tabel /
Table
3.6.
Proyeksi Proporsi Penduduk Umur 60+ menurut Provinsi, 2010-2035 (%)
Ratio Projected Population of Age 60+ by Province, 2010-2035 (%)
40
Tabel /
Table
3.7.
Dependency Ratio
menurut Provinsi, 2010-2035
Dependency Ratio by Province, 2010-2035
41
Tabel /
Table
3.8. Proyeksi
Net Reproduction Rate
(NRR) menurut Provinsi, 2010-2035
Tabel /
Table
3.9.
Proyeksi Umur Harapan Hidup (e0) menurut Provinsi, 2010-2035
Projected Life Expectancy (e0) by Province, 2010-2035
45
Tabel /
Table
3.10.
Persentase Penduduk Daerah Perkotaan menurut Provinsi, 2010-2035
Percentage of Urban Population by Province, 2010-2035
47
Tabel /
Table
3.11.
LPP dan Penduduk Indonesia Hasil Proyeksi Kilas Balik 2010-2000 (Ribuan)
Population Growth Rate and Population of Indonesia as the Result of
DAFTAR GAMBAR
LIST OF FIGURES
Halaman
Page
Gambar /
figure
2.1.
Piramida Penduduk Indonesia Tahun 2010
Population Pyramid of Indonesian in 2010
9
Gambar /
figure
2.2.
Rasio Jenis Kelamin Penduduk Indonesia
1.1. Latar Belakang
Para pemakai data kependudukan,
khususnya para perencana, dan pengambil
kebijakan sangat membutuhkan data
penduduk yang berkesinambungan dari tahun
ke tahun. Sayangnya sumber data penduduk
yang tersedia hanya secara periodik, yaitu
Sensus Penduduk (SP) pada tahun-tahun
yang berakhiran dengan angka 0 (nol) dan
Survei Penduduk Antar Sensus (SUPAS)
pada pertengahan dua sensus atau
tahun-tahun yang berakhiran dengan angka 5 (lima).
Sumber data kependudukan lain yaitu registrasi
penduduk masih belum sempurna cakupan
pencatatannya sehingga datanya belum dapat
digunakan untuk perencanaan pembangunan
nasional.
Seperti diketahui bahwa hampir
semua rencana pembangunan perlu ditunjang
dengan data jumlah penduduk, persebaran
dan susunannya menurut kelompok umur
penduduk yang relevan dengan rencana
tersebut. Data yang diperlukan tidak hanya
menyangkut keadaan pada waktu rencana itu
disusun, tetapi juga informasi masa lampau
dan yang lebih penting lagi adalah informasi
perkiraan pada waktu yang akan datang. Data
penduduk pada waktu lalu dapat diperoleh
BAB I
PENDAHULUAN
1.1. Background
The users of population data,
particularly planners and policy makers need
continuous data of the population every
year.The population data is unfortunately
only available periodically from the Census
of Population in the years ending with 0
(zero) and from the Inter-Census Population
Survey held between two censuses or in the
years ending with 5 (five). Another source of
population data namely the registration data
still has discrepancies in its recording coverage
that renders the data unusable for the national
development planning.
As widely known, nearly all development
planning requires data such as the number of
population, the distribution of population and
the structure of age groups relevant to the
plan.The data required does not only cover the
condition at the time of planning, but also the
past information and more importantly forecast
for the future. The population data of the past
can be obtained from the results of surveys
and censuses. However, for the present and
future data it is necessary to make a population
CHAPTER I
INTRODUCTION
memenuhi kebutuhan data penduduk pada
saat ini dan masa yang akan datang perlu
dibuat proyeksi penduduk, yaitu perkiraan
jumlah penduduk dan komposisinya di masa
mendatang.
Proyeksi penduduk bukan merupakan
ramalan jumlah penduduk tetapi suatu
perhitungan ilmiah yang didasarkan pada
asumsi dari komponen-komponen laju
pertumbuhan penduduk, yaitu kelahiran,
kematian, dan perpindahan. Ketiga komponen
inilah yang menentukan besarnya jumlah
penduduk dan struktur umur penduduk di
masa yang akan datang. Untuk menentukan
masing-masing asumsi diperlukan data yang
menggambarkan tren di masa lampau hingga
saat ini, faktor-faktor yang mempengaruhi
komponen-komponen itu, dan hubungan
antara satu komponen dengan yang lain serta
target yang diharapkan tercapai pada masa
yang akan datang.
Badan Pusat Statistik (BPS) telah
beberapa kali membuat proyeksi penduduk
berdasarkan data hasil SP71, SP80, SP90,
SP2000 dan SUPAS85, SUPAS95, dan
SUPAS2005. Proyeksi penduduk yang terakhir
dibuat adalah proyeksi penduduk berdasarkan
hasil SUPAS2005 yang mencakup periode
2000-2025.
Hasil SP2010 mengkoreksi jumlah
penduduk pada proyeksi penduduk 2000-2025.
and its composition in the future.
A population projectionis not a forecast
of the population, it is a scientific calculation
based on the assumptions of population
growth rate components i.e. birth, death
and migration. These three components
determine the number and structure of
population in the future.The data required for
each assumption has to represent the trends
of the past and the present, the factors that
affect the aforementioned components and the
connection of one component to the others as
well as the expected target for the future.
The Central Bureau of Statistics (BPS)
has done several population projections based
on the data from these population censuses
(SP) and inter-census population surveys
(SUPAS) namely SP71, SP80, SP90, SP2000,
and SUPAS85, SUPAS95, and SUPAS2005.
The latest population projection was done
based on the result of SUPAS2005 that covers
the period of 2000-2025.
The result of SP2010 corrected the
number of population from the population
Menengah dan Rencana Pembangunan Jangka
Panjang diperlukan data jumlah penduduk
sampai dengan tahun 2035. Oleh karena itu,
dipersiapkan proyeksi penduduk berdasarkan
SP2010 mencakup periode 2010–2035. Data
dasar perhitungan proyeksi ini adalah data
penduduk hasil SP2010 yang telah dilakukan
penyesuaian ke bulan Juni 2010, dan
asumsi-asumsi yang dibentuk selain menggunakan
data SP2010 juga menggunakan hasil Survei
Demografi dan Kesehatan Indonesia (SDKI).
Proyeksi penduduk Indonesia menurut
kelompok umur, jenis kelamin, dan provinsi
yang disajikan dalam publikasi ini merupakan
angka final dan mencakup kurun waktu dua
puluh lima tahun, mulai tahun 2010 sampai
dengan 2035. Pembuatan proyeksi dengan
kurun waktu yang panjang ini dimaksudkan
agar hasilnya dapat digunakan untuk berbagai
keperluan terutama untuk perencanaan jangka
panjang. Disisipkan pula proyeksi kilas balik
untuk memenuhi tren masa lalu hingga masa
yang mendatang. Dengan terbitnya publikasi
ini, maka proyeksi-proyeksi sebelumnya yang
masih mempunyai tahun rujukan yang sama
dengan publikasi ini dinyatakan tidak berlaku
lagi.
1.2. Isi Publikasi
Publikasi ini disajikan secara berurutan
dalam bab-bab berikut. Bab I menyajikan latar
belakang dibuatnya proyeksi penduduk. Bab
data for the Medium Term Development
Plan and the Long Term Development Plan.
Therefore a population projection is prepared
based on the SP2010 that covers the period of
2010–2035. The data used as the base of this
projection calculation is the data of population
from SP2010 that has been adjusted to the
month of June 2010. The assumptions are
formed using the data from SP2010 and the
results of the Indonesian Demographic and
Health Survey (IDHS).
The Indonesian population projection
by age group, sex and province presented in
this publication is the final number that covers
a period of twenty five years, from 2010 until
2035.The intention of preparing this projection
that covers a long period of time is so that
its result can be used for various purposes
especially for long term planning. A back
casting is also included to fulfill the trends of
the past and the future. With this publication,
the previous projections that have the same
reference as this publication are no longer
valid.
1.2. Content of Publication
This publication is presented in a
chronological order in the following chapters.
Chapter I presents the background of
yang dipakai dalam penghitungan proyeksi
yang terdiri dari enam sub bab yaitu: Metode
Proyeksi, Sumber Data, Evaluasi Data Dasar,
Penentuan Asumsi (Kelahiran, Kematian, dan
Perpindahan), Urbanisasi dan Proyeksi Kilas
Balik (
Backcasting
). Bab III menyajikan hasil
perhitungan proyeksi, dan Bab IV adalah
penutup.
the methodology and assumptions used in the
projection calculations. There are six sections
in this chapter i.e. Projection Method, Source of
Data Evaluation of Basic Data, Determination of
the Assumptions (Birth, Death, and Migration),
Urbanization and Backcasting. Chapter III
presents the result of the projection calculation
and Chapter IV contains the Conclusion.
BAB II
METODOLOGI, ASUMSI, DAN
PROYEKSI KILAS BALIK
2.1. Metode Proyeksi
Badan Pusat Statistik (BPS) telah
membuat proyeksi penduduk Indonesia
(2010-2035) dengan dasar hasil Sensus Penduduk
2010 (SP2010). Proyeksi ini dibuat dengan
metode komponen berdasarkan asumsi
tentang kecenderungan kelahiran, kematian,
serta perpindahan penduduk antar provinsi
yang paling mungkin terjadi selama periode
25 tahun yang akan datang. Tahapan yang
dilakukan adalah menghitung proyeksi
penduduk Indonesia, kemudian menghitung
proyeksi penduduk per provinsi. Selanjutnya
melakukan iterasi dengan penduduk Indonesia
sebagai patokan sehingga penjumlahan
proyeksi penduduk per provinsi hasilnya
sama dengan proyeksi penduduk Indonesia.
Hasil proyeksi tersebut dibahas dalam tim
teknis yang dibentuk oleh BPS, dan hasil
pembahasan tersebut didiskusikan lebih lanjut
dalam rapat tim yang terdiri dari para pejabat
dari Bappenas, Badan Kependudukan dan
Keluarga Berencana Nasional (BKKBN),
Kementerian Kesehatan, BPS, para akademisi
dan instansi-instansi lain yang terkait. Dalam
rapat tersebut selain dilakukan diskusi-diskusi
teknis tentang bagaimana menyusun proyeksi
penduduk, juga diputuskan bahwa ada suatu
2.1. Projection Method
The Central Bureau of Statistics (BPS)
has made an Indonesian Population Projection
(2010-2035) based on the results of the 2010
Population Census (SP2010). This projection
was made with the components method, based
on the assumptionson the trends of birth, death
and inter-provincial migration that were likely
to happen in the period of the next 25 years.
The steps taken were calculating the projected
population of Indonesia before calculating the
projected population by province. The next step
was iterating with reference to the Indonesian
population so that the sum of the population
projection by province is equal to that of the
population projection of Indonesia. The result
of the projection was discussed by a technical
team formed by BPS then the result of this
discussion was reviewed further in a team
meeting that consisted of officers of the National
Development Planning Agency (Bappenas),
National Population and Family Planning Board
(BKKBN), Ministry of Health, BPS, academics
and other related government agencies. In
this meeting, besides technical discussions
about how to prepare a population projection,
it was also decided to establish a reference
for population projection to be used formally
CHAPTER II
METHODOLOGY, ASSUMPTION,
AND BACKCAST PROJECTION
digunakan secara resmi dalam Rencana
Pembangunan Jangka Panjang (RPJP).
Proyeksi ini yang akan digunakan oleh
semua instansi pemerintah dalam menyusun
perencanaannya masing-masing.
Hasil proyeksi sangat ditentukan
oleh asumsi yang digunakan. Oleh karena
itu, menentukan asumsi merupakan kunci
perhitungan proyeksi penduduk. Biasanya
asumsi mengenai kecenderungan tingkat
kelahiran, tingkat kematian, serta perpindahan
penduduk ditentukan oleh tren yang terjadi di
masa lalu dengan memperhatikan berbagai
faktor yang mempengaruhi ketiga komponen
tersebut. Tetapi informasi ini belum cukup,
karena harus dilengkapi dengan pandangan
para pakar tentang kependudukan di masa
datang dan para pengambil keputusan
yang berwawasan luas tentang program
kependudukan di masa datang. Masukan
dari pertemuan tersebut menjadi pegangan
tim teknis BPS dalam membentuk asumsi
yang dipakai dalam perhitungan proyeksi.
Perhitungan proyeksi penduduk ini dilakukan
dengan menggunakan program
Rural Urban
Projection
(RUP).
2.2. Sumber Data
Berbagai sumber data digunakan untuk
melihat gambaran tentang pola kelahiran,
kematian, dan perpindahan di Indonesia.
Untuk keperluan proyeksi ini, sumber data
projection would be used by all government
agencies in their planning.
The result of the projection is
determined by the assumptions used in the
process. The assumptions are therefore the
key to determining the population projection
calculation. Assumptions on the trends of
birth rate, death rate and migration rate are
usually determined by the past trends taking
into account the factors that affect those three
components. However this information is
insufficient, because it needs to be supported
by expert opinions about the population in the
future and by the broad insights of decision
makers about population programe the
future. Input from this meeting will be used as
guidelines by the BPS technical team to form
assumptions for the projection calculations.
The calculation of the population projection is
done using the Rural Urban Projection (RUP).
2.2. Source of Data
Various data sources are used to look
at the pattern of birth, death and migration in
Indonesia. For this projection, the data used
are the censuses SP71, SP80, SP90, SP2000
SP2000, dan SP2010 , SUPAS85, SUPAS95,
dan SUPAS2005, SDKI91, SDKI94, SDKI97,
SDKI2002/2003, SDKI2007, dan SDKI2012.
Hal ini dilakukan dengan pertimbangan untuk
mengetahui pola secara lebih tepat serta dapat
menentukan angka kelahiran dan kematian
yang dipakai pada tahun tertentu. Dengan
demikian data yang akan dijajarkan dari masa
lalu hingga perkiraan di masa yang akan
datang tidak mengandung penyimpangan.
Sumber data untuk migrasi internal juga
diperoleh dari hasil SP dan SUPAS, namun
demikian karena pola dan arah migrasi internal
sangat dinamis maka pola yang dipakai hanya
pada periode terakhirnya.
2.3. Evaluasi Data Dasar
2.3.1. Evaluasi Data Umur dan Jenis
Kelamin
Data yang diperoleh dari hasil sensus
dan survei biasanya masih mengandung
kesalahan, walaupun telah diusahakan agar
kesalahan tersebut tidak terjadi atau sekecil
mungkin. Kesalahan yang paling sering
ditemukan adalah kurang tepatnya pelaporan
umur atau tidak melaporkan umur dengan
benar. Hal ini disebabkan penduduk tersebut
tidak mengetahui tanggal kelahirannya atau
umurnya, sehingga pelaporan umurnya hanya
berdasarkan perkiraan sendiri atau perkiraan
pencacah. Ada pula penduduk yang sengaja
menyembunyikan umur sebenarnya karena
SUPAS85, SUPAS95 and SUPAS2005,
demographic and health surveys IDHS91,
IDHS94, IDHS97, IDHS2002/2003, IDHS2007
and IDHS2012. These data are used in order
to find accurate patterns and to know the birth
and death rates in a given year. Thus the data
of the past trends and the estimate for the
future will not contain deviation.
The data for internal migrations are
obtained from the results of SP and SUPAS.
However since the pattern and direction of
internal migration are very dynamic, only the
pattern from the last period is used.
2.3. Evaluation of Basic Data
2.3.1. Evaluation of Age and Sex Data
Data obtained from censuses and
surveys often has deviation despite the effort
to avoid or minimize the deviations. The
most common mistake is the inaccuracy of
age reporting which happens because the
respondent does not know his date of birth or
his age, so the reporting of his age is only by his
own estimation or the census official’s. There
are people who hide their age deliberately and
for their own reasons report their age as being
older or younger.
Salah satu data dasar yang dibutuhkan
untuk membuat proyeksi penduduk dengan
metode komponen adalah jumlah penduduk
yang dirinci menurut umur dan jenis kelamin.
Oleh karena itu untuk keperluan proyeksi ini,
data dasar yang mengandung
kesalahan-kesalahan tersebut perlu dievaluasi secara
cermat, kemudian dilakukan perapihan dengan
tujuan untuk menghapus atau memperkecil
berbagai kesalahan yang ditemukan.
Mengingat pentingnya data mengenai umur,
maka dalam memperoleh keterangan umur
yang lebih baik, pada sensus atau survei
tentang kependudukan yang lalu, telah
ditempuh berbagai cara. Bagi responden yang
tahu tanggal lahirnya dalam kalender Masehi,
umur responden bisa langsung dihitung,
sedangkan bagi responden yang tahu tanggal
kelahirannya dalam kalender Islam, Jawa
dan Sunda, umur responden dihitung dengan
menggunakan tabel konversi kalender yang
disediakan dalam buku pedoman pencacahan.
Terakhir, untuk responden yang tidak tahu
tanggal kelahirannya, tetap diupayakan
memperoleh keterangan tentang umur dengan
menghubungkan kejadian penting setempat
atau nasional, atau membandingkan dengan
umur orang/tokoh setempat yang diketahui
waktu kelahirannya.
Walaupun berbagai usaha untuk
memperoleh keterangan tentang umur sudah
dilakukan namun data penduduk menurut
One of the basic data needed for
population projection with component method
is the size of population by age and sex. It is
therefore necessary to carefully evaluate the
basic data that has deviations and then align
the data in order to eliminate or minimize the
deviations found. Provided the importance
of the data of age, in the latest census or
population surveys various ways were carried
out in order to obtain better information on age.
For respondents who know their date of birth in
the regular calendar, their age can be calculated
directly. For respondents who know their date
of birth in the Moslem, Javanese or Sundanese
calendar, their age will be calculated using the
table of calendar conversion provided in the
census guidelines book. Lastly, in the case
of respondents who do not know their date of
birth, the information about their age is obtained
by association with important local or national
events or by comparison to the age of a local
figure whose date of birth is known.
Despite the various efforts to obtain
information on age, the data of population
by age from SP2010 still has error at the
terjadi antara lain karena adanya kebiasaan
penduduk, terutama yang tidak tahu tanggal
lahirnya, melaporkan umurnya pada
tahun-tahun yang berakhiran 0 dan 5. Masalah
ini jelas terlihat dalam piramida penduduk
Indonesia hasil SP2010, penduduk yang
umurnya berakhiran 0 dan 5 agak menonjol
jika dibandingkan dengan umur sekitarnya
(Gambar 2.1).
not know their date of birth, to report their age
by rounding the years to those ending with 0
and 5. This problem is clearly visible in the
Pyramid of Indonesian Population from the
SP2010, the number of respondents whose
age ends with 0 or 5 is significant compared to
other ages (Figure 2.1).
Piramida Penduduk Indonesia Tahun 2010
Gambar
Kesalahan pelaporan umur juga dapat
dilihat pada data Rasio Jenis Kelamin (RJK)
menurut umur hasil SP2010. Kalau pelaporan
umur baik, RJK pada suatu umur tertentu tidak
berbeda besar dengan umur yang disekitarnya.
Pada usia 0-4 tahun biasanya sedikit di atas
100, setelah umur tersebut RJK turun secara
teratur dan mencapai nilai di bawah 100
pada usia tua.
Kelompok Umur/
Age Group
Tahun /
Year
1971
1980
1990
2000
2010
(1)
(2)
(3)
(4)
(5)
(6)
0-4
5-9
10-14
15-19
20-24
25-29
30-34
35-39
40-44
45-49
50-54
55-59
60-64
65-69
70-74
75+
101,2
103,1
107,7
97,4
81,3
80,4
87,6
97,6
100,9
109,2
97,0
102,4
86,2
92,5
96,6
93,6
104,3
104,2
107,6
96,7
85,1
97,9
97,1
96,1
96,5
96,0
101,0
103,0
93,4
89,8
81,9
82,3
105,2
105,6
105,8
101,2
88,7
91,3
98,8
107,3
98,5
96,9
96,8
92,5
96,2
93,6
87,3
78,5
103,6
103,4
104,0
100,4
94,4
95,2
99,4
101,1
105,7
110,2
107,0
101,8
95,7
90,0
91,0
79,2
105,6
105,2
104,6
102,3
101,3
99,1
99,9
101,3
101,0
100,4
103,3
105,1
96,9
88,9
81,9
68,6
Jumlah
97,2
98,8
99,4
100,5
101,0
The deviations in age reporting can
also be seen in the data of the Sex Ratio
(Rasio Jenis Kelamin/RJK) by Age Group from
SP2010. If the age reporting is errorless, the
RJK for a particular age will not show a big
difference from that of other ages around it.
For 0-4 years the RJK is a little above 100, for
other ages there after the RJK shows regular
decrease and reaches below 100 for old age.
Rasio Jenis Kelamin Menurut Kelompok Umur, 1971-2010
Tabel
Gambaran seperti ini tidak terlihat pada Tabel
2.1 dan Gambar 2.2, karena RJK berfluktuasi
naik turun tidak menentu dan yang cukup
menarik adalah RJK pada kelompok usia
25-29 tahun, 30-34 tahun sangat rendah. Ada
pendapat yang menyebutkan bahwa hal ini
karena mobilitas laki-laki pada usia tersebut
sangat besar, sehingga banyak yang lewat
cacah pada waktu pencacahan.
This picture is not visible in Table 2.1 and figure
2.2, because the RJK fluctuates irregularly and
the RJK for the 25-29 years and 30-34 years
age groups are interistingly very low. One
opinion suggests that this is caused by the high
mobility of men of those age groups, that many
were not counted during the census.
2.3.2. Perapihan Umur
Perapihan umur perlu dilakukan
dengan tujuan untuk memperkecil kesalahan
yang ada dalam data. Jika perapihan umur
tidak dilakukan maka kesalahan-kesalahan itu
akan terbawa ke dalam perhitungan proyeksi,
sehingga akan mempengaruhi jumlah dan
struktur umur penduduk dalam periode proyeksi
tersebut. Dalam melakukan perapihan umur
2.3.2. Age Adjustment
Age adjustment is necessary in order to
minimise the deviation of the data. If this age
alignment is not applied, the deviation will be
used in the calculation of the projection and will
affect the number and the structure of age of
the population in the related projection period.
The challenge faced in the age adjustment
is that there is no exact knowledge of where
Rasio Jenis Kelamin Penduduk Indonesia
Gambar
Tahap kedua adalah perapihan
penduduk yang berusia 70 tahun ke atas,
menggunakan distribusi umur penduduk
70 tahun ke atas dari suatu negara yang
penduduknya sudah stabil. Kelompok
penduduk ini tidak besar pengaruhnya terhadap
hasil proyeksi karena jumlahnya relatif kecil
dan dalam waktu relatif singkat akan berkurang
5
P
x*
= Jumlah penduduk yang telah dirapihkan menurut kelompok umur 5 tahunan/
The number of population aligned by the multiple of 5 years age groups
5