i
BACHELOR THESIS (ME 141502)
THE EFFECT OF DIESEL ENGINE 93 KW ON TURBOCHARGER PERFORMANCE AT VARIOUS SPEED AND LOAD
Muhammad Sidiq Prabowo NRP 4212101021
Academic Supervisor:
1. Ir. Aguk Zuhdi Muhammad Fathallah, M.Eng, Ph.D 2. Dr. Benny Cahyono, ST, MT
DOUBLE DEGREE MARINE ENGINEERING (DD ME ) PROGRAM DEPARTMENT OF MARINE ENGINEERING
Faculty of Marine Technology
Institut Teknologi Sepuluh Nopember (ITS) Hochschule Wismar, University of Applied Science Surabaya
ii
iii
SKRIPSI (ME 141502)
EFEK PENGGUNAAN DIESEL ENGINE 93 KW
TERHADAP PERFORMA TURBOCHARGER PADA
VARIASI KECEPATAN DAN BEBAN
Muhammad Sidiq Prabowo NRP 4212101021
Academic Supervisor:
1. Ir. Aguk Zuhdi Muhammad Fathallah, M.Eng, Ph.D 2. Dr. Benny Cahyono, ST, MT
DOUBLE DEGREE MARINE ENGINEERING (DD ME ) PROGRAM DEPARTMENT OF MARINE ENGINEERING
Faculty of Marine Technology
Institut Teknologi Sepuluh Nopember (ITS) Hochschule Wismar, University of Applied Science Surabaya
iv
vi
viii
x
xi
DECLARATION OF HONOUR
I, who signed below hereby confirm that:
This final project report has written without any plagiarism act, and confirm consciously that all the dates, concepts, design, references, and material in this report own by Marine Power Plant Laboratory (MPP) in Department of Marine Engineering ITS which are the product of research study and reserve the right to use for further research study and its development.
Name : Muhammad Sidiq Prabowo
NRP : 4212 101 021
Bachelor Thesis Title : The Effect of diesel engine 93 kW on Turbocharger performance at various speed and load
Department : Marine Engineering
If there is any plagiarism in the future, I will fully responsible and receive the penalty given by ITS according to the regulation applied.
Surabaya, 25 December 2016
xii
xiii
PREFACE
Bismillahirrahmaanirrohiim
Alhamdulillahirabbilalamin, by the blessing of Allah SWT. The author is given strength and ease to accomplish the paper script in
time. This paper, by title “The Effect of diesel engine 93 kW on Turbocharger performance at various speed and load “is submitted
in fulfillment for Double Bachelor’s Degree Program in Institut
Teknologi of Sepuluh Nopember and Hochschule Wismar.
The author realizes that this task was not done by one
man’s efforts, but it was also supported by all sorts of sides
surrounding the author. Therefore, the author would say thanks’ to: 1. My beloved family, my mother Sitti Maolae S.E for incomparable love, patience and prayers. My Father Ipda Subakir for her spirit and motivation of the author in completing this thesis.
2. My Brothers and my sisters, for their love, supports and happiness in the family.
3. Ir.Dwi Priyanta MSE as the lecture guidance author in Marine Engineering FTK ITS.
4. Dr.Eng.M.Badrus Zaman,S.T., M.T as the head of Marine Engineering department Institut teknologi sepuluh nopember.
5. Ir. Aguk Zuhdi M. Fathallah, M.Eng, Ph.D as the supervisor 1 who has guided the author and motivation to accomplish the thesis.
6. Benny Cahyono , ST. MT. Ph.D as the supervisor 2 who has guided the author and motivation to accomplish the thesis.
xiv
8. Dhena Huwaida as my girlfriend who has given me motivation to accomplish the thesis.
9. Friends 2012 DD forces who have provided support and motivation.
10. My friend Alvin, Dimas angga, Radhin, Danang, Hafid, Kaka, Fadhil, Teuku, Akram, Akbar, Arvian, Bintan, hakam, yasin, demi, dani, ilyas and other friends that writer
can’t mention one by one.
11. Friends in the Laboratory of Marine Power Plant, MEAS, MMD, RAMS, and MMS who contribute in the completion of the thesis.
12. Friends 2012 Bismarck forces who have provided support and motivation.
Finally, the authors realize that this bachelor thesis is still not perfect yet. Therefore the authors expect some recommendation from the readers to make it better.
Surabaya, January 2017
xv
The Effect of Diesel Engine 93 kW on Turbocharger Performance at Various Speed and Load
Name : Muhammad Sidiq Prabowo
NRP : 4212 101 021
Department : Double Degree Marine Engineering (DD ME) Program
Supervisor : Ir. Aguk Zuhdi Muhammad F., M.Eng, Ph.D
Benny Cahyono, ST, MT, Ph D
Abstract
xvi
Simulation model show the high efficiency of turbocharger located on GT2052-1 at speed condition 1600 RPM and 0% load. The best output engine power, SFOC and torque from simulation show at turbocharger GT2052-3. The value of power, SFOC and torque are 96,82 kw, 228,02 g/kwh and 420,27 Nm respectively at full load condition and 2200 rpm speed.
xvii
TABLE OF CONTENTS
CHAPTER 1 INTRODUCTION ... 1
1.1 Background ... 1
1.2 Problem Formulation and Scope ... 2
1.3 Scope of Problem ... 2
1.4 Research Objectives ... 2
1.5 Research Benefit ... 3
CHAPTER 2 LITERATURE REVIEW………….. ... 5
2.1 Turbocharger Performance ... 5
2.2 Prediction turbocharger Performance using simulation ... 8
2.3 Compressor Map ... 10
CHAPTER 3 METHODOLOGY ... 11
3.1 Flow Diagram ... 11
3.2 Literature Study... 11
3.3 Data Collection ... 13
3.4 Modeling diesel engine 93 kw, turbocharger and dynamometer. ... 13
3.5 Model Validation ... 14
3.6 Data Collecting of Turbocharger Performance ... 15
3.7 Data Analysis ... 16
3.8 Conclusions and Recommendation ... 16
CHAPTER 4 DISCUSSION AND RESULTS ... 17
4.1 Engine Spesification Data Used ... 17
4.2 Turbocharger I (GT2052-1) ... 19
4.2.1 Turbocharger I Specification ... 19
4.2.2 Compressor Map (GT2052-1) ... 20
4.2.3 Turbocharger Dimension (GT2052-1) ... 21
4.2.5 Operating line turbocharger-compressor GT2052-1 with variable Speed and Load ... 23
4.2.6 Operating Line Turbo Turbine Engine (GT 2052-1) With Variable Load ... 25
xviii
4.2.8 Engine Brake Power with turbocharger GT 2052-1
... 27
4.2.9 Engine BSFC with turbocharger GT 2052-1 ... 28
4.3 Turbocharger II (GT2052-3) ... 29
4.3.1 Turbocharger II Specification ... 29
4.3.2 Compressor Map (GT2052-3) ... 30
4.3.3 Turbocharger Dimension (GT2052-3) ... 31
4.3.5 Operating line turbocharger-compressor GT2052-3 with variable Speed and Load ... 34
4.3.6 Operating Line Turbo Turbine Engine (GT 2052-1) With Variable Load ... 35
4.3.7 Engine Brake Torque with turbocharrger GT 2052-3 ... 2052-36
4.3.8 Engine Brake Power with turbocharger GT 2052-3 ... 37
4.3.9 Engine BSFC with turbocharger GT 2052-3 ... 38
4.4 Turbocharger - Engine Discussion ... 39
4.4.1 Engine installed with GT2052-1 Turbocharger ... 39
4.4.2 Engine installed with GT2052-3 Turbocharger ... 41
4.5 Turbocharger – Engine Matching Discussion ... 42
4.5.1 Turbocharger GT2052-1 output result ... 42
4.5.2 Turbocharger GT2052-3 output result ... 42
CHAPTER 5 CONCLUSSION ... 45
xix
LIST OF FIGURES
Figure 2. 1 Compressor map ... 10
Figure 3. 1 Flowchart bachelor thesis ... 12
Figure 4.1 Isometry design of engine 4 stroke, 4 cylinder 93 kw (Raharjo,2015) ... 17
Figure 4. 2 Turbocharger Garrett GT2502 (727264-1) ... 19
Figure 4. 3 GT2052 (727264-1) Compressor Map ... 20
Figure 4. 4 Garrett GT2502(727264-1) dimension ... 21
Figure 4. 5 Turbocharger Garrett GT2502-3 ... 29
Figure 4. 6 GT2052-3 Compressor Map ... 31
xx
xxi
LIST OF GRAPHS
Graph 4. 1 Operating line turbocharger compressor GT 2052 -1 With Variable speed and Load ... 23 Graph 4.2 Operating line turbocharger compressor engine
GT2052-1 With Variable speed 1400,1500,1600 RPM and variable load condition ... 24 Graph 4.3 Operating line turbocharger turbine GT2052-1 With
Variable Load ... 25 Graph 4.4 Operating line turbocharger turbine GT2052-1 With
Variable speed 1400,1500 RPM and variable load condition ... 26 Graph 4.5 Engine Brake Torque with turbocharger GT2052-1 ... 26 Graph 4.6 Graphic engine RPM vs Engine Brake Power with
turbochargerGT2052-1 ... 27 Graph 4.7 Graphic engine RPM vs BSFC with turbocharge
GT2052-1... 28 Graph 4.8 Operating line turbocharger compressor GT 2052 -3
With Variable speed and Load ... 35 Graph 4.9 Operating line turbocharger turbine GT2052-1 With
Variable Load ... 36 Graph 4.10 Engine Brake Torque with turbocharger GT2052-3 ... 37 Graph 4.11 Graphic engine RPM vs Engine Brake Power with
turbochargerGT2052-1 ... 38 Graph 4.12 Graphic engine RPM vs BSFC with turbocharge
xxii
xxiii
LIST OF TABLE
Table 4. 1 Engine Data Information ... 18 Table 4. 2 Turbocharger specification Garrett GT2502-1 ... 19 Table 4. 3 Load condition at 100%, 80% and 60% load with
turbocharger GT2052-1 ... 22 Table 4. 4 Turbocharger specification GT 2052-3 ... 29 Table 4. 5 Load condition at 100%, 80% and 60% load with
turbocharger GT2052-3 ... 33 Table 4. 6 Turbine and Compressor output GT2052-1
Turbocharger on 100% load ... 40 Table 4. 7 Turbocharger GT2052-1 – Engine matching output ... 40 Table 4. 8 Turbine and Compressor output GT2052-3
xxiv
1 models. The growing number of equipment can be indicating the skill of human will be increased. One example in the field of machinery is turbocharger. The main function of turbocharger is to increase engine power by forcing extra air to combustion chamber inside the engine, so the amount of fuel burnt increase and make the combustion more perfect. Turbochargers not only help the engine to get more power but also reducing the exhaust gas emission. The main part of turbocharger consists of turbine, central hub, and compressor.
2
technique to obtain data to create a computer model of the motor being studied. The simulation results in the form of graphs and pictures that shows the parameters studied turbocharger performance.
1.2 Problem Formulation and Scope
Based on the description above, there is a few of problem formulation can be given:
1. How the impact variables load of diesel engine 93 KW on turbocharger performance?
2. How the impact variable speed of diesel engine 93 KW on turbocharger performance?
1.3 Scope of Problem
Based on the problem formulation and scope, there is a few scope of problem can be given:
1. The simulation using simulation modeling software.
2. Knowing the effect variable speed and load of diesel engine 93 KW on turbocharger performance.
3. Turbochargers used in the simulation are GT2052-1, GT2052-3.
1.4 Research Objectives
This bachelor thesis has purposes to :
1. Knowing the impact variable load of diesel engine 93 KW on turbocharger performance
3
1.5 Research Benefit
Benefit of this research are :
1. To increase a knowledge about the effect variable load on turbocharger performance.
4
5
CHAPTER 2
LITERATURE REVIEW
To better understand the effect of diesel engine 93 kW on turbocharger Performance at various load, existing study literature have been reviewed. Study literature the effect variation of load on turbocharger performance has proved have different efficiency in every different speed and load condition. This study literature review is about research already made previously and simulation software modeling.
2.1 Turbocharger Performance
Schieman (1992) say the job of turbocharger on diesel engine is to supply compressed air to the engine. The air, heated by the compression, passes through a cooler which reduces its temperature and increases its density. The air mass is compressed in the engine cylinder to a high pressure. Fuel is injected and burnt. The exhaust gases that are produced pass to
the turbocharger’s turbine, which driver the compressor.
6
study show the effect of using turbocharger on diesel engine performance parameters such as: power, fuel use and efficiency thermal in such small capacity diesel engine vehicles.
Kusnadi, (2010) make a research about “pengaruh penggunaan turbocharger terhadap unjuk kerja mesin diesel Type L300” in the research explain about the effect of turbocharger installation to diesel engine performance, with installation expected turbocharger air entering the engine will be more, so as to increase engine power and help more perfect performance diesel engines. With the addition of a turbocharger or weighing machine will increase the speed, so no need to require more gas to run, automatically he speed will increase with the installation of this turbocharger. The methodology of his research is testing procedure to perform this test there must be some construction changes to the installation of the diesel engine turbocharger. The results of this analysis that the power generated before and after using a turbocharger.
7
Rautenberg M., et al., (1983) these authors emphasize the heat transfer influence on the turbine power and on the compressor outlet temperature. The increase of this temperature leads to a density decrease, which isn’t favorable to the engine volumetric efficiency. The usual isentropic
efficiency is wrongly used. It doesn’t define the aero
dynamical quality of the compression, because it considers the heat transfers between the turbine, the compressor and the surrounding area. Thanks to experimental tests, the authors note a strong dependence between turbine inlet temperature and compressor outlet temperature. The geometrical turbocharger characteristics, mainly the distance between compressor and turbine, appear to influence greatly the heat fluxes.
Jung M., et al., (2002 suggest a parameterization of turbine maps to obtain the behavior of the turbine in its actual environment. They study heat losses considering the turbine as an exchanger which efficiency is derived from the manufacturers map. Aerodynamic and heat efficiencies are then added to obtain the global efficiency.
Muhawwaq (2016) explain about performance prediction of marine diesel 4 cycle 93 KW with simulation method engine performance predictions made based on variations in engine speed, that is 1000, 1200, 1400, 1500, ignition delay).
8
modeling the engine in simulation software. Simulation covers the entire engine from the dimensions, air flow in-out, fuel injection systems, etc. An engine performance prediction was done by installation of three turbochargers with different specifications. The simulation process was made into several cases based on the engine speed 800, 1000, 1200, 1400, 1500, 1600, 1700, 1800, 1900, 2000, 2200 RPM. Turbochargers used in the simulation are GT2052-1, GT2052-3.
This research was conducting a study about the effect of diesel engine 93 kW on turbocharger performance at various speeds and load.
2.2 Prediction turbocharger Performance using simulation
There are several methods for predicting the performance of the diesel engine-based simulation.
Riegler & Bargende (2002) states that the GT-POWER is software for the simulation model of the steady state and transient and can be used to analyze the machines. This software can be applied to all types of internal combustion engines and provides a variety of models of components and other advanced concepts. GT-POWER running based on the dynamics of one-dimensional gas, flow, heat transfer in piping systems and other components on the machine Engine power rating usually indicates the largest, torque, and the maximum speed that can be given machine and provide economic value, reliability, and durability are satisfactory.
9
valve condition. It is shown that the efficiency of the engine volumetric responds almost quasi-stable under operation transient thus justifying the assumption of a correlation between the speed steady and transient data.
Bingham (1987) explain about computer simulations have been used widely in the development of the intake and exhaust systems. However, considerable efforts can still have needed to identify a system that will achieve optimum cylinder charging and scavenging characteristics with minimum pumping losses.
Boretti G & Bickel M, (1996) explain about the use of computer simulation which can be used for optimization of high performance. To optimize of high performance can be done by naturally aspirated compression ignition engines such as stationary engines and ship engines. A comprehensive multi-zone thermodynamic model, developed in order to examine the effect of insulating the combustion chamber of diesel engine.
Badami (2002) research about application of computational methods for the development of a high performance four stroke engine using a simulation model built in GT Power simulation software. The simulation model was used to simulate the engine performance at full load and the data predicted from computer simulation have been compared, validated with experimental data. Also computer simulation techniques were applied to develop an exhaust system with experimental data.
10
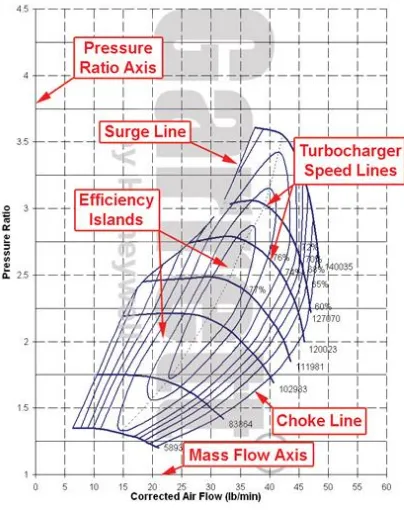
2.3 Compressor Map
The compressor map is a graph that describes a
particular compressor’s performance characteristics, including efficiency, mass flow rate, boost pressure capability, and turbo speed. Shown the figure 2.1 that identifies aspects of a typical compressor map:
11
CHAPTER 3
METHODOLOGY
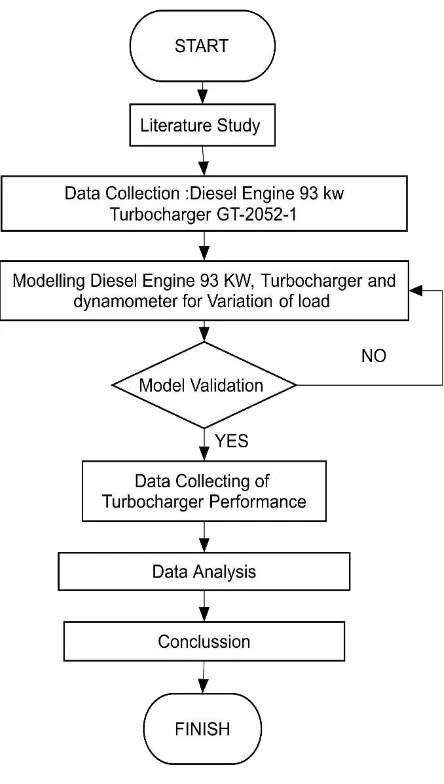
The methodology is a description of the steps carried out in a study. Methodology in this thesis includes all activities carried out to solve a problem on this thesis. In general, the method used in problem solving is diesel engine simulation modeling. Detail activities of this research are:
1. Literature Study
2. Data collection diesel engine 93 Kw and Turbocharger GT2052-1 and GT2052-3
3. Simulation modeling diesel engine 93 KW, turbocharger and dynamometer for variation of load
4. Running simulation
5. Validation and modeling analysis
3.1 Flow Diagram
Flowchart diagram activities of this research can be seen in figure 3.1.
3.2 Literature Study
12
13
3.3 Data Collection
The data used in this bachelor thesis is the data of Marine Diesel Engine designed by Juniono Raharjo, Arvian Pradana and Abdul Hakam students of Marine Engineering Department – ITS Surabaya. The data for this analysis will be collected from engine specification, turbocharger specification and dynamometer for various of load. The required data is as follows:
- Diesel engine 93 KW Specification are brand, engine Model, no. of Cylinder, rated power, displacement, bore, stroke, inlet valve, outlet valve, compression ratio, firing order, exhaust System, air intake system, lubrication system, fuel System.
- Turbocharger Specifications are brand, model, compressor, turbine, cooling and dimension.
- Dynamometer using for variation of load.
3.4 Modeling diesel engine 93 kW, turbocharger and dynamometer.
Modelling marine diesel engine 93 KW performed using software. Modeling done by similar real diesel engine, so that the result obtained will be possible for analysis. Modeling and simulation done based on diesel engine specification that has been designed previously. Engine specification see on table 4.1. Modeling and simulation done in several stages. Modeling steps are:
3.4.1 Modeling measurement
14
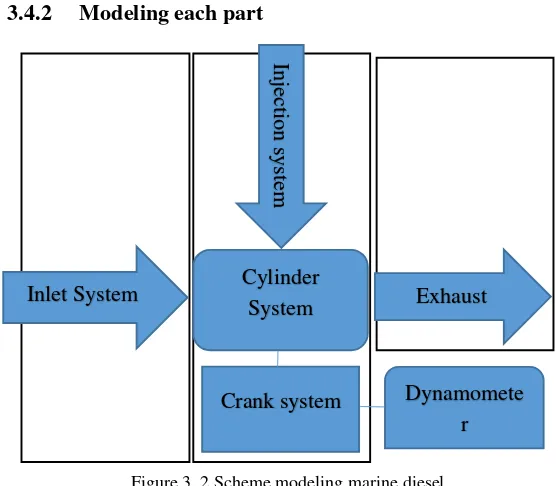
Figure 3. 2 Scheme modeling marine diesel
3.4.2 Modeling each part
3.4.3 Object definition
The modeling diesel engine must be made by inserting the data in accordance with required parameter. It is called with definition object. The model divided 3 system are intake system, cylinder system and system fuel injection, and the system exhaust. The model 1D simulation can be added dynamometer for variable load condition.
a. Intake system, there are several object can definition. There are inlet environment, piping system, compressor, Inter cooler, Intake runner, Intake port, and Intake valve. b. Cylinder system, crank and fuel injection system, there are
several component can definition. There are cylinder, fuel injector, engine crank train and dynamometer.
15
c. Exhaust system, there are several component can definition. There are exhaust valve, exhaust port, Exshaust runner, Turbine and End environment.
3.4.4 Connecting each part
After object definition is completed, then enchaining each part. Objects arranged in accordance with the order of the system. The complete mode marine diesel 93 Kw see on figure 3.2.
3.5 Model Validation
At this stage, the output model from simulation process not exactly resulted the correct data of engine performance. The output model obtained as a result from engine simulation might be had some of error. So we have to repeat the step of the simulation stage to find failures and corrected the input data. If the model has been obtained correctly, then we can go to the next step. Parameter used as a reference of diesel engine power by Abdul hakam muhawwaq (2016) is 40.3462 KW at no turbocharger condition. If the power is equal or greater the model is right.
3.6 Data Collecting of Turbocharger Performance
16
3.7 Data Analysis
If the data have been obtained, it can be carried to next step is analysis data. Data output from model run at speed 800, 1000, 1200, 1400, 1500, 1600, 1700, 1800, 1900, 2000, 2200 RPM. The simulation were conducted with different loads, begin from 0%, 20%, 40%, 60%, 80%, 100% and 20% overload. This is done to find out more detail the performance of turbocharger.
3.8 Conclusions and Recommendation
17
CHAPTER 4
DISCUSSION AND RESULTS
In this chapter exsplain about discussion and analysis of this research from result simulation software.
4.1 Engine Spesification Data Used
Simulation done by marine diesel engine which has been design in previous study. The following is a specification of the engine data will be used in the simulation. Figure 4.1. design engine by Raharjo :
Figure 4.1 Isometry design of engine 4 stroke, 4 cylinder 93 kw (Raharjo,2015)
18
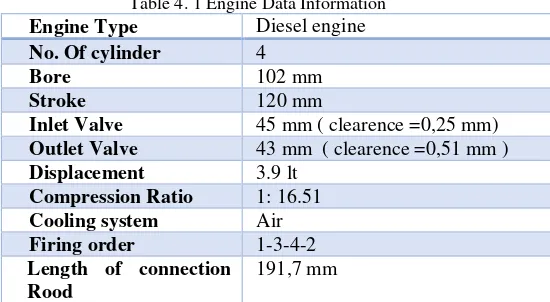
Cummins model 4BTA3.9-M125. For more information, see table 4.1:
Table 4. 1 Engine Data Information Engine Type Diesel engine No. Of cylinder 4
Bore 102 mm
Stroke 120 mm
Inlet Valve 45 mm ( clearence =0,25 mm) Outlet Valve 43 mm ( clearence =0,51 mm ) Displacement 3.9 lt
Compression Ratio 1: 16.51 Cooling system Air Firing order 1-3-4-2 Length of connection
Rood
191,7 mm
Source : (http://turbobygarrett.com/ )
Every simulation process, simulator software can show multiple output file containing simulation results in various format. The result output can using for performance analysis of the turbocharger. Output of simulation showing on software aplication, can using for showing grafic and data output. At the end of simulation process, report that summarizes the simulation result can be made. This report contains the important information about simulation and simulation results in the form of graph and table.
19
4.2Turbocharger I (GT2052-1)
Figure 4.2 explain about model turbocharger GT 2052-3. Turbocharger using on simulation model.
Figure 4. 2 Turbocharger Garrett GT2502 (727264-1) (http://turbobygarrett.com/ )
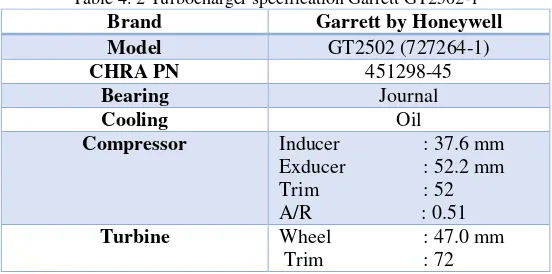
4.2.1 Turbocharger I Specification
This table 4.2 explain about turbocharger GT-2052 (72726-1) specification example brand, model, cooling, bearing and etc.
Table 4. 2 Turbocharger specification Garrett GT2502-1
Brand Garrett by Honeywell
Model GT2502 (727264-1)
CHRA PN 451298-45
Bearing Journal
20
A/R : 0.50
Housing inlet : Single
Wastegate Internal
Water Cooled No
Ball Bearing No
Source : (http://turbobygarrett.com/ )
4.2.2 Compressor Map (GT2052-1)
Compressor map is a graph that describes a particular
compressor’s performance characteristics, including
efficiency, mass flow range, boost pressure capability, and turbo speed. Figure 4.3 that identifies aspects of compressor map GT 2052-1:
21
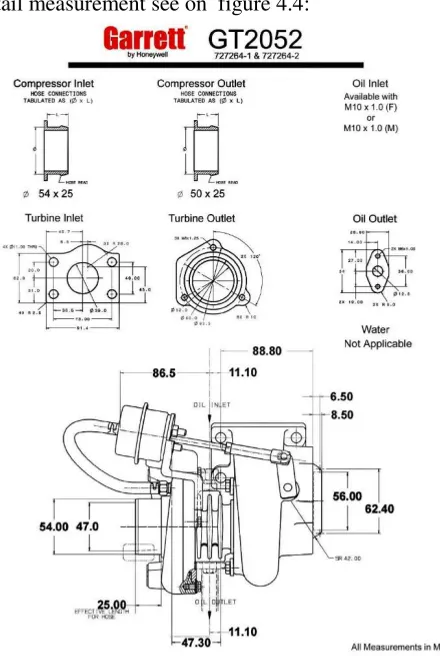
4.2.3 Turbocharger Dimension (GT2052-1)
Dimension of turbocharger GT-2052 exsplain about compressor inlet, compressor outlet, oil inlet, turine inlet, turbine outlet, oil outlet and all turbocharger measurement. For detail measurement see on figure 4.4:
22
4.2.4 Modeling load on engine model with turbocharger G2052-1
Load in engine every speed and load condition is different. Load is weight, quantity, or nature of what is being carried by a transporting vehicle. This simulation divided load into seven categories 0%, 20, 40, 60, 80, 100%and 120% load. Table 4.3 is torque of engine was use on simulation model :
Table 4. 3 Load condition at 100%, 80% and 60% load with turbocharger GT2052-1
Source: Author running simulation and calculation
The table 4.3 is show the value of torque on some condition. Value of torque at 100% load take it by output simulation model with engine and turbocharger GT2052-1. From output simulation model high torque located on 1900 rpm at 100% load.
Torque at 80% and 60% load get from calculation. The formula of value torque except 100% is:
τ𝑙𝑜𝑎𝑑= 𝐿𝑜𝑎𝑑 𝑥 τ100%
23
Where, τ𝑙𝑜𝑎𝑑 = Value of torque at specific condition 𝐿𝑜𝑎𝑑 = Load at one condition
τ100% = Torque at 100% condition
Running simulation model using to get the value of torque every speed and load condition except 100% load. Dynamometer using for input load to the engine. model simulation running and get the output data operating line turbocharger compressor engine and operating line turbo compressor engine every speed and load condition.
4.2.5 Operating line turbocharger-compressor GT2052-1 with variable Speed and Load
The graph 4.1 is shown the operating line of turbocharger compressor GT2052-1 to the engine. Operating line turbocharger compressor to the engine data is used to verify the installation of the turbocharger on the engine.
24
From graph 4.1 show operating line turbo compressor (compressor efficiency map-corrected), X line is mass flow (lb/min) and Y line is pressure ratio. Multicolour on the graph show efficiency of compressor. From the graph, the most efficiency of turbocharger compressor at 0% load and 1600 RPM with 75,856 %.
Magnifition of graph 4.1 is graph 4.2. the graph 4.2 explain operating line turbocharger GT2052-1 with variable speed 1400,1500,1600 RPM and all variable load condition.
Graph 4. 2 Operating line turbocharger compressor engine GT2052-1 With Variable speed 1400,1500,1600 RPM and variable load condition
25
4.2.6 Operating Line Turbo Turbine Engine (GT
2052-1) With Variable Load
Graph 4.3 is show the operating line of turbocharger turbine. This graph 4.3 explained about turbine efficiency map, X line is mass flow (lb/min) and Y line is pressure ratio. Multicolour on the graph show efficiency of compressor.
Graph 4. 3 Operating line turbocharger turbine GT2052-1 with Variable Load
From the graph 4.3, the most efficiency of turbocharger turbine at 0% load and 2200 RPM with 72,2177 %. The colour on graph show eficiency of turbocharger.
26
Graph 4. 4 Operating line turbocharger turbine GT2052-1 With Variable speed 1400, 1500 RPM and variable load condition
The variable load is all dots on the graphic. Seven dots on the graph show one speed condition. Red dots is 120% load, white dots is 100% load and etc.
4.2.7 Engine Brake Torque with turbocharger GT
2052-1
Graph 4.5 show relationships between torques and engine RPM at variation speed and load condition.
27
From the graph 4.5 show maximum brake torque located on 1900 RPM at 120% load. The value of torque is 512,43 Nm. The lowest torque is at 800 RPM at 20% load with a value of 53,494 Nm. The graph is show value of torque increase until 1900 RPM. After it reach the highest torque at 1900 RPM then the torque decreased again to maximum revolution of the engine.
4.2.8 Engine Brake Power with turbocharger GT 2052-1
The graph 4.6 show the power output of engine with installation turbocharger GT2052-1.
Graph 4. 6 Graphic engine RPM vs Engine Brake Power with turbochargerGT2052-1
28
power is 4,78 kW at 800 RPM and 20% load. The higest power generated at 2200 RPM with a value of 93.622 Kw at full load condition. As the increases of engine revolution, power generated will be increased until certain point and the the power will decreased again.
4.2.9 Engine BSFC with turbocharger GT 2052-1
Brake specific fuel consumption (BSFC) is a measure of the fuel efficiency of any prime mover that burns fuel and produces rotational, or shaft, power. This graph 4.7 is showing specific fuel oil consumption every speed and load condition.
Graph 4. 7 Graphic engine RPM vs BSFC with turbocharge GT2052-1
29
located on 20% load and 800 RPM and lower consumption located on 1600 RPM at full load condition.
4.3 Turbocharger II (GT2052-3)
Figure 4.5 explain about model turbocharger GT 2052-3. Turbocharger using on simulation model.
Figure 4. 5 Turbocharger Garrett GT2502-3 (http://turbobygarrett.com/ )
4.3.1 Turbocharger II Specification
Table 4.4 is explaining about turbocharger GT 2052-3 specification example brand, model, cooling, bearing and etc.
Table 4. 4 Turbocharger specification GT 2052-3
Brand Garrett by Honeywell
Model GT2502 (727264-1)
CHRA PN 451298-44
Bearing Journal
Cooling Oil
Compressor Inducer : 36.1 mm Exducer : 52.2 mm
30
A/R : 0.51 Turbine Wheel : 47.0 mm
Trim : 72
A/R : 0.50
Housing inlet : Single
Wastegate Internal
Water Cooled No
Ball Bearing No
Source : (http://turbobygarrett.com/ )
4.3.2 Compressor Map (GT2052-3)
31
Figure 4. 6 GT2052-3 Compressor Map (http://turbobygarrett.com/ )
4.3.3 Turbocharger Dimension (GT2052-3)
32
Figure 4. 7 Garrett GT2502(727264-3) dimension (http// www. turbobygarrett.com)
4.3.4 Modeling load on engine model with turbocharger G2052-3
33
carried by a transporting vehicle. This simulation divided load into seven categories 0%, 20, 40, 60, 80, 100%and 120% load. Table 4.5 is torque of engine was use on simulation model :
Table 4. 5 Load condition at 100%, 80% and 60% load with turbocharger GT2052-3
Source: Author running simulation and calculation
The table 4.5 is show the value of torque on some condition. Value of torque at 100% load take it by output simulation model with engine and turbocharger GT2052-3. From output simulation model high torque located on 1900 rpm at 100% load.
34 turbocharger compressor engine and operating line turbo compressor engine every speed and load condition.
4.3.5 Operating line turbocharger-compressor GT2052-3 with variable Speed and Load
Graph 4.8 is shown the operating line of turbocharger compressor GT2052-3 to the engine. Operating line turbocharger compressor to the engine data is used to verify the installation of the turbocharger on the engine.
35
Graph 4. 8 Operating line turbocharger compressor GT 2052 -3 With Variable speed and Load
The graph 4.8 operating line turbocharger-compressor GT2052-3. The dots from graph is variable load and Line on the graph show the same load every different condition. From the graph, the most efficiency of turbocharger compressor at 0% load and 1400 RPM with 71,1501%.
4.3.6 Operating Line Turbo Turbine Engine (GT
2052-1) With Variable Load
36
Graph 4. 9 Operating line turbocharger turbine GT2052-1 With Variable Load
From the graph show the most efficiency of turbocharger turbine at 0% load and 2200 RPM with 72,2026 %. The colour on graph show eficiency of turbocharger. The variable load is all dots on the graphic. Seven dots on graphic show one speed condition.
4.3.7 Engine Brake Torque with turbocharger GT
2052-3
37
Graph 4. 10 Engine Brake Torque with turbocharger GT2052-3
From the graph 4.10 show maximum brake torque located on 1900 RPM at 120% load. The value of torque is 552,408 Nm. The lowest torque is at 800 RPM at 20% load with a value of 85,27 Nm. The graph is show value of torque increase until 1600 RPM. After it reach the highest torque at 1600 RPM then the torque decreased again to maximum revolution of the engine.
4.3.8 Engine Brake Power with turbocharger GT 2052-3
38
The graph 4.11 show the power output of engine with installation turbocharger GT2052-3.
Graph 4. 11 Graphic of engine RPM VS Engine Brake Power with turbochargerGT2052-1
The power output measured at the engine’s flywheel. Brake power result obtained from the simulation, the low power is 5,31 kW at 800 RPM and 20% load. The higest power generated at 2200 RPM with a value of 96,88 Kw at full load condition. As the increases of engine revolution, power generated will be increased until certain point and the the power will decreased again.
4.3.9 Engine BSFC with turbocharger GT 2052-3
39
Graph 4. 12 Graphic engine RPM vs BSFC with turbocharge GT2052-3
The result from the graph is shown the fuel consumption in every engine rotational speed. From the graph show the high consumption is 1195,34 g/kwh. The low consumption is 212,81 g/kwh. The high fuel consumption located on 20% load and 800 RPM and lower consumption located on 1500 RPM at full load condition.
4.4 Turbocharger - Engine Discussion
4.4.1 Engine installed with GT2052-1 Turbocharger
40
Table 4. 6 Turbine and Compressor output GT2052-1 Turbocharger on 100% load
Type of Device Compressor Turbine
Speed [RPM] 165365 165365
Pressure Ratio (static) 2.38 2.41
Pressure Ratio 2.35 2.46
Outlet Temperature [K] 408 768
Map PR Exceeded/Stalled ? NO NO
PR less than 1.0 ? NO NO
Source: Output simulation modelling with turbocharger GT 2052-1
Table 4. 7 Turbocharger GT2052-1 – Engine matching output
LOAD RPM Brake Power
41
4.4.2 Engine installed with GT2052-3 Turbocharger
Based on the strandline performance output on GT2502-3 compressor and turbine map obtained the data output as shown above
Table 4. 8 Turbine and Compressor output GT2052-3 Turbocharger on 100% load
Type of Device Compressor Turbine
Speed [RPM] 178662 178662
Pressure Ratio (static) 2.48 2.48
Pressure Ratio 2.45 2.54
Outlet Temperature [K] 437 766
Map PR Exceeded/Stalled ? NO NO
PR less than 1.0 ? NO NO
Source: Output simulation modeling with turbocharger GT 2052-3
Table 4. 9 Turbocharger – Engine matching output GT2052-3
LOAD RPM Brake Power
42
of the engine is 96.823 kW. Fuel consumption used by 228.023 g/kWh, with torque value of 420.629 Nm.
4.5 Turbocharger – Engine Matching Discussion
Based on the performance of the engine which had been installed by a different turbocharger, there are differences between every engine power output results:
4.5.1 Turbocharger GT2052-1 output result
The first turbocharger installed resulted compressor efficiency of 73.933% with turbine efficiency of 72.022%. Maximum power output of the engine which installed with GT2502-3 turbocharger is equal to 93.622 kW or 125.549 HP at 2200 RPM. Boost pressure value at this point is 2.247 bar with a temperature of 408.01 K. This turbocharger generated power not as high as first turbocharger installed, but the efficiency of the compressor is greater.
4.5.2 Turbocharger GT2052-3 output result
43
4.7.3 Turbocharger installed on the engine
On choosing turbocharged on engine must be consideration some criteria, the criteria are :
1. The power output of the engine is the best choice. The best choice of power is the output power of engine is highest than other turbocharger.
2. Based on economic value the engine required less fuel consumption.
3. The engine must have high torque.
44
45
CHAPTER 5
CONCLUSSION
Based on the simulation results analysis that has been done, obtain some conclusions, among others:
5.1 Summary
1. The influence of variable load of diesel engine 93 KW on turbocharger performance is small. From two turbochargers (GT2052-1 and GT2052-3) the value of efficiency turbine and compressor on the condition constant speed with variables load has a value of nearly the same. The efficiency difference at certain load at constant speed is approximately 0.03%-0.5%.
2. The influence of variable speed of diesel engine 93 KW on turbocharger performance is high. From two turbochargers (GT2052-1 and GT2052-3) the value of efficiency turbine and compressor on the condition variable speeds with constant load has much different. The efficiency difference at certain speeds with constant load is approximately 1%-6%.
5.2 Suggestion
46
47
REFERENCE
Badami, 2002. Experimental and Computational Analysis of a High Performance Four-Stroke Motorcycle Engine Equipped with a Variable Geometry Exhaust System. SAE Paper, 01(0001). Bingham, 1987. intake system design using a validation internal combustion engine computer model. I. Mech. Engg. Conference, Issue No.C25/87.
Boretti A.A & Borghi M, 1996. Experimental and computational analysis of a high performance motorcycle engine. SAE Paper , Issue 962526, p. 8.
Jung M., et al., 2002. parameterization and transient validation of a variable geometry turbocharger for a mean-value modeling at low and medium speed- load points. AE Technical Paper 2002, 01(2729), p. 16.
Kusnadi, 2010. Pengaruh Penggunaan Turbocharger terhadap Unjek Kerja Mesin Diesel L300, Tegal: Program Studi D III Teknik Mesin Politeknik Harapan Bersama.
Medica, 2009. Performance Simulation of Marine Slow-Speed Diesel Propulsion Engine With Turbocharger Under Aggravated Conditions. Strojarstvo, 51(3), pp. 199-212.
Muhawwaq, A. H., 2016. Prediksi Performa Marine Diesel 4 Langkah 93 KW dengan Metode Simulasi, Surabaya: Sistem perkapalan, Institut Teknologi Sepuluh nopember.
48
Rautenberg M., Mobarak A. & Molababic M., 1983. Influence of heat transfer between turbine and compressor on the performance of small turbochargers. Gas Turbine Society of Japan, Volume 2(A85-41776 20-07), pp. 567-574.
Riegler, U. & Bargende, M., 2002. Direct coupled 1D/3D-CFD-Computation (GT-Power/Star-CD) of the Flow in the Switch-over Inteke System of an 8-Cylinder SI Engine with External Gas Cylinder Recirculation. s.l., SAE Paper 2002-01-0901.
schieman, j., 1992. Operating turbocharger. Turbo magazhine, march, pp. 32-34.
Simatupang & Eriyanti, N., 2014. Pengaruh Turbocharger Terhadap Performa Mesin Diesel di PLTD titi Kuning PT. PLN Sumatera. p. 33.
ATTACHEMENT 1
ATTACHEMENT 2
2.1 Output value of load on simulation turbocharger compressor GT2052-1
RPM
120% LOAD
100% LOAD
80% LOAD 60% LOAD 40% LOAD 20% LOAD
eff eff eff eff eff eff
2200 73.92 73.93 73.94 73.94 73.94 73.93
2000 74.21 74.11 74.12 74.08 74.05 74.01
1900 74.67 74.59 74.62 74.59 74.55 74.52
1800 75.09 75.07 75.13 75.12 75.10 75.08
1700 75.27 75.34 75.45 75.48 75.52 75.54
1600 74.85 75.11 75.29 75.46 75.61 75.74
1500 74.11 74.38 74.58 74.76 74.94 75.11
1400 73.38 73.63 73.84 74.02 74.20 74.38
1200 71.70 71.85 72.01 72.15 72.28 72.42
1000 70.04 70.14 70.31 70.45 70.58 70.72
2.2 Output value of load on simulation turbocharger turbine GT2052-1
RPM 120% LOAD 100% LOAD 80% LOAD 60% LOAD 40% LOAD 20% LOAD
eff eff eff eff eff eff
2200 71.93 72.02 72.05 72.09 72.14 72.18
2000 71.00 71.14 71.17 71.25 71.31 71.38
1900 70.37 70.54 70.58 70.67 70.75 70.83
1800 69.59 69.79 69.85 69.96 70.06 70.16
1700 68.64 68.87 68.96 69.10 69.22 69.34
1600 67.35 67.63 67.77 67.94 68.10 68.26
1500 65.65 65.99 66.20 66.42 66.63 66.83
1400 63.16 63.60 63.95 64.27 64.58 64.88
1200 55.65 56.20 56.90 57.45 57.98 58.49
1000 46.22 46.73 47.66 48.36 49.05 49.71
2.5 Output value of power, SFOC and torque load 20%
GT 2052-1 (20%)
RPM POWER (kW) SFOC (g/kwh) TORQUE (Nm)
2200 18.91 1155.12 81.28
2000 18.09 1135.42 85.27
1900 17.24 1127.37 85.41
1800 16.23 1121.92 84.72
1700 15.09 1121.29 83.20
1600 13.78 1120.60 80.57
1500 12.42 1122.32 77.28
1400 11.03 1127.82 73.34
1200 8.51 1143.34 65.46
1000 6.45 1167.09 58.85
2.6 Compressor output
Average Speed RPM 165365 158134 153932 149007 143623 136837 129566 122103 106678 94168 85240
Average Map Pressure
Ratio 2.35 2.33 2.27 2.20 2.12 2.01 1.90 1.79 1.59 1.45 1.37
Average Static Pressure
Ratio 2.38 2.36 2.29 2.22 2.13 2.02 1.91 1.79 1.59 1.45 1.37
Average Mass Flow
Rate lb/min 18.87 17.87 16.80 15.63 14.40 13.05 11.69 10.34 7.99 6.13 4.63
Average Efficiency % 73.93 74.11 74.59 75.07 75.34 75.11 74.38 73.63 71.85 70.14 68.71
Average Power kW 16.01 14.99 13.52 11.94 10.39 8.76 7.22 5.77 3.59 2.24 1.44
Average Reduced Speed RPM/K^0.5 9566.94 9149.18 8906.49 8621.89 8310.69 7918.30 7497.76 7066.00 6173.49 5449.43 4932.64
2.7 Turbine output
Average Speed RPM 165365 158134 153932 149007 143623 136837 129566 122103 106678 94168 85240
Average Map Pressure
Ratio 2.46 2.33 2.25 2.15 2.05 1.94 1.82 1.70 1.50 1.37 1.28
Average Static Pressure
Ratio 2.41 2.28 2.20 2.11 2.01 1.90 1.79 1.67 1.48 1.35 1.26
Average Reduced Mass Flow
(lbs/min)-R^0.5/psi 18.31 18.11 17.93 17.66 17.30 16.85 16.33 15.65 13.90 11.77 9.42
Wastegate Mass Flow
Rate lb/min 0.16 0.15 0.14 0.13 0.13 0.12 0.11 0.10 0.08 0.00 0.00
Wastegate Diameter mm 2.00 2.00 2.00 2.00 2.00 2.00 2.00 2.00 2.00 0.00 0.00
Average Blade Speed
Ratio 0.74 0.74 0.74 0.74 0.75 0.75 0.76 0.78 0.83 0.92 1.05
2.8 Cylinder performance
Engine Speed (end of
cycle) RPM 2200.00 2000.00 1900.00 1800.00 1700.00 1600.00 1500.00 1400.00 1200.00 1000.00 800.00
IMEP720 - Net Indicated
Mean Effective Pressure bar 14.90 15.39 15.37 15.22 14.95 14.48 13.89 13.20 11.83 10.66 9.69
IMEP360 - Gross Indicated Mean Effective Pressure
bar 16.36 16.48 16.29 15.96 15.52 14.90 14.18 13.38 11.84 10.57 9.55
PMEP - Pumping Mean
Effective Pressure bar -1.46 -1.09 -0.91 -0.74 -0.57 -0.42 -0.29 -0.18 -0.01 0.09 0.15
ISFC - Indicated Specific
Fuel Consumption g/kW-h 199.22 195.73 194.46 193.44 192.92 192.66 192.81 193.50 196.82 202.33 211.16
IMEP Adjusted (Shelby
definition) 16.38 16.50 16.31 15.98 15.54 14.92 14.20 13.40 11.86 10.59 9.57
PMEP Adjusted (Shelby
definition) bar -1.48 -1.11 -0.93 -0.76 -0.60 -0.44 -0.31 -0.20 -0.03 0.07 0.12
Intersection Pumping
Integral bar -1.24 -0.93 -0.78 -0.62 -0.48 -0.35 -0.23 -0.13 0.02 0.10 0.15
Intersection Gas
Exchange Efficiency fraction 0.92 0.94 0.95 0.96 0.97 0.98 0.98 0.99 1.00 1.01 1.02
2.9 Cylinder Energy
Indicated Efficiency % 42.03 42.77 43.05 43.28 43.40 43.45 43.42 43.27 42.54 41.38 39.65
Indicated Efficiency -
Gross (360) % 46.15 45.81 45.62 45.39 45.06 44.73 44.33 43.85 42.57 41.04 39.05
Fuel Energy Entering
Cylinder, Total J 3476.45 3527.87 3500.78 3447.27 3377.42 3266.89 3137.34 2991.65 2727.56 2525.34 2397.65
Heat Transfer, Average kW 11.99 11.39 10.97 10.48 10.12 9.52 8.89 8.26 7.19 6.18 5.31
Heat Transfer, % Total
2.10 Cylinder Pressure-Temperature
Pressure, Maximum bar 151.62 152.79 150.99 148.00 146.99 141.34 134.86 127.78 116.87 107.03 100.29
Crank Angle at
Maximum Pressure deg 7.09 7.06 7.09 7.20 6.92 6.82 6.90 6.85 6.53 6.49 6.29
Maximum Rate of
Pressure Rise bar/deg 5.52 5.58 5.52 5.42 5.43 5.22 4.99 4.72 4.37 3.99 3.73
Pressure, Cyl. Cycle-End bar 3.12 3.17 3.12 3.05 2.96 2.84 2.70 2.55 2.30 2.12 2.01
Pressure Change,
(Cycle-End to Cycle-(Cycle-End) fraction -- -- -- -- -- -- -- -- -- -- --
Temperature, Maximum K 1942.28 1935.66 1930.65 1924.60 1926.94 1918.23 1908.45 1897.11 1877.82 1844.77 1804.10
2.11 Cylinder Combustion
Combustion Start deg -13.50 -13.50 -13.50 -13.50 -14.20 -14.20 -14.20 -14.20 -14.80 -14.80 -14.80
Combustion Delay (0-2%) deg 1.83 1.82 1.82 1.82 1.82 1.82 1.83 1.83 1.84 1.84 1.84
Burned Fuel Fraction 1.00 1.00 1.00 1.00 1.00 1.00 1.00 1.00 1.00 1.00 1.00
Ignition Delay deg 4.81 4.80 4.80 4.81 4.10 4.11 4.11 4.11 3.51 3.51 3.51
2% Burned Crank Angle deg -11.67 -11.68 -11.68 -11.68 -12.38 -12.38 -12.37 -12.37 -12.96 -12.96 -12.96
50% Burned Crank
Angle deg 6.19 6.03 6.04 6.06 5.39 5.43 5.47 5.51 5.00 5.05 5.09
Burn Duration 10-75% deg 23.66 23.34 23.37 23.41 23.46 23.54 23.61 23.70 23.87 23.96 24.05
Burn Duration 10-90% deg 34.01 33.11 33.20 33.31 33.45 33.66 33.87 34.12 34.65 34.91 35.21
Burn Duration 0-50% deg 19.69 19.53 19.54 19.56 19.59 19.63 19.67 19.71 19.80 19.85 19.89
2.12 Cylinder flow
Volumetric Efficiency, All
Gases fraction 1.70 1.74 1.73 1.70 1.66 1.60 1.54 1.46 1.33 1.22 1.16
Air Flow Past Intake
Valves mg/cycle 1940.39 1993.85 1976.62 1944.08 1901.06 1835.39 1758.73 1672.84 1517.22 1401.33 1326.78
Trapping Ratio 1.00 0.99 0.99 0.99 0.99 0.99 1.00 1.00 1.00 1.00 1.00
EGR Percentage % 0.00 0.00 0.00 0.00 0.00 0.00 0.00 0.00 0.00 0.00 0.00
Fuel Consumption, Total mg/cycle 80.85 82.04 81.41 80.17 78.54 75.97 72.96 69.57 63.43 58.73 55.76
Fuel Injected Directly
Into Cylinder mg/cycle 80.85 82.04 81.41 80.17 78.54 75.97 72.96 69.57 63.43 58.73 55.76
Fuel Flow Past Intake
Valves mg/cycle 0.00 0.00 0.00 0.00 0.00 0.00 0.00 0.00 0.00 0.00 0.00
Fuel Flow Past Intake
2.13 Cylinder Composition
Total Mass Trapped at
Cyl. Cycle-Start mg 2034.86 2056.50 2037.51 2003.69 1960.91 1894.65 1817.38 1732.07 1580.03 1467.09 1396.75
Air Mass Trapped at Cyl.
Cycle-Start mg 1940.34 1969.04 1953.92 1924.05 1885.07 1823.37 1751.06 1669.74 1522.34 1409.47 1338.19
Burned Mass Frac at Cyl.
Cycle-Start (EGR+Resid) % 4.57 4.19 4.04 3.91 3.82 3.71 3.60 3.55 3.61 3.88 4.15
Burned Mass Frac at Cyl.
Cycle-Start (Lean Burn) % 2.82 2.58 2.49 2.41 2.35 2.29 2.22 2.19 2.22 2.39 2.56
Fuel Mass Trapped at
Cyl. Cycle-Start mg 0.00 0.00 0.00 0.00 0.00 0.00 0.00 0.00 0.00 0.00 0.00
Vapor Fuel Frac at Cyl.
Cycle-Start 0.00 0.00 0.00 0.00 0.00 0.00 0.00 0.00 0.00 0.00 0.00
Fuel/Air Ratio Trapped
at Cyl. Cycle-Start 0.00 0.00 0.00 0.00 0.00 0.00 0.00 0.00 0.00 0.00 0.00
Effective Lambda at Cyl.
Cycle-Start 37.49 40.95 42.46 43.83 45.04 46.30 47.74 48.42 47.72 44.35 41.55
Fuel/Air Ratio (Total
Fuel/Trapped Air) 0.04 0.04 0.04 0.04 0.04 0.04 0.04 0.04 0.04 0.04 0.04
Effective Fuel/Air Ratio
at EVO 0.04 0.04 0.04 0.04 0.04 0.04 0.04 0.04 0.04 0.04 0.04
Effective Lambda at EVO 1.67 1.67 1.67 1.67 1.67 1.67 1.67 1.67 1.67 1.67 1.67
NOx at EVO ppm 1272.65 1272.65 1272.66 1272.66 1272.65 1272.65 1272.64 1272.64 1272.63 1272.62 1272.61
Total Mass Trapped at
Cyl. Cycle-End mg 2035.51 2082.37 2061.09 2024.40 1977.42 1907.00 1825.04 1734.86 1574.39 1458.55 1385.01
Burned Mass Frac at Cyl.
Cycle-End (EGR+Resid) % 2.88 2.62 2.53 2.44 2.38 2.31 2.24 2.22 2.26 2.43 2.61
Fuel/Air Ratio Trapped
2.14 Engine performance
Engine Speed (cycle
average) RPM 2200.00 2000.00 1900.00 1800.00 1700.00 1600.00 1500.00 1400.00 1200.00 1000.00 800.00
Engine Speed (end of
cycle) RPM 2200.00 2000.00 1900.00 1800.00 1700.00 1600.00 1500.00 1400.00 1200.00 1000.00 800.00
BMEP - Brake Mean
Effective Pressure bar 13.02 13.66 13.68 13.57 13.33 12.91 12.38 11.75 10.49 9.43 8.57
IMEP720 - Net Indicated
Mean Effective Pressure bar 14.91 15.47 15.44 15.28 14.99 14.50 13.90 13.20 11.80 10.61 9.64
IMEP360 - bar 16.39 16.59 16.38 16.04 15.58 14.94 14.20 13.38 11.81 10.53 9.50
FMEP - Friction Mean
Effective Pressure bar 1.89 1.82 1.77 1.72 1.67 1.60 1.53 1.45 1.31 1.18 1.07
PMEP - Pumping Mean
Effective Pressure bar -1.48 -1.12 -0.94 -0.76 -0.59 -0.43 -0.30 -0.18 -0.01 0.09 0.15
BSFC - Brake Specific
Fuel Consumption g/kW-h 228.49 222.17 219.95 218.17 217.33 216.75 216.75 217.52 221.56 227.77 237.55
ISFC - Indicated Specific
Fuel Consumption g/kW-h 199.54 196.17 194.86 193.80 193.23 192.92 193.01 193.65 196.86 202.30 211.11
BSAC - Brake Specific
Air Consumption g/kW-h 5483.58 5354.05 5299.04 5254.26 5230.70 5213.55 5210.17 5224.60 5311.99 5456.06 5684.61
ISAC g/kW-h 4788.76 4727.53 4694.59 4667.26 4650.77 4640.34 4639.49 4651.16 4719.90 4846.12 5051.84
FMEP-PMEP bar 3.37 2.94 2.71 2.47 2.26 2.03 1.82 1.63 1.32 1.10 0.92
Shaft MEP bar 13.02 13.66 13.68 13.57 13.33 12.91 12.38 11.75 10.49 9.43 8.57
Attachment MEP bar 0.00 0.00 0.00 0.00 0.00 0.00 0.00 0.00 0.00 0.00 0.00
Crank Pin MEP bar 14.91 15.47 15.44 15.28 14.99 14.50 13.90 13.20 11.80 10.61 9.64
Average of Maximum
Cylinder Pressures bar 152.14 154.15 152.19 149.04 147.77 141.85 135.17 127.89 116.64 106.62 99.74
Percent Load % -100.00 -100.00 -100.00 -100.00 -100.00 -100.00 -100.00 -100.00 -100.00 -100.00 -100.00
FMEP - Cylinder (if
2.15 Engine Energy
Indicated Efficiency % 41.96 42.68 42.96 43.20 43.33 43.40 43.38 43.23 42.53 41.38 39.66
Indicated Efficiency -
Gross (360) % 46.12 45.76 45.57 45.34 45.03 44.70 44.31 43.84 42.57 41.04 39.05
Brake Efficiency % 36.64 37.68 38.06 38.37 38.52 38.63 38.63 38.49 37.79 36.76 35.24
Fuel Power kW 255.51 236.96 223.22 208.07 192.24 174.74 157.15 139.67 108.85 83.83 63.58
Fuel Power, Useful
Portion kW 255.51 236.96 223.22 208.07 192.24 174.74 157.15 139.67 108.85 83.83 63.58
In-Cylinder Heat
Transfer kW 48.13 45.91 44.16 42.17 40.67 38.20 35.65 33.06 28.72 24.65 21.14
Total Exhaust Energy
Percentage % 39.21 37.95 37.25 36.53 35.52 34.74 33.94 33.10 31.09 29.21 27.09
Useful Exhaust Energy
Percentage % 39.21 37.95 37.25 36.53 35.52 34.74 33.94 33.10 31.09 29.21 27.09
Exhaust Energy
2.16 Engine torque power
Brake Torque N-m 406.37 426.36 427.03 423.59 416.00 402.84 386.42 366.68 327.31 294.26 267.47
Indicated Torque N-m 465.34 482.86 482.01 476.87 467.88 452.60 433.95 411.88 368.37 331.29 300.97
Friction Torque N-m 59.01 56.83 55.28 53.54 52.09 49.92 47.63 45.24 40.99 36.93 33.36
Attachment Torque N-m 0.00 0.00 0.00 0.00 0.00 0.00 0.00 0.00 0.00 0.00 0.00
Crank Pin Torque N-m 465.34 482.86 482.01 476.87 467.88 452.60 433.95 411.88 368.37 331.29 300.97
Shaft Torque N-m 406.37 426.36 427.03 423.59 416.00 402.84 386.42 366.68 327.31 294.26 267.47
Brake Power (HP) HP 125.55 119.75 113.94 107.07 99.31 90.51 81.40 72.09 55.16 41.32 30.05
Brake Power (kW) kW 93.62 89.30 84.96 79.85 74.06 67.50 60.70 53.76 41.13 30.81 22.41
Indicated Power kW 107.21 101.13 95.90 89.89 83.29 75.83 68.16 60.39 46.29 34.69 25.21
Friction Power kW 13.60 11.90 11.00 10.09 9.27 8.36 7.48 6.63 5.15 3.87 2.79
Attachment Power kW 0.00 0.00 0.00 0.00 0.00 0.00 0.00 0.00 0.00 0.00 0.00
Crank Pin Power kW 107.21 101.13 95.90 89.89 83.29 75.83 68.16 60.39 46.29 34.69 25.21
2.17 Engine Flow
Volumetric Efficiency, All
Gases fraction 1.70 1.74 1.73 1.70 1.66 1.60 1.54 1.46 1.33 1.22 1.16
Air-Fuel Ratio (Inducted
Air/Total Fuel) 24.00 24.10 24.09 24.08 24.07 24.05 24.04 24.02 23.98 23.95 23.93
Air-Fuel Ratio (Trapped
Air/Total Fuel) 24.00 24.00 24.00 24.00 24.00 24.00 24.00 24.00 24.00 24.00 24.00
Percent Burned Mass at
2.18 Engine Emission
Brake Specific NOx
g/kW-h -- -- -- -- -- -- -- -- -- -- --
Brake Specific CO g/kW-h 0.01 0.01 0.01 0.01 0.01 0.01 0.01 0.01 0.01 0.01 0.02
Brake Specific CO2 g/kW-h 729.82 707.44 700.56 695.11 692.75 691.27 691.70 694.64 708.47 728.80 760.58
Brake Specific
Hydrocarbon g/kW-h 0.02 0.02 0.02 0.02 0.02 0.02 0.02 0.02 0.02 0.02 0.02
Brake Specific Soot g/kW-h 0.00 0.00 0.00 0.00 0.00 0.00 0.00 0.00 0.00 0.00 0.00
NOx Concentration
(ppm) ppm -- -- -- -- -- -- -- -- -- -- --
CO Concentration
(ppm) ppm 2.17 2.16 2.17 2.20 2.24 2.29 2.35 2.42 2.58 2.72 2.84
CO2 Concentration
(ppm) ppm 84212.20 83916.80 83937.10 83961.40 84006.50 84046.80 84094.30 84149.20 84181.90 84173.80 84163.80
Hydrocarbon
Concentration (ppm) ppm 0.61 0.61 0.60 0.60 0.61 0.60 0.61 0.61 0.61 0.60 0.60
Soot Concentration
ATTACHEMENT 3
3.5 Output value of power, SFOC and torque load 20%
GT 2052-3 (20%)
RPM POWER (kW) SFOC (g/kwh) TORQUE (Nm)
2200 19.59 1139.66 84.05
2000 18.99 1102.98 89.35
1900 18.34 1087.37 90.63
1800 17.61 1075.06 91.67
1700 16.77 1069.41 92.15
1600 15.81 1070.39 92.07
1500 14.38 1105.79 88.96
1400 12.79 1112.72 84.49
1200 9.70 1134.72 74.09
1000 7.24 1154.14 65.49
3.6 Compressor Output
Average Speed RPM 178662 172532 168254 163417 158095 152204 145363 137433 119800 104636 94225
Average Map Pressure Ratio 2.45 2.48 2.47 2.43 2.37 2.28 2.16 2.03 1.76 1.58 1.47
Average Static Pressure Ratio 2.48 2.51 2.50 2.45 2.39 2.30 2.18 2.04 1.77 1.58 1.47
Average Inlet Pressure bar 0.94 0.95 0.95 0.96 0.96 0.97 0.97 0.98 0.99 0.99 1.00
Average Outlet Pressure bar 2.34 2.38 2.37 2.35 2.30 2.22 2.12 1.99 1.75 1.57 1.46
Average Inlet Temperature K 297.08 297.23 297.34 297.47 297.61 297.76 297.91 298.05 298.27 298.40 298.49
Average Outlet Temperature K 437.36 431.31 426.54 421.06 415.31 409.08 401.18 392.15 373.13 359.53 350.53
Average Mass Flow Rate lb/min 19.60 18.66 17.91 16.96 15.82 14.54 13.10 11.60 8.81 6.63 4.95
Average Efficiency % 61.41 65.38 67.40 69.11 70.18 70.58 70.73 70.41 69.86 67.99 66.48
Average Power kW 21.13 19.22 17.78 16.10 14.30 12.43 10.39 8.39 5.06 3.11 1.98
Average Reduced Speed RPM/K^0.5 10336 9982 9735 9455 9148 8807 8412 7953 6933 6055 5453
Average Reduced Mass Flow (lbs/min)-R^0.5/psi 32.68 30.99 29.67 27.99 26.01 23.80 21.37 18.85 14.23 10.67 7.96
Rack Position 0.00 0.00 0.00 0.00 0.00 0.00 0.00 0.00 0.00 0.00 0.00
Average Corrected Speed RPM 178426 172313 168046 163222 157913 152035 145207 137290 119679 104530 94127
Average Corrected Mass Flow lb/min 20.43 19.37 18.54 17.49 16.25 14.87 13.35 11.78 8.89 6.67 4.98
3.7 Turbine output
Average Speed RPM 178662 172532 168254 163417 158095 152204 145363 137433 119800 104636 94225
Average Map Pressure Ratio 2.54 2.45 2.38 2.30 2.20 2.10 1.98 1.85 1.60 1.43 1.32
Average Static Pressure
Ratio 2.48 2.40 2.33 2.25 2.16 2.06 1.95 1.82 1.58 1.42 1.31
Average Reduced Speed RPM/K^0.5 5946.7
2
Average Reduced Mass Flow
3.8 Cylinder performance
Engine Speed (end of cycle) RPM 2200 2000 1900 1800 1700 1600 1500 1400 1200 1000 800
IMEP720 - Net Indicated Mean Effective Pressure bar 15.34 16.19 16.36 16.48 16.52 16.43 15.88 15.09 13.29 11.79 10.59
IMEP360 - Gross Indicated Mean Effective
Pressure bar 16.86 17.37 17.35 17.28 17.13 16.87 16.16 15.24 13.25 11.64 10.38
PMEP - Pumping Mean Effective Pressure bar -1.52 -1.18 -0.99 -0.80 -0.61 -0.44 -0.29 -0.15 0.04 0.15 0.21
ISFC - Indicated Specific Fuel Consumption
g/kW-h
Intersection Gas Exchange Efficiency fractio
n 0.92 0.94 0.95 0.96 0.97 0.98 0.99 0.99 1.01 1.01 1.02
3.9 Cylinder Energy
Indicated Efficiency % 42.02 42.92 43.37 43.69 43.80 43.81 43.84 43.73 43.03 41.90 40.17
Indicated Efficiency - Gross (360) % 46.19 46.05 45.99 45.81 45.43 44.99 44.63 44.17 42.90 41.36 39.36
Fuel Energy Entering Cylinder, Total J 3579.94 3698.00 3698.00 3698.00 3698.00 3677.36 3551.25 3383.09 3028.67 2758.92 2585.04
Fuel Energy (LHV) Multiplier 1.00 1.00 1.00 1.00 1.00 1.00 1.00 1.00 1.00 1.00 1.00
Heat Transfer, Average kW 12.28 11.80 11.38 11.00 10.82 10.44 9.79 9.08 7.79 6.61 5.62
Heat Transfer, % Total Fuel Energy % 18.72 19.14 19.44 19.83 20.66 21.30 22.07 23.00 25.71 28.73 32.60