30
CHAPTER IV
RESULT AND DISCUSSION
4.11. Introduction
The aim of this study is to find out the way to achieve the viability of using crumb rubber as the additive material in the hot asphalt concrete modified with a certain comparison is expected to improve the quality of the asphalt and to know the properties of asphalt added with crumb rubber.
In the comparison between the two types (without and with crumb rubber) of properties of the hot mix split mastic asphalt toward the Marshall properties (stability, flow, MQ, VITM, VFWA, and air void to get maximum asphalt contact, ISTM, and UCS at different test temperature 30 ITS at different test temperature of 30˚C, 40˚C,and 60 and permeability test.
The methodology used for this study has been discussed in chapter 3. The results of each procedure in determining the properties are presented in this chapter and will be further analyzed and discussed in depth.
4.12. Materials and Properties
The main materials used for this study were: asphalt AC 60/70 coarse aggregate (crushed stones), fine aggregate, and CR.
All main properties of the materials used were measured for further analysis consideration. Several tests were conducted in order to measure their properties according to the specifications referred. The reference used are AASHTO and Bina Marga standard.
4.12.1.Asphalt
31
Table 4.1. Result of properties test of asphalt AC 60/70
No Characteristics Result Specification
(Bina Marga |)
1 Specific gravity of asphalt 1.045 Min .1
2 Penetration (mm) 63.5 60-79
3 Ductility (cm) 164 Min. 100
4 Flash point and fire point © 320 -326 Min. 200
5 Softening point ( c ) 48.35 48 - 58
6 Asphalt solubility in TCE (tri chlore enthelyn )/CCL
99.59 MIN .99
4.12.2. Aggregate
The aggregate used as the materials for the split mastic asphalt mix. Based on the properties test of coarse aggregate and fine aggregate result as table
A. Properties of Aggregates
32
Figure 4.1 Gradation limit for asphalt concrete
Based on Figure 4.1, it can be concluded that the selected aggregate gradation used in this study can fulfil the graduation requirement specified by Bina Marga (2006). Similar with asphalt concrete, the aggregate materials are required to be tested to evaluate whether their properties fulfil the requirements or not. Several aggregate properties were measured in this study, such as specific gravity, abrasion, flakiness and elongation indices, and so on, to make sure that the aggregates used could be used in making the asphalt mixtures. The results of the aggregate tests are presented in the Tables 4.2 & Table 4.3.
Table 4.2. Properties of coarse aggregate
No Properties Result Specification
(Bina Marga) 1 Bulk specific gravity of coarse aggregate 2.64 ≥ 2.5 2 SSD specific gravity of coarse aggregate 2.67 ≥ 2.5 3 Apparent specific gravity of coarse aggregate 2.714 ≥ 2.5
4 Water absorption of coarse aggregate 1.02 ≤ 3
33 Table 4.3. Properties of fine aggregate
No Properties Result Fine
aggregate
Specification (Bina Marga) 7 Bulk specific gravity of fine aggregate 2.52 ≥ 2.5 2 SSD specific gravity of fine aggregate 2.59 ≥ 2.5
3 Apparent specific gravity of fine
aggregate 2.723 ≥ 2.5
4 Water absorption of fine aggregate 2.94 ≤ 3
4.13. Marshall Test of 60/70 Bitumen Mixture
Two types of Marshall Test are the materials for the asphalt concrete without crumb rubber, and asphalt concrete modified with crumb rubber. Marshall Test for the 60/70 (asphalt without crumb rubber) within the range 2.5%, 5.0%, 7.5% and 10% are used. The OBC in asphalt concrete without CR has been determined in this study based on the maximum stability according to the MS. Table 4.4 shows some properties of the 60/70 (asphalt without crumb rubber).
Table 4.4. Properties of asphalt concrete without crumb rubber (60/70)
No
Bitumen Content
(%)
Stabilities Kg
Flow
(mm) VFWA
Air
void MQ Density VMA
34
This relationship between the stability and the asphalt content is shown in Figure 4.2
Figure 4.2. Correlation stability and AC without CR toward asphalt content
Through the review of the stability test results in Table 4.4 and Figure 4.2 the following observations were obtained that the highest stability value of asphalt concrete without crumb rubber is asphalt content 6.0% by 1412.80 kg and the smallest stability is asphalt content 5.0% by 1035.33 and 7.0% by 1166.02 kg. Thus it can be concluded that the higher percent and smaller percent of the asphalt content decreases stability. Thus addition of asphalt content will give the higher penetration or softer. As a result, the mixture becomes more flaccid so as to contribute to the decrease in the value of stability.
y = -310,8x2 + 3780,1x - 10081 R² = 0,9763
400 600 800 1000 1200 1400 1600
4,5 5,0 5,5 6,0 6,5 7,0 7,5 8,0
Sta
bil
it
a
s
(k
g
)
35
This relationship between the flows and the asphalt content is shown in Figure 4.3
Figure 4.3. Correlation flows and AC without CR toward asphalt content
Through the review of the flow test results in Table 4.4 and Figure 4.3 the following observations were obtained that flow value of asphalt concrete without crumb rubber is 6% by 3.40 mm and smallest with asphalt content 5.0% by 2.8 mm, 5.5% by 3.22 mm, 6.5% by 3.17 mm, and 7% by 2.67 mm. Thus it can be concluded that the higher the asphalt content the more the flow will be. With the addition of the asphalt content will affect the mixes become more flexible and the resistance to deformation decreases resulting in a high flow value. But this value is considered very low compared to global standards as well as specifications Indonesian.
y = 0,0567x + 2,7567 R² = 0,0445
0,00 1,00 2,00 3,00 4,00 5,00
4,50 5,00 5,50 6,00 6,50 7,00 7,50 8,00
F
lo
w
(
m
m
)
Asphalt Content % min 3
36
This relationship between the Marshall quotients and asphalt content is shown in Figure 4.4.
Figure 4.4. Correlation MQ and AC without CR toward asphalt content
Through the review of the marshal quotient test result in Table 4.4 and Figure 4.4 were obtained the following observations that the marshal quotient value of asphalt concrete without crumb rubber is highest with asphalt content 6.0% by 423.06 kg/mm and is smallest with asphalt content 5% by 369.85 kg/mm. Thus it can be concluded that the higher the asphalt content decreases marshal quotient.
Marshall Quotient also known as rigidity ratio, which is the ratio of stability to flow value of the mixture and the Marshall Quotient values of AC. So the increase in the flow value will decrease the Marshall Quotient value.
37
This relationship between the air void and the asphalt content is shown in Figure 4.5
Figure 4.5. Correlation air void and AC without CR toward asphalt content
Through the review of the air void test results in Table 4.4 and Figure 4.5 the following observations were obtained that the air void value of asphalt concrete without crumb rubber is highest with asphalt content 5.0% by 6.91 and smallest with asphalt content 7.0% by 3.73. Thus it can be concluded that the higher the asphalt content decreases air void.
Excessive air voids in the mixture would result in cracking due to insufficient bitumen binders to coat on the aggregates, while too low air void may induce more plastic flow (rutting) and bitumen bleeding.
y = -1,5694x + 14,822 R² = 0,9915
0,00 1,00 2,00 3,00 4,00 5,00 6,00 7,00 8,00
4,5 5,0 5,5 6,0 6,5 7,0 7,5
a
ir
v
o
ld
(%)
Asphalt Content (%)
38
This relationship between the VFWA and the asphalt content is shown in Figure 4.6
Figure 4.6. Correlation VFWA and AC without CR toward asphalt content
Through the review of the VFWA test results in Table 4.4 and Figure 4.6 were obtained the following observations that the VFWA value of asphalt concrete without crumb rubber is highest with asphalt content 7.0% by 80.60% and is smaller with asphalt content 5.0% by 61.44%. Thus it can be concluded that the higher the asphalt content increases void filled with asphalt. This is due to the addition of asphalt content, and then the value of void filled with asphalt increases.
y = 9,4683x + 14,22 R² = 0,9959
40,00 45,00 50,00 55,00 60,00 65,00 70,00 75,00 80,00 85,00 90,00
4,5 5,0 5,5 6,0 6,5 7,0 7,5
VF
WA
(%)
Asphalt Content (%)
VFWA
Series5
39
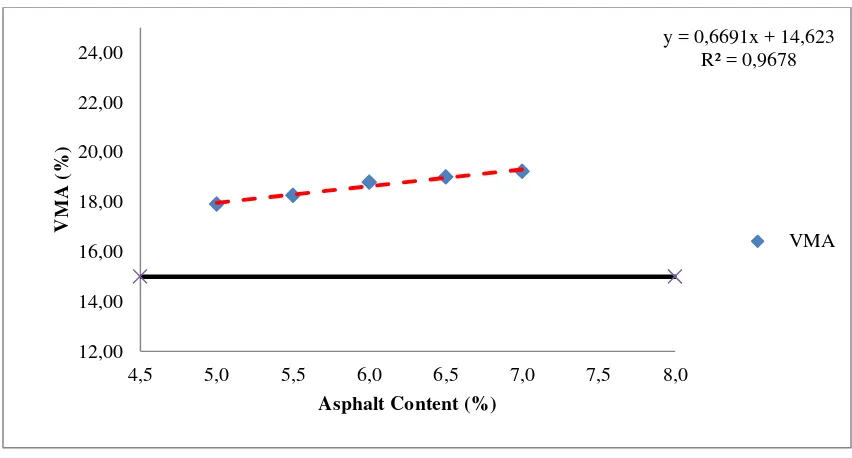
This relationship between the VMA and the asphalt content is shown in Figure 4.7
Figure 4.7. Correlation VMA and AC without CR toward asphalt content
Through the review of the VMA test results in Table 4.4. and Figure 4.7. the following observations were obtained that the VMA value of asphalt concrete without crumb rubber is highest with asphalt content 7.0% by 19.22% and is smaller with asphalt content 5.0% by 17.92%. Thus it can be concluded that the higher the asphalt content increases Void in total mix. With the addition of asphalt content will decrease the volume of intergranular void space between the aggregate particles of a compacted paving mixture. It included the air voids and the volume of bitumen not absorbed into the aggregate.
Thus it concluded When VMA is too low, there is not enough room is the mixture to add sufficient bitumen binder to coat adequately over the individual aggregate particles. Also mixes with a low VMA are more sensitive to small changes in bitumen binder content. Excessive VMA will cause unacceptably low mixture stability.
y = 0,6691x + 14,623 R² = 0,9678
12,00 14,00 16,00 18,00 20,00 22,00 24,00
4,5 5,0 5,5 6,0 6,5 7,0 7,5 8,0
VM
A
(%)
Asphalt Content (%)
40
Figure 4.8. Correlation Marshall Properties toward % bitumen
Through the review of the Marshall Properties test results in Table 4.4. the following observations were obtained that the OBC in the asphalt concrete without crumb rubber is 6.4% bitumen, that is shows in figure 4.8
4.14.The Influence of CR Additive on The Properties of AC.
Marshall Test was done for the asphalt concrete with crumb rubber within the range given 2.5%, 5.0%, 7.5%, and 10%. The OBC has been determined in the study based on the maximum stability according to the MS.
0 10 20 30 40 50 60 70
4,5 5 5,5 6 6,5 7 7,5 8
Asphalt Content (%) Stabilitas
Flow
M/Q
VMA
41
4.14.1.Properties of Asphalt Concrete With 2.5% Crumb Rubber.
Table 4.5. shows some properties of asphalt concrete modified with crumb rubber 2.5%.
Table 4.5: Properties of asphalt concrete with 2.5% crumb rubber (60/70) Asphalt
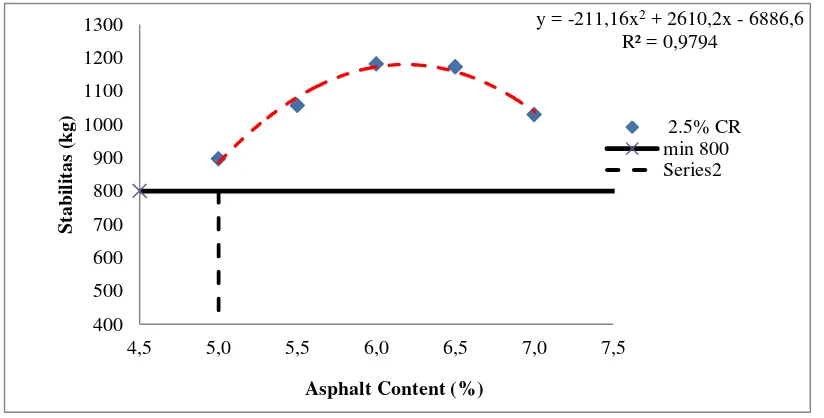
This relationship between the stability and the asphalt content with CR 2.5% is shown in Figure 4.9.
Figure 4.9. Correlation stability and AC with 2.5% CR toward asphalt content
Through the review of the stability test results in Table 4.5 and Figure 4.9 the following observations were obtained that the stability value of asphalt concrete with crumb rubber is highest with asphalt content 6.5% by 1181.26 kg and is smallest with asphalt content 5.0% by 896.78 with add the 2.5% crumb rubber effect at the cohesion and the bonding stability of modified bitumen decrease. So the stability value of asphalt
42
concrete modified without crumb rubber is higher than asphalt concert with crumb rubber, but the stability increases along with the increase of CR content up to a certain extent (optimum) and decreases after it passes the optimum limit. This happens because the asphalt as the binding material between the aggregate can become a lubricant after the optimum limit as the binding.
This relationship between the flows and the asphalt content is shown in Figure 4.10
Figure 4.10. Correlation flows and AC with 2.5% CR toward asphalt content
Through the review of the flow test results in Table 4.5. and Figure 4.10 were obtained the following observations that flow value of asphalt concrete with crumb rubber 2.5% is highest with asphalt content 6.0% by 3.80 mm and smallest with asphalt content 7.0% by 2.8 mm. Thus it can be concluded that the higher the asphalt content increases flow. With the addition of the asphalt content will affect the mixes become less flexible and the resistance to deformation decreases resulting in a high flow value.
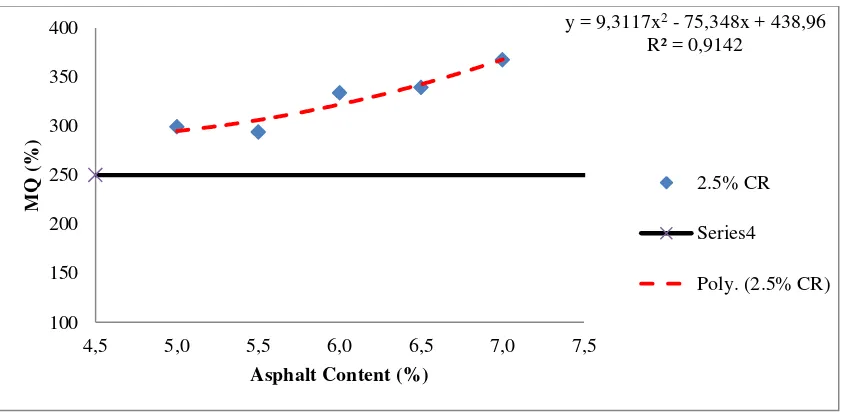
This relationship between the Marshall quotients and the asphalt content with CR 2.5% is shown in Figure 4.11.
y = -0,7429x2 + 8,8076x - 22,445 R² = 0,9684
0,00 1,00 2,00 3,00 4,00 5,00
4,5 5,0 5,5 6,0 6,5 7,0 7,5 8,0
F
lo
w
(
m
m
)
Asphalt Contnet (%)
2.5 CR
min 3
43
Figure 4.11. Correlation MQ and AC with 2.5% CR toward asphalt content
Through the review of the Marshall quotient test results in Table 4.5. and Figure 4.11. the following observations were obtained that Marshall quotient value of asphalt concrete with crumb rubber 2.5% is highest with the 7.0% by 367.41 mm and smallest with asphalt content 5.0% by 299.28 mm. Thus it can be concluded that the 2.5% CR with % bitumen increases Marshall Quotient.
This Figure 4.12 relationship between the air void and the asphalt content with CR 2.5% is shown in
44
Through the review of the air void test results in Table 4.5. and Figure 4.12. the following observations were obtained that air void value of asphalt concrete with crumb rubber 2.5% is highest with the 5.0% by 7.37% and smallest with asphalt content 7.0% by 3.23%, 6.5% by 4.79%, 6.0% by 5.32%, and 5.5% by 5.77%. Thus it can be concluded that the 2.5% CR with % bitumen decreases air void.
This relationship between the VMA and the asphalt content with CR 2.5% is shown in Figure 4.13
Figure 4.13. Correlation VFWA and AC with 2.5% CR toward asphalt content
Through the review of the VITM test results in Table 4.4 and Figure 4.13 the following observations were obtained that VITM value of asphalt concrete with crumb rubber 2.5% CR is highest with the 7.0% by 82.82% and smallest with asphalt content 5.0% by 59.96 %, 5.5% by 67.97%, 6.0% by 71.41%, and 6.5% by 74.99%. Thus it can be concluded that the 2.5% CR with % bitumen increases VITM.
y = 10,546x + 8,1535 R² = 0,9728
50,00 55,00 60,00 65,00 70,00 75,00 80,00 85,00 90,00
4,5 5,0 5,5 6,0 6,5 7,0 7,5 8,0
VF
WA
(%)
Asphalt Content (%)
2.5% CR min 65 Series3
45
This relationship between the VMA and the asphalt content is shown in Figure (4.14)
Figure 4.14. Correlation VMA and AC with 2.5% CR toward asphalt content
Through the review of the VMA results in Table 4.5 and Figure 4.14 the following observations were obtained that VMA value of asphalt concrete with crumb rubber 2.5% CR is highest with the 6.5% by 19.12% and smallest with asphalt content 5.5% by 17.94%, 6.5% by 4.79%, 6.0% by 5.32%, and 5.5% by 5.77%. Thus it can be concluded that the 2.5% CR with % bitumen decreases air void.
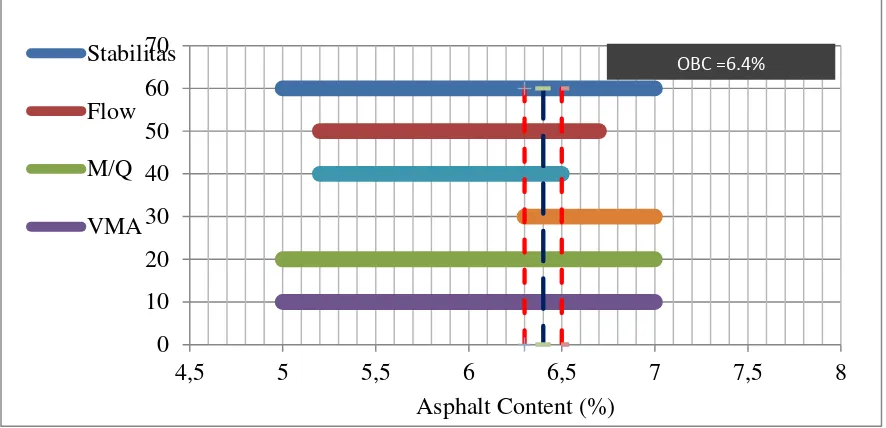
Figure 4.15. Correlation Marshall Properties toward 2.5% CR
y = 0,43x + 15,973
46
Table 4.5 shows some properties of asphalt concrete modified with crumb rubber 2.5%.
Through the review of the Marshall Properties test results in Table 4.4 were obtained the following observations that the OBC when added crumb rubber 2.5% is 6.475% bitumen, that is shown in Figure 4.15
4.14.2. Properties of Asphalt Concrete With 5.0% Crumb Rubber.
Table 4.6. Properties of asphalt concrete with 5.0% crumb rubber (60/70) Asphalt
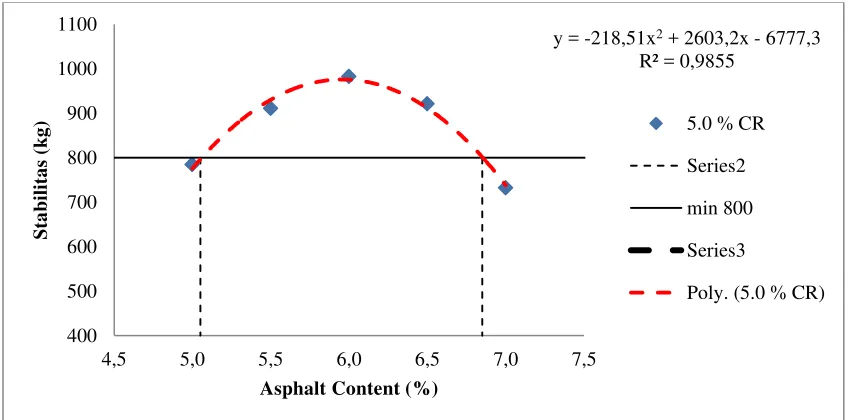
This relationship between the stability and the asphalt content with CR 5.0% is shown in Figure 4.16
47
Through the review of the stability test results in Table 4.5 and Figure 4.16 were obtained the following observations that the stability value of asphalt concrete with crumb rubber 5.0% is highest with asphalt content 6.0% by 982.68 kg and is smallest with asphalt content 7.0% by 732.02 with add the 2.5% crumb rubber effect at the cohesion and the bonding stability of modified bitumen decrease. So the stability value of asphalt concrete modified without crumb rubber is higher than asphalt concert with
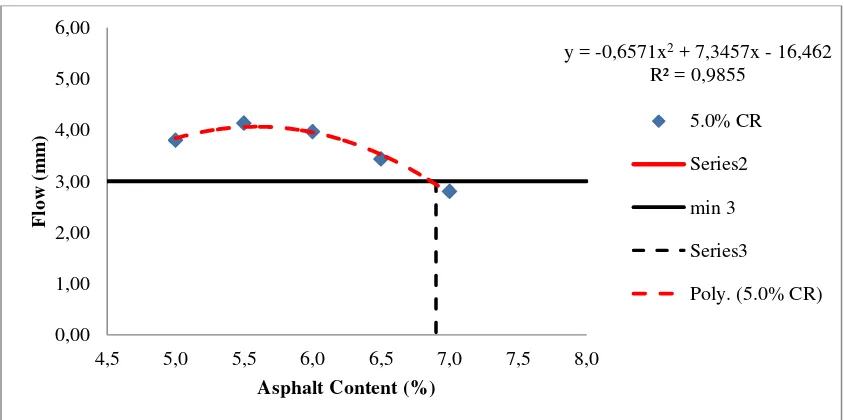
This relationship between the flows and the asphalt content is shown in Figure 4.17.
Figure 4.17. Correlation flows and AC with 5.0% CR toward asphalt content
48
increases flow. With the addition of the asphalt content will affect the mixes become less flexible and the resistance to deformation decreases resulting in a high flow value.
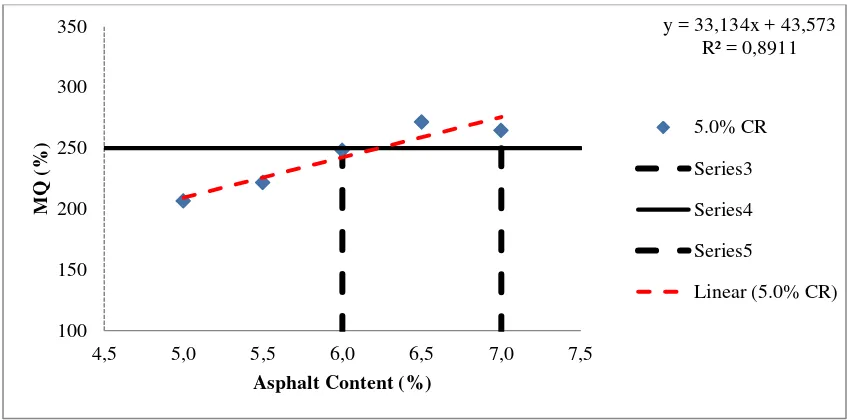
This relationship between the marshal quotients and the asphalt content with CR 5.0% is shown in Figure 4.18
Figure 4.18. Correlation MQ and AC with 5.0% CR toward asphalt content
Through the review of the Marshall quotient test results in Table 4.6 and Figure 4.18 were obtained the following observations that Marshall Quotient value of asphalt concrete with crumb rubber 5.0% is highest with the 6.5% by 256.75 mm and smallest with asphalt content 5.0% by 195.81 mm. Thus it can be concluded that the 5.0% CR with % bitumen increases Marshall Quotient.
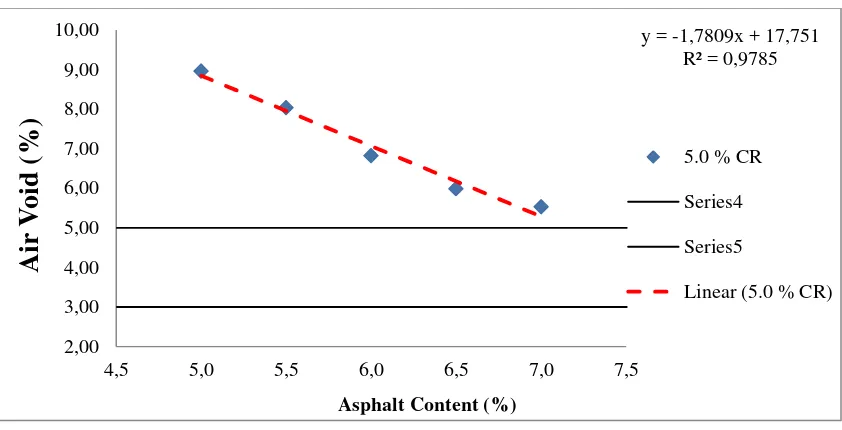
This relationship between the air void and the asphalt content with CR 5.0 % is shown in figure 4.19
y = 33,134x + 43,573 R² = 0,8911
100 150 200 250 300 350
4,5 5,0 5,5 6,0 6,5 7,0 7,5
M
Q
(
%)
Asphalt Content (%)
5.0% CR Series3 Series4 Series5
49
Figure 4.19. Correlation Air Void and AC with 5.0% CR toward asphalt content
Through the review of the air void test results in Table 4.6 and Figure 4.19 were obtained the following observations that air void value of asphalt concrete with crumb rubber 5.0% is highest with the 5.0% by 8.96% and smallest with asphalt content 7.0% by 5.53%. Thus it can be concluded that the 5.0% CR with % bitumen decreases air void.
This relationship between the VFWA and the asphalt content is shown in Figure 4.20 F
: Correlation VFWA and AC with 5.0% CR toward asphalt content
50
rubber 5.0% is highest with the 7.0% by 73.37% and smallest with asphalt content 5.0% by 54.60%. Thus it can be concluded that the 5.0% CR with % bitumen increases VFWA.
This relationship between the VMA and the asphalt content with CR 5.0% is shown in figure 4.21
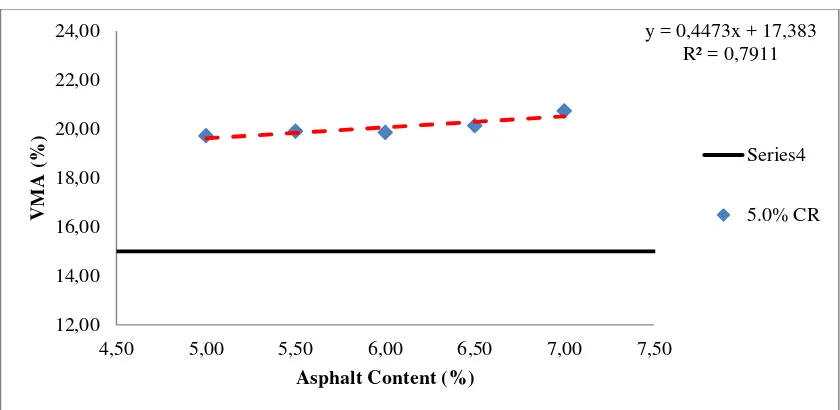
Figure 4.21. Correlation VMA and AC with 5.0% CR toward asphalt content
Through the review of the VMA results in Table 4.5 and Figure 4.21 were obtained the following observations that VMA value of asphalt concrete with crumb rubber 5.0% is highest with the 7.0% by 20.73% and smallest with asphalt content 5.0% by 19.72%. Thus it can be concluded that the 5.0% CR with % bitumen increases void mine aggregate.
y = 0,4473x + 17,383 R² = 0,7911
12,00 14,00 16,00 18,00 20,00 22,00 24,00
4,50 5,00 5,50 6,00 6,50 7,00 7,50
VM
A
(%)
Asphalt Content (%)
Series4
51
Figure 4.22. Correlation Marshall Properties toward 5.0% CR
Through the review of the Marshall Properties test results in Table 4.6 were obtained the following observations that the optimum bitumen content when added crumb rubber 5.0% is 6.45% bitumen, that is shows in Figure 4.22
4.14.3.Properties of Asphalt Concrete With 5.0% Crumb Rubber.
Table shows some properties of asphalt concrete modified with crumb rubber 5.0%.
Table 4.7. Properties of asphalt concrete with 7.5% crumb rubber (60/70) Asphalt
52
This relationship between the stability and the asphalt content with CR 7.5% is shown in Figure 4.23.
Figure 4.23. Correlation stability and AC with 7.5% CR toward asphalt content
53
This relationship between the flows and the asphalt content is shown in Figure 4.24.
Figure 4.24. Correlation flows and AC with 7.5% CR toward asphalt content
Through the review of the flow test results in Table 4.7 and Figure 4.24 the following observations were obtained that flow value of asphalt concrete with crumb rubber 7.5% is highest with asphalt content 6.0% by 5.17 mm and smallest with asphalt content 7.0% by 3.73 mm. Thus it can be concluded that the higher the asphalt content increases flow. With the addition of the asphalt content will affect the mixes become less flexible and the resistance to deformation decreases resulting in a high flow value.
This relationship between the marshal quotients and the asphalt content with CR 7.5% is shown in Figure 4.25.
y = -1,0133x2 + 11,869x - 29,693
4,50 5,00 5,50 6,00 6,50 7,00 7,50
F
4,50 5,00 5,50 6,00 6,50 7,00 7,50
54
Figure 4.25. Correlation MQ and AC with 7.5% CR toward asphalt content
Through the review of the MQ test results in Table 4.7 and Figure 4.25 the following observations were obtained that MQ value of asphalt concrete with crumb rubber 7.5% is highest with the 7.0% by 216.92 mm and smallest with asphalt content 5.0% by 171.20 mm. Thus it can be concluded that the 7.5% CR with % bitumen increases MQ.
This relationship between the air void and the asphalt content with CR 7.5% is shown in Figure 4.26.
Figure 4.26. Correlation Air Voids and AC with 7.5% CR toward asphalt content
Through the review of the air voids test results in Table 4.7 and Figure 4.26 the following observations were obtained that air void value of asphalt concrete with crumb rubber 7.5% is highest with the 5.0% by 7.78% and smallest with asphalt content 7.0% by 1.18%. Thus it can be concluded that the 7.5% CR with % bitumen decreases air void.
This relationship between the VFWA and the asphalt content with crumb rubber 7.5% is shown in Figure 4.27
55
Figure 4.27. Correlation VFWA and AC with 7.5% CR toward asphalt content
Through the review of the VMA results in Table 4.7 and Figure 4.28 the following observations were obtained that VMA value of asphalt concrete with crumb rubber 7.5% is highest with the 5.5% by 18.82% and smallest with asphalt content 7.0% by 17.08%. Thus it can be concluded that the 7.5% CR with % bitumen increases VMA..
This relationship between the VMA and the asphalt content with CR 7.5% is shown in Figure 4.28.
Figure 4.28. Correlation VMA and AC with 7.5% CR toward asphalt content y = 17,037x - 28,964
4,50 5,00 5,50 6,00 6,50 7,00 7,50
56
Through the review of the VMA results in Table 4.7 and Figure 4.28 the following observations were obtained that VMA value of asphalt concrete with crumb rubber 7.5% is highest with the 5.5% by 20.73% and smallest with asphalt content 17.08% by 19.72%. Thus it can be concluded that the 7.5% CR with % bitumen increases VMA.
Figure 4.29. Correlation Marshall Properties toward 7.5% CR
Through the review of the Marshall Properties test results in Table 4.7 the following observations were obtained that the OBC when added crumb rubber 7.5% is 6.375% bitumen, that is shows in Figure 4.29
4.14.4. Properties of Asphalt Concrete With 10% Crumb Rubber.
Table 4.8. Properties of asphalt concrete with 10 % crumb rubber (60/70) Asphalt
57
This relationship between the stability and the AC with CR 10% is shown in Figure 4.30
Figure 4.30. Correlation stability and AC with 10% CR toward asphalt content
Through the review of the stability test results in Table 4.8 and Figure 4.30 the following observations were obtained that the stability value of asphalt concrete with crumb rubber 10% is highest with asphalt content 6.0% by 774.43 kg and is smallest with asphalt content 5.0% by 649.58 with by adding the 10% crumb rubber effect at the cohesion and the bonding stability of modified bitumen decrease. So the stability value of asphalt concrete modified without crumb rubber is higher than asphalt concert with crumb rubber, and the stability value of asphalt concrete modified with crumb rubber 7.5 % is higher than asphalt concert with crumb rubber 10 % but the stability increases along with the decrease of CR content up to a certain extent (optimum) and decreases after it passes the optimum limit. This happens because the asphalt as the binding material between the aggregate can become a lubricant after the optimum limit as the binding.
y = -154,27x2 + 1878,1x - 4969,4
4,50 5,00 5,50 6,00 6,50 7,00 7,50 8,00
58
This relationship between the flows and the asphalt content is shown in Figure 4.31
Figure 4.31. Correlation Flows and AC with 10% CR toward asphalt content
Through the review of the flow test results in Table 4.8 and Figure 4.31 the following observations were obtained that flow value of asphalt concrete with crumb rubber 10 % is highest with asphalt content 7.0 % by 6.13 mm and smallest with asphalt content 5.0% by 5.03 mm. Thus it can be concluded that the higher the asphalt content increases flow. With the addition of the asphalt content will affect the mixes become less flexible and the resistance to deformation decreases resulting in a high flow value.
This relationship between the marshal quotients and the asphalt content with CR 10% is shown in Figure 4.32.
y = -0,8362x2 + 9,8276x - 23,509 R² = 0,9744
0,00 1,00 2,00 3,00 4,00 5,00 6,00 7,00 8,00
4,5 5,0 5,5 6,0 6,5 7,0 7,5 8,0
F
lo
w
(
m
m
)
asphalt content(%)
59
Figure 4.32. Correlation MQ and AC with 10% CR toward asphalt content
Through the review of the MQ test results in Table 4.8. and Figure 4.32. were obtained the following observations that Marshall Quotient value of asphalt concrete with crumb rubber 10 % is highest with the5.5 % by 154.23 mm and smallest with asphalt content 7.0% by 107.05 mm. Thus it can be concluded that the 10% CR with % bitumen decreases Marshall Quotient.
This relationship between the air voids and the asphalt content with CR 10% is shown in Figure 4.33.
Figure 4.33. Correlation Air Voids and AC with 10% CR toward asphalt content y = 11,2x + 68,763
4,50 5,00 5,50 6,00 6,50 7,00 7,50 8,00
60
Through the review of the air void test results in Table 4.8 and Figure 4.33 the following observations were obtained that air void value of asphalt concrete with crumb rubber 10% is highest with the 5.0% by 7.78% and smallest with asphalt content 7.0% by 1.18%. Thus it can be concluded that the 10 % CR with % bitumen decreases air void.
This relationship between the VFWA and the asphalt content with crumb rubber 10 % is shown in Figure 4.34.
Figure 4.34. correlation VFWA and AC with 10% CR toward asphalt content
Through the review of the VFWA results in Table 4.8. and Figure 4.34. the following observations were obtained that VFWA value of asphalt concrete with crumb rubber 10% is highest with the 7.0% by 56.94% and smallest with asphalt content 5.0% by 46.82%. Thus it can be concluded that the 10% CR with % bitumen increases VFWA.
61
Figure 4.35. Correlation VMA and AC with 10% CR toward asphalt content
Through the review of the VMA results in Table 4.8. and Figure 4.35. the following observations were obtained that VMA value of asphalt concrete with crumb rubber 10% is highest with the 7.0% by 25.34% and smallest with asphalt content 5.0% by 22.26%. Thus it can be concluded that the 10% CR with % bitumen increases void mine aggregate.
4.15. Comparison of Marshall Test
Table.4.9. Comparison of Stability of AC modified with and without crumb rubber
62
Figure 4.36. Comparison of Stability test for AC with and without CR
A. Stability Test
Through the comparison of the stability test results in Table 4.9 and Figure 4.36 it was obtained that the asphalt concrete without crumb rubber with asphalt content 6% has optimum stability value of 1412.80 kg. On the other hand, AC modified with 2.5% CR has optimum stability value of 1181.26 kg at 6.0% asphalt content; AC modified with 5% CR has optimum stability value of 962.0 kg at 6.5% asphalt content. AC modified with 7.5% CR has optimum stability value of 901.33 kg at 6.0% asphalt content. AC modified with 10% CR has optimum stability value of 769.38 kg at 5.5% asphalt content. Thus it can be concluded that the higher crumb rubber percent decreases stability. Further injection of crumb rubber into the mixture led to a decrease in the value of stability because application of excessive crumb rubber decreases the coarse aggregate contact point within the mixture. The addition of crumb rubber will give higher penetration or softer asphalt. As a result, the mixture becomes more flaccid so as to contribute to the decrease in the value of stability. Low stability suggests low quality of aggregates. The stability of aggregates decreases with an increase in crumb rubber content (Mashaan et al.
2013). It was found that increasing the crumb rubber reduces the stability of AC, with higher percent of crumb rubber yielding in lowest stability value. However, Al-Qadi et al.
0,00 200,00 400,00 600,00 800,00 1000,00 1200,00 1400,00 1600,00
1 2 3 4 5
S
tabi
li
ty
K
g
Asphalt Content %
0% 2.5 5% 7.5 10%
63
(2009) reported that crumb rubber has more effect on performance of asphalt mixture by increasing the Marshal Stability and Flow.
Table.4.10. Comparison of Flow of AC modified with and without crumb rubber
Asphalt
Figure 4.37. Comparison of flow test for AC with 0, 2.5, 5.0, 7.5 and 10% CR
B. Flow
Through the comparison of the Flows test results in Table 4.10 Figure 4.37 it was found that flow test value of asphalt concrete increased as the crumb rubber content increased from 0% to 7%. Higher flow values may be related to the increase of air voids (more compaction required) by using more CRM in the mixture, which leads to a more flexible mixture.
flow 0%CR flow 2.5%CR flow5.0%CR flow 7.5% CR flow 10% CR
Mix 4
64
Thus it can be concluded that the higher the crumb rubber content increased flow but higher asphalt content decreases flow. With the addition of the asphalt content the mixes become more flexible and the resistance to deformation decreases resulting in a high flow value. Mashaan et al. (2013) similarly reported that the addition of crumb rubber modifier to asphalt concrete increases the flow of the mixture until optimum crumb rubber content is reached.
C. Void Filled With Asphalt (VFWA)
The analysis of the VFWA test results in Figure 4.38 showed that modified with 0%, 2.5%, 5.0%, 7.5% and 10% CR have maximum VFWA values of 80.60, 82.82, 73.37, 93.10, and 56.94, respectively. Thus it can be concluded that increase in percent of crumb rubber content increases the VFWA. The reason is that voids provide spaces for the movement of the asphalt cement or asphalt rubber binder within the compacted mix. Mix design of asphalt and rubberized AC asphalt paving mixes is a trade-off between high binder content to enhance long term durability and performance, and sufficient in-place void space to avoid rutting, instability, flushing and bleeding, as it is clearly shown in Table 4.11 the VFWA.
Table 4.11. Comparison of VFWA of AC modified with and without crumb rubber
Asphalt Content
VFWA 0%CR
VFWA 2.5%CR
VFWA 5.0%CR
VFWA 7.5% CR
VFWA 10% CR
5.00 61.44 59.96 54.60 58.44 46.82
5.50 66.89 67.97 59.63 64.05 49.94
6.00 70.31 71.41 65.84 70.79 56.41
6.50 75.92 74.99 70.68 79.92 57.26
65
Figure 4.38. Comparison of VFWE test for AC with and without CR
D. Voids In Mix (VIM) Test
Through the comparison of the Voids In Mix test results in Table 4.12. Figure 4.39. it was found that the Voids in Mix value of asphalt concrete without crumb rubbers is 6.91. at asphalt content of 5%, while AC modified with 2.5%, 5.0%, 7.5%, and 10% CR have maximum Voids In Mix value of 7.37, 8.96, 7.78 and 11.84, respectively asphalt content 5%. Thus it can be concluded that higher crumb rubber and asphalt content increase Voids in Mix. This is supported by Ibrahim et al. (2014) which found that crumb rubber particle size can affect the optimum binder content for open graded friction course. The durability of HMA is a function of the VIM or porosity. In general, the higher the porosity, the less permeable will be the mixture and vice versa. Too much voids in the mix (high porosity) will provide passageways through the mix for the entrance of damaging air and water. Too low porosity could lead to flushing where the excess bitumen squeezes out of the mix to the surface. However, Al-Qadi et al., (2009)
5,00 15,00 25,00 35,00 45,00 55,00 65,00 75,00 85,00 95,00
1 2 3 4 5
VF
M
A
(%)
66
Table.4.12. Comparison of VIM of AC modified with and without crumb rubber
Asphalt
This relationship between VIM of the asphalt concrete AC and asphalt concrete modified with crumb rubber is shown in figure 4.39.
Figure 4.39. Comparison of VIM test for AC with and without CR
4.16.
Indirect Tensile Strength Test (ITS)
The strength test was used to determine tensile strength and strain of the mixture specimens. Specimens were monotonically loaded to failure along the vertical diametric axis at the constant rate of 3 in/min (76.2 mm/min)
The indirect tensile strength test is one type of tensile strength test used for stabilized materials. This test involves loading a cylindrical specimen with a compressive
y = -0,1963x2 + 0,7868x + 7,8518
4,50 5,00 5,50 6,00 6,50 7,00 7,50
67
load along two opposite generators. This results in a relatively uniform tensile stress acting perpendicular to and along the demurral plan of the applied load this result in splitting failure generally occurring along the diametric plans three samples for each type of asphalt concrete without and with CR were tested at temperatures 30˚C, 40˚C and 60˚C.
Figure 4.40. and Table 4.13. shows the summarized result of indirect tensile strength test each type of asphalt concrete without and with crumb rubber in OBC.
Calculate the tensile strength of the compacted bituminous mixture:
(4.1)
Where:
ITS: is Indirect tensile strength, psi
F: is Total applied vertical load at failure, lb
F = 2708.14 KN
h: is Height of specimen, in = 63.37mm d: is Diameter of specimen, = 100 mm
= 272 MP/mm²
ITS = 272 MP/mm²
Table 4.13. Comparison of indirect tensile strength test at OBC
AC type OBC ITS @30 C
(MPa)
ITS @ 40C (MPa)
ITS @ 60C (MPa)
without CR 6.4 242.23 117.81 42.40
with CR 2.5% 6.475 144.45 76.03 17.31
with CR 5.0% 6.45 129.10 52.84 10.95
with CR 7.5% 6.375 100.21 43.55 9.89
68
Figure 4.40. Results of ITS each and asphalt concrete modified without and with CR
Through review of the results of ITS test in Table 4.9 and Figure 4.40. the observations were obtained as the following
1. At Temperature 30
The ITS value of asphalt concrete without crumb rubber is higher than asphalt concrete modified without crumb rubber by 242.23MPa and asphalt concrete with 2.5% CR is higher than asphalt concrete with 5.0% by 144.45MPa, and asphalt concrete with 5.0% CR is higher than asphalt concrete with 7.5% CR by 129.10MPa. The least ITS value at a temperature 30˚C was obtained for AC modified with 7.5% CR by 100.21MPa. Thus it can be concluded that asphalt concrete with crumb rubber is more sensitive to temperature changes by using ITS test compared with asphalt concrete without crumb rubber.
2. At Temperature 40
69
temperature changes by using ITS test compared with asphalt concrete without crumb rubber.
3. At Temperature 60
The ITS value of asphalt concrete without crumb rubber is higher than asphalt concrete modified without crumb rubber by 42.4 MPa and asphalt concrete with 2.5% CR is higher than asphalt concrete with 5.0% by 17.31 MPa, and asphalt concrete with 5.0% CR is higher than asphalt concrete with 7.5% CR by 10.95 MPa. The least ITS value at a temperature 30˚C was obtained for AC modified with 7.5% CR by 9.89 MPa. Thus it can be concluded that asphalt concrete with crumb rubber is more sensitive to temperature changes by using ITS test compared with asphalt concrete without crumb rubber.
Through the above observation for asphalt concrete mixtures that is stronger than the asphalt mixture with crumb rubber, and asphalt concrete modified with 2.5% crumb rubber is stronger than the asphalt concrete modified with 5.0% and 7.5% crumb rubber. There are a lot of filler composition of the asphalt so it can fill cavities in the asphalt mix aggregate and asphalt than surrounds thicker than using asphalt without crumb rubber. The asphalt concrete modified with crumb rubber is more sensitive to temperature changes by using ITS test compared with asphalt concrete without crumb rubber.
4.17. Unconfined Compressive Strength Test (UCS)
70
Table.4.14. Comparison of Unconfined compressive strength test at OBC at 30
Crumb Rubber Load KPa @ 30˚C OBC
0 5220.707633 6.4
2.5 4097.285707 6.475
5 3234.877943 6.45
7.5 2619.054288 6.375
This relationship between the UCS and the CR is shown in Figure 4.41.
Figure 4.41 Results of UCS each and AC modified without and with CR at 30˚ C
Calculate the tensile strength of the compacted bituminous mixture:
71
The UCS value of asphalt concrete 60/70 without crumb rubber is higher by 5220.71 KPa than asphalt concrete modified with crumb rubber at temperature 30˚C. This is due to the addition of the asphalt concrete mixture with crumb rubber decrease adhesion of asphalt to aggregate more resistant to destruction of which would affect the decrease in UCS value. However, asphalt concrete modified without crumb rubber is higher than asphalt concrete modified with crumb rubber at temperature 30 . The asphalt with crumb rubber is less sensitive to temperature changes by using test compared asphalt without crumb rubber. Through the study of the relationship between the value of UCS and temperature change, it is found that unmodified asphalt concrete is more sensitive to heat than crumb rubber modified AC.
4.18. Indirect Tensile Strength Modulus (ITSM)
ITSM test was performed both on samples of thin normal and modified AC using UMMATTA. Tests were conducted at a temperature of 40ºC and the results can be seen in Table 4.15. and Figure 4.42. (see also Appendix D).
Table 4.15. Comparison of Indirect Tensile Strength Modulus test at 40OC
CR% OBC ITSM (MPa) at 400C Average (MPa)
0% 6.4 633 705 669 669
2.50% 6.475 613 586 599.5 599.5
5.00% 6.45 363 349 356 356
7.50% 6.375 194 234 214 214
Three samples were tested for each unmodified and modified mixture. To obtain a stiffness modulus for a mixture, each sample was tested in three different conditions and the average value was adopted. Stiffness modulus of the mixtures is shown in Table 4.42 and Figure 4.42.
72
Figure 4.42. results of ITSM each and AC modified without and with CR
4.19. Permeability Test (M)
Permeability testing is important because one of the primary assumptions is structural pavement design for conventional pavement is flexible (asphalt concrete) and the pavement must be impermeable. The basis for this design approach is to minimize moisture infiltration and thus maintain adequate support from the underlying unbound materials. Table 4.16. shows the result of permeability test at OBC and Figure 4.43. and Figure 4.44. shows the summarized results for the each type of asphalt concrete at OBC.
The calculations of coefficient permeability are by the following equation:
Where diameter (D) = 2.54*4 = 10.16 cm Height (L) = 6.127 cm
Area (A) = = = 79.756 cm² (4.3) Pressure water (P)= 10Kg/cm²
Volume of water leakage (V) = 1000 ml
73
Table 4.16. Comparison of Permeability Test at OBC.
Crumb
74
Figure 4.43. The results of permeability test at 10000 dyen/cm
Figure 4.44. The results of permeability test at 20000 dyen/cm²
Through the review of the permeability test results in Table 4.16 and Figure 4.41 and 4.42. The following observations were obtained that the coefficient of permeability (K) value of AC with crumb rubber 7.5% is higher than asphalt concrete without crumb rubber (original) and with crumb rubber 2.5% and 5.0% by 9.24E-07 dyen/cm2 at water pressure 10000 dyen/cm2 and by 9.2.57E-06 dyen/cm2 at water pressure 20000 dyne/cm2
75
The results of permeability test shows that asphalt concrete without crumb rubber is lower than AC with crumb rubber since the mixture has the lowest coefficient of permeability the higher quality. It was happened because when water leaks into the soil layer (base course), causing deformities cracks and holes observed.
The relationship between the coefficient of permeability and water pressure become an inverse relationship, because the increase of water pressure leads to a decrease in Permeability coefficient.
4.20. Summary
This study covered all the processes from primarily stages of design up to the analysis of the data obtained.
1. The stability value of asphalt concrete 60/70 pen mixture without CRM is higher than asphalt concrete with 2.5%, 5.0%, 7.5% CRM by 11.64%, 5.04% and 5%, respectively. The cohesion and the bonding ability of modified bitumen increase, when increasing the proportion of rubber.
2. The flow value of asphalt concrete without CRM is lower than asphalt concrete with 2.5%,5.0%, and 7.5%. Since the penetration value of CR modified asphaltis higher than asphalt concrete without CRM. The flow value of AC with CRM is higher as comparison with AC without CRM. Therefore, the presence of CRM in the mixture increases its flow value. The addition of more CRM contents increased the flow to an optimum level and with further addition of CRM in the mix. Higher flow values may be related to the increase of air voids by using more CRM in the mixture, which leads to a more flexible mixture.
3. Density of the Compacted Mix (CDM).
76
varying densities of the mixtures is because of the viscosity effect on the compatibility of the mixtures.
The increase in viscosity could be a result of the amount of asphalt in the bitumen which improves the viscous flow of the modified bitumen sample during the interaction process. The higher viscosity of the resulting binder provided better resistance during compaction of the mixture, thus resulting in lower density of the modified mix. This is in concurrence with previous finding, which revealed that for ideal paving mixture a good correlation between binder viscosity and the compaction effort is required (Altamzwi, 2011).
4. Voids in the Mix (VIM).
The durability of bituminous pavement is a function of the voids of the mix (VIM) or porosity. In general, the lower the porosity, the less permeable the mixture will be and vice versa. Too much voids in the mix (high porosity) will provide passageways through the mix for the entrance of damaging air and water. Too low porosity could lead to flushing where the excess bitumen squeezes out of the mix to the surface .The effect of the CRM content for different binder contents on the porosity of the virgin mixture and AC mixture for any binder content used, the increase in CRM content in the mixture is followed by an increase in the VIM, which is due to the contact point between the aggregates which is lower when the CRM is content increased. The high amount of crumb rubber particle absorbs the binder which is required to encapsulate the aggregate and subsequently fill the voids between aggregates.
High porosity in the bituminous mixture means that there are many voids providing passageways for the entry of damaging air and water through the mix. On the other hand, with low porosity, water flush occurs whereby bitumen is squeezed.
77
impermeable and hence durable, but with sufficient voids to prevent bitumen deformation.
5. The optimum bitumen content at asphalt 60/70 pen is 6.4%. While the OBCfor asphalt with 2.5%, 5.0%,and 7.5%crumb rubber are 6.383%, 6.45% and 6.375%, respectively. There is no difference in the optimum bitumen content between the four types of asphalt concrete without and with CR, because it has been the same gradation of aggregates for the production of mixtures.
6. The ITS value of asphalt concrete without CR is higher than asphalt concrete with 2.5%, 5.0%, and 7.5% CR with different temperatures. Through the study of the relationship between the value of ITS test and temperature changes, it was found that normal asphalt concrete without CR lower sensitive to heat than asphalt concrete with CR.
There is a lot of filler composition of the asphalt concrete so it can fill cavities in the asphalt concrete mix aggregate and asphalt that surrounds thicker than using asphalt without CR. the asphalt concrete with CR is less sensitive to temperature changes by using ITS test compared with asphalt concrete without CR.
7. The coefficient of permeability value of asphalt concrete without CR is lower than asphalt concrete with 2.5% CR and AC with 2.5% CR is higher than AC with 5.0% CR and AC with 5.0% CR is higher than AC with 7.5% CR at water pressure 10000 dyne/cm2 and water pressure 20000 dyne/cm2, and this confirmed to the result of the test density and the percentage of VITM, where find that the mixtures are practically imperious.