ONLINE ISSN: 1880-9871 (As of September 20, 2013) Registered articles: 835
Sardari Lal MANNAN, Mannarathu Devasia MATHEW, Tammana JAYAKUMAR, Subash Chandra CHETAL
Released: July 31, 2013
pp.473-485
Yoshio TAKAGI, Hiroyasu TORII, Yuya OMIYA, Takashi KOBAYASH, Toshiyuki SAWA
Released: July 31, 2013
pp.486-495
Bagus BUDIWANTORO, I. Made PARWATA, Wiratmaja PUJA, Satryo SOEMANTRI
Released: July 31, 2013
pp.496-506
Masaaki KIMURA, Masahiro KUSAKA, Koichi KAIZU Released: July 31, 2013
pp.507-519
J-STAGE Home > Publications - Top
Review Paper
Papers
Top of this Page About My J-STAGE Sign-in Register Shopping Cart Help
Article Volume/Issue/Page DOI/JOI Journal of Solid Mechanics and Materials Engineering
Journal of Solid Mechanics and Materials Engineering Vol. 7(2013) No. 4
Fast Reactor Technology for Energy Security: Challenges for Materials Development
Abstract Full Text PDF[1613K]
FEM Stress Analysis and the Sealing Performance Prediction of Pipe Flange Connections under External Bending Moments and Internal Pressure
Abstract Full Text PDF[596K]
Optimum Lateral Railway Wheel Flange Radius WithMinimum Wear Rate: Twin Disc Simulation
Abstract Full Text PDF[972K]
Joint Strength and Their Improvement of Type 5052 Aluminum Alloy Autocompleting Friction Welded Joint
Download Meta of All Articles
Journal of Solid Mechanics
and Materials
Engineering
Vol. 7, No. 4, 2013
Optimum Lateral Railway Wheel Flange
Radius WithMinimum Wear Rate: Twin Disc
Simulation*
Bagus BUDIWANTORO**, I. Made PARWATA***, Wiratmaja PUJA**
and Satryo SOEMANTRI**
**Faculty of Mechanical and Aeronautical Engineering, Institute of Technology-Bandung JalanGanesha 10, Bandung 40132, Indonesia
E-mail: [email protected] ***Department of Mechanical Engineering, Faculty of Engineering, Udayana University Kampus Bukit Jimbaran, Bali–80364, Indonesia
Abstract
An experimental model has been developed to characterize the effect of lateral radius of curvature to the wear rate of a disc. This is to simulate the wheel-rail contact wear phenomenon in railway transportation where excessive rail wear commonly occurs at the curve, and eventually this will cause accidents such as derailment, etc. The experiment was conducted using two stainless steel discs, ST37 (0.132% C) and ST60 (0.458% C), with different lateral radius of curvature. One disc has the radius of 13 mm while the other disc has several variations of the radius i.e. 16 mm, 18 mm, 20 mm, 22 mm, and 24 mm. The lowest wear rate was observed for the disc with 22 mm radius while the highest wear rate was observed for the disc with 16 mm radius.
Key words: Wheel-Rail Contact, Hertzian Contact, Wear Rate, Twin-Disc Test
1. Introduction
An attempt has been made to identify the major factor causing excessive wear in railway track, and one of the possibilities is the occurrence of non-conformal contact between the rail gage surface and the wheel flange surface when the train passes the tight curve. Parwata et.al(1) succeeded in determining the contact pressure and the contact point during rail-wheel surface contact. The point of contact occurs at the 20 mm radius of curvature for the wheel and at 13 mm radius of curvature for the rail. The cross sectional profile of the rail as well as of the wheel consists for several lateral radius of curvature. Hernandez(2) has predicted that there will be a 30% error if the specimens are both cylinder.
Several twin disc experiments have been performed by some researchers. Fegredo and Pritchard(3) observed wear rate as a function of contact pressure at 3%, 6%, and 9% creep, using twin disc (cylinder type) experiment, the specimen dimensions are 35-40 mm diameter and 10 mm width, one of the cylinder is rotating at 200 rpm while the other is 1.104 times faster. Subsurface crack was observed before and beyond the mild-severe wear transition zone, and the observed crack is deeper and wider as the creep and contact pressure is increasing.
*Received 25 Feb., 2013 (No. 13-0096) [DOI: 10.1299/jmmp.7.x]
Hernandez and Joyce(4) observed the surface contact temperature of both discs with respect to slip change, and it showed that the temperature is increasing with the increase in slip. Moreover they conducted a twin disc experiment to simulate the influence of contaminants to surface adhesion, and the result shows that dry surface will provide strong adhesion while water and oil will weaken the surface adhesion. Addition of leaves will provide weaker surface adhesion than of oiled surface. Leaves will also damage the disc surface, sands will damage wheel and rail surfaces(5). Takikawa and Iriya(6) observed the occurrence of head check at high rail using twin disc test where 3 materials were used namely HH340, standard, bainitic and hypereutectoid. The result showed that head check occurred at the track with radius of curvature smaller than 800 m. Tassini also conducted a twin disc test to obtain a formula to evaluate the existing railway wear models namely BRR (British Rail Research), Royal Institute of Technology–Stockholm (KTH), and Sheffield University (USFD)(7). Parwataet.al.(8) observed the wear model of TanjungEnim – Tarahan railway track segment, it was excessive wear and therefore an effort is badly needed to reduce wear rate.
Observation of wear phenomena has also been performed using pin on disc experiment. Hung-KukOh(9) conducted a pin on disc test with unlubricated specimen loaded constantly at a certain speed. The results showed that carbon concentration will influence the transition zone from mild wear to severe wear. Goto and Amamoto(10) observed the wear rate and wear depth with respect to varied step load using pin on disc test with unlubricated specimen. Severe wear was observed for high load and mild wear was observed for low load. Bahrami(11) conducted experiment on AISI H13 steel to obtain wear mechanism, wear track, and wear debris. The results showed that at a load of 29.4 N the quenched specimen has the highest wear resistance and the debris consists of a mixture of oxides and plate like metallic powder. At a load of 98 N the 30-60 minute tempered specimen at T = 600 oC has high wear resistance and the debris consists of oxides. Viafara and Sinatora(12) conducted a pin on disc test to observe wear regime transition with respect to material hardness. The wear regime transition depends on microstructure changes, surface oxidation, and workhardening. Lee(13) conducted a pin on disc test to observe that wear performance of bainitic steel is worse than of pearlit steel although the hardness is higher. Langueh(14) developed a numerical approach to include material inelastic property so that the influence of steel grade difference to rolling contact fatigue could be observed. Goto(15) observed the wear behaviour of a 0.35% C steel under unlubricated condition at moist air environment. The loading is stepped, mild wear was observed for increasing loading while severe wear was observed for decreasing loading.
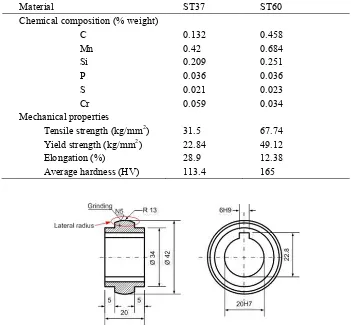
In this paper, a twin disc experiment was conducted using the discs as shown in Figure 1. With this type of disc a more accurate wear prediction could be obtained. The material of disc 1 is medium carbon steel, ST 60 (0.458 % C) and of disc 2 is low carbon steel, ST 37 (0.132 % C). The lateral radius of curvature of disc 1 (lower disc) is fixed at 13 mm while of disc 2 (upper disc) varies from 16, 18, 20, 22, 24 mm.
2. Experimental set up
Test Specimen
Journal of Solid Mechanics
and Materials Engineering
Vol. 7, No. 4, 2013
Table 1.Chemical compositions and mechanical properties of test specimen
Material ST37 ST60
Chemical composition (% weight) C
Mn Si P S Cr
0.132 0.42 0.209 0.036 0.021 0.059
0.458 0.684 0.251 0.036 0.023 0.034 Mechanical properties
Tensile strength (kg/mm2) 31.5 67.74 Yield strength (kg/mm2) 22.84 49.12
Elongation (%) 28.9 12.38
Average hardness (HV) 113.4 165
Figure 1. Test specimen
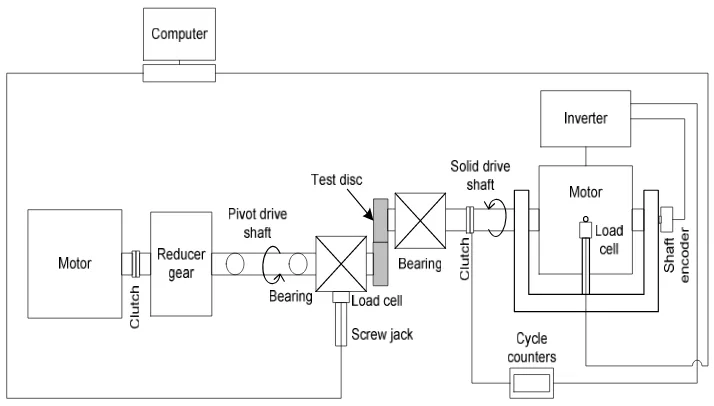
Apparatus
Figure 2. Twin disc experimental set up
3. Experimental Analysis
The formula for determining the maximum contact pressure p0 is taken from Hertz (16)
, contact area elliptical half axis can be determined using the following formula:
Longitudinal half axis a:
⁄
(1)
Lateral half axis b:
⁄
(2)
with N is total normal force, while Y1, Y2, and Y3 are defined as the following
(3)
(4)
′ ′ (5)
If both of disc materials are the same then the elastic modulus Ew=ER=E and the poisson ratio vw=vR=v so that Y1=Y2=Y, and then equations (1) and (2) become
⁄
(6)
⁄
Journal of Solid Mechanics
γ is the angle between the normal surfaces containing R1and R2,then the maximum contact pressure can be determined as
(10)
The values of m and n can be obtained from the table available on reference (16).
Using equation (10), a force of 200 N is needed to obtain a contact pressure of 2000 MPa.
Slip is defined as
(11)
The rotational speed of disc 1 is 149.7 rpm, in order to obtain a slip of 0.2% then the rotational speed of disc 2 should be 150 rpm.
All tests were performed continuously until upper disc reached 10,000 rotational cycles, and the tests were conducted under dry condition (unlubricated).
4. Experimental results
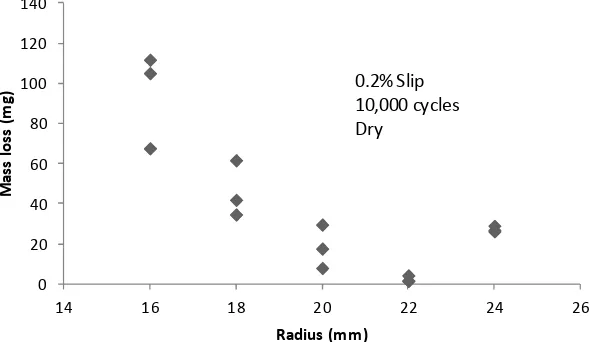
The results are shown in the following Figures 3 to 11. Figure 3 shows that the highest mass loss occurs at the disc with a lateral radius of curvature of 16 mm, then it decreases at radius of 18, 20, 22 mm and it increases again at radius of 24 mm. The minimum mass loss is observed at radius of 22 mm.
Figure 3. Mass loss with respect of lateral radius of curvature
Figure 4. Wear rate with respect to lateral radius of curvature.
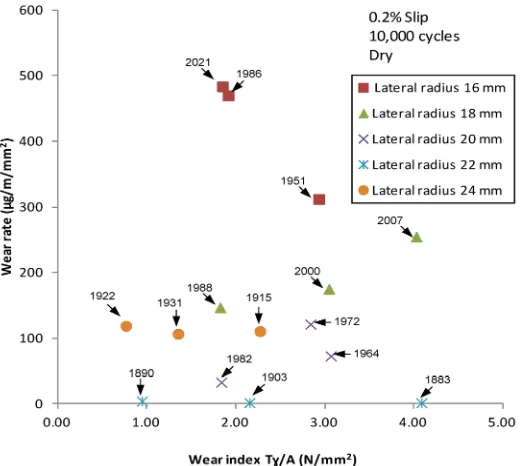
The influence of contact force to wear rate is shown in Figure 5, where contact force is formulated in wear index which is the product of traction force (T) multiplied by slip (γ) and divided by contact area (A)(18, 19). Contact pressure (MPa) is shown in Figure 5 described as dots. There are two forces acting during disc contact, normal force and tangential force. Normal force creates contact pressure while tangential force influences wear index. Figure 5 shows that the combination of lateral radius of 13 and 22 mm provides the lowest contact pressure and the minimum wear rate.
Figure 5. Wear rate with respect to wear index.
0 100 200 300 400 500 600
14 16 18 20 22 24 26
W
e
a
r
ra
te
(
µ
g
/
m
/
m
m
2)
Radius (mm)
Journal of Solid Mechanics
and Materials Engineering
Vol. 7, No. 4, 2013
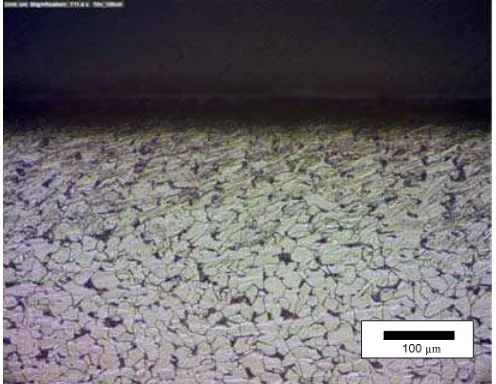
Observation of surface topology is shown in Figure 6 where the contact surface is rough with cracks in the vicinity. In the center where high pressure occurs the roughness is much severe than in the vicinity.
Figure 6.SEM of contact surface of disc 2 with lateral radius of 16 mm.
Figure 7 shows that the subsurface deformation is small while the surface deformation is large.
Figure 7.Subsurface deformation of disc 2 with lateral radius of 16 mm.
O disc 2 pressu MPa) damag
Th disc 2 2 is la
Th using pressu
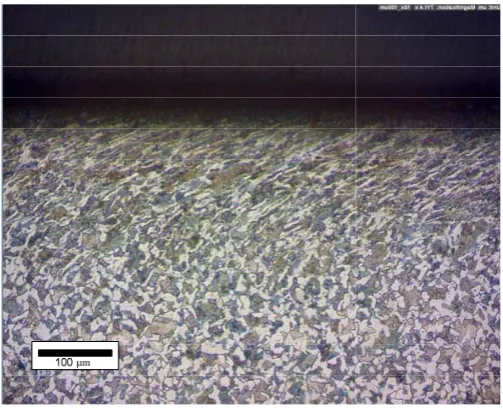
Figure 8.SEM of contact surface of disc 2 with la
Figure 9.Subsurface deformation of disc 2 with la
Observation of surface topology and subsurface defo 2 and 16 mm radius disc 2 shows the correlation b ure and the surface damage level. The contact pressur is lower than of 16 mm radius disc 2 (1986 MPa), se ge of 16 mm radius disc 2 is much severe.
he wear index of 22 mm radius disc 2 (4.08 N/mm2) (1.9 N/mm2), see Figure 5, therefore the subsurface d arger due to the contribution of higher tangential force heoretical contact pressure for each lateral radius o
Hertz equation and it is shown in Figure 10. It can b ure occurs for 22 mm radius disc 2.
ateral radius of 22 mm.
ateral radius of 22 mm.
ormation for both 22 mm radius between the intensity of contact re of 22 mm radius disc 2 (1883 ee Figure 5, therefore the surface
) is higher than of 16 mm radius deformation of 22 mm radius disc
Journal of Solid Mechanics
and Materials Engineering
Vol. 7, No. 4, 2013
Figure 10.Theoretical contact pressure with respect to lateral radius of curvature.
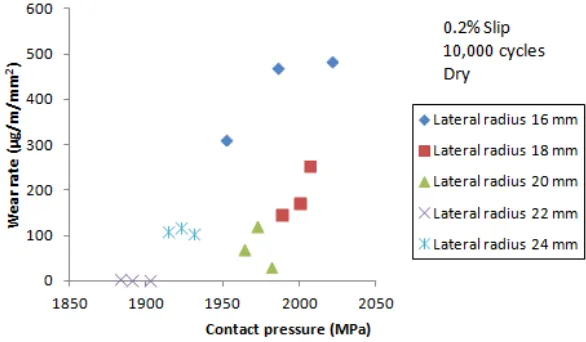
Figure 11 shows wear rate with respect to contact pressure and it can be seen that wear rate increases with increasing contact pressure, and the minimum wear rate occurs for 22 mm radius disc 2.
Figure 11. Wear rate with respect to contact pressure.
5. Analysis
In some research on rolling contact phenomena it is common to observe that wear rate is increased if the contact pressure increases, in some cases the increase is linear and in other cases it is non-linear. Clayton(20) showed that for pearlitic steel rail the effect is non-linear while for bainitic steel rail the effect is linear.
Bolton and Clayton(18) showed the influence of contact pressure to wear rate for 4 types of rails i.e. BS11 (0.53%C), UICA (0.73%C), UICB (0.62%C), and 1% chrome (0.7%C) in contact with D type wheel (0.65% C). They showed that wear rate increases with the increase of contact pressure at the same slip condition. Beagley(21) observed the same phenomena.
Braghinet.al(22) showed that there is an inaccuracy in predicting wear rate at the flange surface of the wheel, the difference between the predicted wear and the experimental result
1850 1860 1870 1880 1890 1900 1910 1920 1930 1940 1950
15 17 19 21 23 25
C
o
n
ta
ct
P
re
ss
u
re
(
M
P
a
)
is 30%. The experiment was performed using twin disc (cylindrical) apparatus.
In this research work, it can be seen from Figure 5 and Figure 10 that the observed contact pressures are very close to the theoretical contact pressure, for example in the case of 22 mm lateral radius the observed contact pressures are 1890 MPa, 1903 MPa, and 1883 MPa while the theoretical contact pressure is 1855 MPa. The difference is between 1.5 to 2.6 % which is much more accurate than the previous similar research works using twin disc (cylindrical).
Figure 4 and Figure 11 show the consistency of the research results which describe that at 22 mm lateral radius the wear rate is minimum and the contact pressure is also minimum, and this confirms the proportionality between wear rate and contact pressure.
In the previous research work(1) it was shown that during rail-wheel surface contact, the point of contact occurs at the 20 mm radius of curvature for the wheel and at 13 mm radius of curvature for the rail. The cross sectional profile of the rail as well as of the wheel consists for several lateral radius of curvature, commonly ranging from 13 to 24 mm.
6. Conclusion
This research work shows that, within the existing range of variation of lateral radius i.e. 13 – 24 mm, the lateral radius of curvature of the wheel flange surface influences the wear behaviour of wheel-rail contact. The research result shows that there is a configuration of wheel – rail contact which causes least wear as compared to other configuration within the 13 – 24 mm range of variation. The twin disc test with curved surfaces (non-cylindrical) shows a more accurate simulation of the real wheel-rail contact phenomena, since the test can simulate the non-conformal contact between two surfaces with different radius of curvature.
Acknowledgement
The authors would like to convey their appreciation to the Directorate General of Higher Education, Ministry of Education & Culture, Indonesia for the provision of research grant No. 445/SP2H/PP/DP2M/VI/2010 and No. 508/SP2H/PL/Dit.Lintabmas/VII/2011.
References
(1) Parwata I. M. et al.Effect of curving speed and mass of railway vehicle to the contact characteristic on curve track.Int. J. Vehicle Systems Modelling and Testing, vol. 6, pp. 250-267, 2011.
(2) Hernández F. C. R. et al.Mechanical properties and wear performance of premium rail steels.Wear, vol. 263, pp. 766-772, 2007.
(3) Fegredo C. P. D. M.A Metallographic Examination of Rollers Subjected to Wear Under Rolling Sliding Conditions.Wear,vol. 49, pp. 67 - 78, 1978.
(4) Gallardo-Hernandez R. L. E.A and Dwyer-Joyce R.S.Temperature in a twin-disc wheel/rail contact simulation.Tribology International, vol. 39, pp. 1653–1663, 2006. (5) Gallardo Hernandez R. L. E.A.Twin disc assessment of wheel/rail adhesion.Wear, vol.
265, pp. 1309–1316, 2008.
(6) Takikawa Y. I. M.Laboratory simulations with twin-disc machine on head check.Wear, vol. 265, pp. 1300–1308, 2008.
(7) Tassini X. Q. N., LewisR., Dwyer-Joyce R., Ariaudo C., Kuka N.A numerical model of twin disc test arrangement for the evaluation of railway wheel wear prediction methods.Wear, vol. 268, pp. 660-667, 2010.
(8) Parwata I. M., et al.Keausan Excessive Roda Rel Kereta Api Babaranjang Jalur Tajungenim ke Tarahan, 2012.