www.elsevier.com / locate / econbase
The effect of food stamp cashout on undernutrition
a b c ,
*
John A. Bishop , John P. Formby , Lester A. Zeager
a
Department of Economics, East Carolina University, Greenville, NC 27858-4353, USA b
Department of Economics, Finance, and Legal Studies, University of Alabama, Tuscaloosa, AL 35487-0224, USA c
Department of Economics, East Carolina University, Greenville, NC 27858-4353, USA
Received 25 January 1999; accepted 9 September 1999
Abstract
We investigate the effect of food stamp cashout on undernutrition using household data from cashout experiments in Alabama and San Diego, California. We apply dominance methods to test for differences in nutrient distributions at or below the recommended dietary allowances. 2000 Elsevier Science S.A. All rights reserved.
Keywords: Food stamp program; (Under)Nutrition; Cashout; Stochastic dominance
JEL classification: I38 (Provision and effects of welfare programs)
1. Introduction
The architects of the US Food Stamp Program (FSP) aimed to help low-income households eat a nutritious diet by supplementing their food purchasing power. Since its inception, the FSP has been providing benefits in the form of food coupons rather than cash, reflecting the popular notion that coupons are more likely than cash to raise food consumption and improve nutrition. The effect on recipient behavior of in-kind versus cash benefits has been a longstanding interest of economists (Southworth, 1945), but direct comparisons of consumer responses to cash and coupon benefits were not possible until recently.
To investigate the issue, the US Department of Agriculture (USDA) – the agency responsible for oversight of the FSP – sponsored cashout demonstration projects in 1989. Two of these projects were designed as classic experiments. In cooperation with state and local social service agencies, USDA randomly assigned large numbers of households to treatment (cash) and control (food coupon) groups
*Corresponding author. Tel.: 11-252-328-6408; fax:11-252-328-6743.
E-mail address: [email protected] (L.A. Zeager)
in Alabama and San Diego, California, which provides an ideal opportunity for comparing the effects of cash and coupons on actual behavior.
In both experiments, substantial proportions of households have nutrient deficits, especially for folacin, vitamin E, and calcium. Other households are well above requirement thresholds and are not undernourished. To compare relative undernutrition in the treatment and control groups, we apply dominance methods as proposed by Kakwani (1989). Comparing the nutrient distributions rather than
1
summary statistics (e.g. the distribution means) permits us to focus on undernourished households. Kakwani (1989) has shown that cumulative distributions of nutrients can be used to evaluate relative undernutrition in the same way that cumulative distributions of incomes have been used to evaluate relative poverty (Foster and Shorrocks, 1988). Kakwani’s approach has been applied in India (Kakwani, 1989), Indonesia (Ravallion, 1990, 1992), Puerto Rico (Bishop et al., 1996), and the United States (Bishop et al., 1992). Statistical inference procedures have also been developed for identifying significant differences between two cumulative distributions. We apply Kakwani’s approach and the statistical inference procedures to data from the cashout experiments.
A dominance approach is well suited to the cashout data for two reasons. First, the classic experimental design of the cashout demonstrations ensures that any differences between the nutrient distributions of cash and coupon recipients are attributable to the treatment variable. Second, the specific form of the distribution of nutrient requirements in the population does not need to be known; we need only assume the populations have the same requirement distributions — a reasonable assumption for comparisons of the treatment and control groups in the cashout experiments.
The remainder of the paper is organized as follows. The next section provides a brief description of the methods used in the paper. After describing the data from the experiments, the empirical results are presented and discussed. A final section offers concluding comments.
2. The dominance approach to comparing relative undernutrition
The starting point for most studies of undernutrition is a set of human dietary requirements for different age and sex groups. By far the most widely recognized of these is the Recommended Dietary Allowances (RDA) developed by the Food and Nutrition Board of the National Research Council of the National Academy of Sciences. Yet, as the nutritionists readily acknowledge, the adequate nutrition level for the human body cannot be established with exact precision; any requirement
2
threshold, such as the RDA, involves an element of arbitrariness. Moreover, in evaluating nutrient distributions it is important to remember that ‘there is no agreed-upon benefit to levels above 100%’ of the RDA (Emmons, 1986, p. 1690).
These concerns can be addressed by evaluating relative undernutrition based on cumulative
1
In their reports to the USDA, Ohls et al. (1992) and Fraker et al. (1992) compare nutrient availability at the means of the treatment and control groups of the two experiments. They also recognize the value of comparing cumulative nutrient distributions, but consider only a few nutrients and apply no statistical inference procedures to the distributional comparisons.
2
distribution functions (cdfs) of nutrients for two populations, truncated in the neighborhood of the RDA, assuming that the populations have the same distribution of nutrient requirements. Let F (x) and1
F (x) be the cdfs of nutrients for two populations. Widely known procedures developed by nutrition2
scientists can be used to adjust nutrients for the composition and size of the household, the ages of its members, and the number of meals eaten away from home. Kakwani (1989, p. 539) then establishes the following proposition:
Proposition 1. if F1(x)>F2(x) for all values of x, then the undernutrition in population 1 will always be greater than or equal to that in population 2.
Proposition 1 is known as first-order dominance (FOD) of F by F .1 2
An analogous theorem on the construction of poverty orderings based on income distributions for two populations is derived by Foster and Shorrocks (1988), who truncate the distributions at the poverty line. Following Foster and Shorrocks, the distributions of nutrients could be truncated in the neighborhood of the requirement thresholds (RDA). Silberberg (1985) and Butler and Raymond (1996) also propose limiting attention to the persons who are at risk of undernutrition. The logic of this approach is made very clear by Butler and Raymond (1996, p. 781), ‘ . . . above some level, extra nutrients are superfluous. If an individual has attained a nutritionally adequate diet, then whether or not food stamp income allows him or her to consume more nutrients is irrelevant.’
In the construction of dominance tests, it is convenient to compare the inverses of the cdfs in 21
Proposition 1, x5F1 ( p), where p represents a quantile in the nutrient distribution (e.g. the bottom 20 percent) and x is an order statistic, which is the highest nutrient level in the quantile. We approximate the inverse cdf, or quantile function, as the step function formed by the vector of conditional mean nutrient levels in the sample quintiles. We then conduct pairwise tests of corresponding conditional means for each sample, which permits us to distinguish among three possible outcomes — dominance, statistical equivalence, and a significant crossing.
To make multiple comparisons we follow the approach of Bishop et al. (1989), who developed a
3
pairwise, joint-testing procedure for a predetermined number of points, k, in the distributions. The points can be the conditional means of the quintiles, deciles, or other quantiles in the two samples. That is, we test the null hypothesis:
H :0 m1i5m2i i51,2, . . . ,k (1)
wherem1iandm2iare the conditional means in populations 1 and 2. An appropriate test statistic for H0 is:
1 / 2
ˆ ˆ
ˆ ˆ
Ti5(m1i2m2i) / [Q /N1i 11Q /N ]2i 2 i51,2, . . . ,k (2)
where Q1i and Q2i denote asymptotic variances and N and N are the number of observations in1 2
samples 1 and 2. Bishop et al. (1989), show that for large samples, each of the T is asymptoticallyi
standard normal and provide a procedure for estimating Q1i and Q .2i
We treat the individual tests at k points of the quantile function as sub-hypotheses of a joint test. To maintain the size of the joint test (i.e. to control the type I error), we use critical values for the Student
3
Maximum Modulus (SMM) distribution (Miller, 1981). An approximatelya-level test of the equality of two vectors of conditional quantile means rejects each of the k sub-hypotheses if uTiu.m (k,a `),
4
where m (k,a `) is the upper-a critical value of the SMM distribution with `degrees of freedom. The SMM critical values are obtained from Stoline and Ury (1979).
In general, joint tests of the conditional means generate only partial orderings of distributions. If no pair of conditional means is significantly different, then the two quantile functions are statistically equivalent. If a positive (negative) and significant difference exists at one or more quantile means and no negative (positive) significant differences exist, then we have FOD. Finally, if tests yield both positive and negative significant differences, the two quantile functions intersect and no FOD ranking is possible. However, truncated dominance may still hold below reasonable requirement thresholds. The next section describes the nutrient data provided by the cashout experiments.
3. Data
The data for this study were obtained from parallel surveys, conducted in 1990, of households that participated in food stamp cashout demonstrations in Alabama and San Diego, California. The Alabama sample included residents of rural (52 percent) and urban (48 percent) counties; the California sample was drawn entirely from San Diego county. Therefore, the two experiments represent not only different regions, but contrasting social settings as well. Fraker et al. (1995b, p. 388), point out that the implementation of the two experiments also differed. The San Diego experiment was scheduled to run 5 years or longer and was given much publicity. In contrast, the Alabama experiment ran only 8 months and received little publicity.
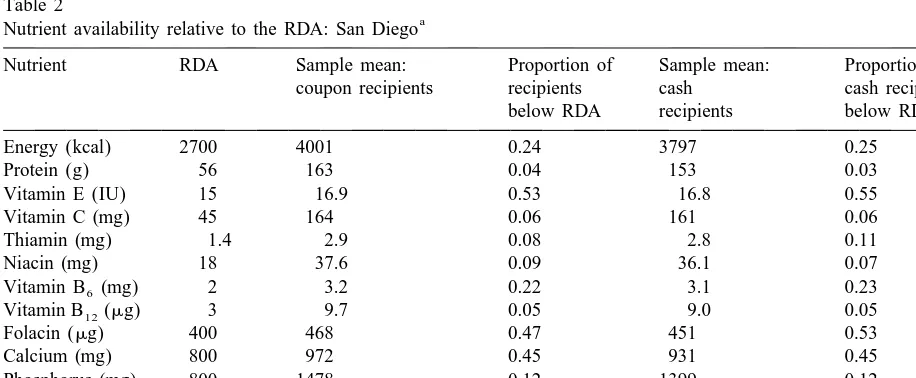
We represent nutrient status by nutrient availability, which exceeds nutrient intake because some food is wasted or fed to pets. For comparability across households that differ in size and composition, we express nutrients in adult male equivalent (AME) units. In Tables 1 and 2 we compare nutrient availability to the RDA in the Alabama and San Diego experiments. In both experiments, nutrient availability at the sample means surpasses the RDA for food energy and each nutrient in the treatment and control groups. But 16 percent of the Alabama sample and about 25 percent of the San Diego sample fall short of the RDA for food energy. Moreover, the incidence of undernutrition is more than
10 percent in each sample for phosphorus, iron, vitamin B , magnesium, vitamin E, calcium, and6
folacin. In contrast, relatively few households in either sample experience a shortfall in protein, vitamin C, thiamin, niacin, and vitamin B .12
In a 1983 study of low-income families in Cleveland, Emmons (1986) finds that diets contain inadequate amounts of vitamin B , vitamin E, iron, calcium, and magnesium (her study provides no6 information on folacin). Using the 1977–1978 Nationwide Food Consumption Survey, Silberberg (1985) concludes that consumption of folacin and magnesium may be inadequate. Thus, our findings reinforce the results of previous studies using other data sources.
Before moving to our main results, we point out that the number of observations generated by the
4
Table 1
a Nutrient availability relative to the RDA: Alabama
Nutrient RDA Sample mean: Proportion of Sample mean: Proportion of coupon recipients coupon recipients cash cash recipients
below RDA recipients below RDA
Energy (kcal) 2700 4670 0.16 4722 0.16
Protein (g) 56 161 0.01 162 0.01
Vitamin E (IU) 15 20.3 0.41 20.5 0.41
Vitamin C (mg) 45 153 0.09 151 0.08
Thiamin (mg) 1.4 3.2 0.08 3.2 0.09
Niacin (mg) 18 42 0.06 42 0.08
Vitamin B (mg)6 2 3.1 0.24 3.2 0.26
Vitamin B12(mg) 3 10.7 0.08 10.3 0.09
Folacin (mg) 400 444 0.54 446 0.51
Calcium (mg) 800 940 0.49 971 0.47
Phosphorus (mg) 800 1675 0.11 1703 0.11
Magnesium (mg) 350 466 0.34 473 0.35
Iron (mg) 10 18.4 0.20 18.5 0.18
a
The Alabama sample contains 2184 observations, including 1025 coupon recipients and 1159 cash recipients.
FSP cashout experiments is sufficient to perform statistical comparisons of distributions of nutrients by quintile. Even the smaller San Diego sample contains more than 90 observations per quintile in the treatment and control groups. Information about the randomness of the treatment and control groups is
5
given by Fraker et al. (1995a, p. 639).
Table 2
a Nutrient availability relative to the RDA: San Diego
Nutrient RDA Sample mean: Proportion of Sample mean: Proportion of coupon recipients recipients cash cash recipients
below RDA recipients below RDA
Energy (kcal) 2700 4001 0.24 3797 0.25
Protein (g) 56 163 0.04 153 0.03
Vitamin E (IU) 15 16.9 0.53 16.8 0.55
Vitamin C (mg) 45 164 0.06 161 0.06
Thiamin (mg) 1.4 2.9 0.08 2.8 0.11
Niacin (mg) 18 37.6 0.09 36.1 0.07
Vitamin B (mg)6 2 3.2 0.22 3.1 0.23
Vitamin B12(mg) 3 9.7 0.05 9.0 0.05
Folacin (mg) 400 468 0.47 451 0.53
Calcium (mg) 800 972 0.45 931 0.45
Phosphorus (mg) 800 1478 0.12 1399 0.12
Magnesium (mg) 350 519 0.28 495 0.28
Iron (mg) 10 16.1 0.24 15.8 0.24
a
The San Diego sample contains 935 observations, including 463 coupon recipients and 472 cash recipients.
5
4. Empirical results
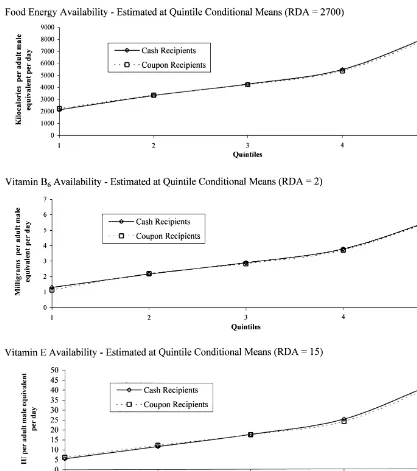
The food energy and nutrient distributions (cdfs) for the experimental (cash) and control (coupon) groups in the cashout experiments contain all of the information necessary to apply the first-order dominance criterion in Proposition 1. As noted above, it is both equivalent and more convenient to
21
conduct the inference tests and present the results in terms of the inverse cdf, F1 , which is widely
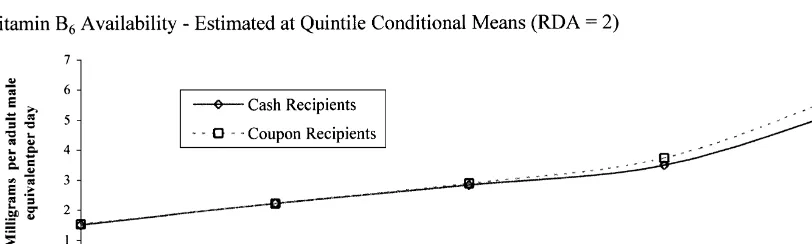
referred to as the quantile function. Fig. 1 shows quantile functions estimated at quintiles for food energy and selected micronutrients in the Alabama sample. Fig. 2 provides similar information for San Diego. Some of the quantile functions appear to cross and others appear not to differ. By applying inference tests we can answer the following questions. Do the quantile functions differ? If yes, where and how do they differ?
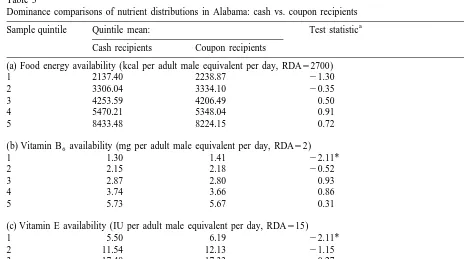
Table 3 reports inference tests for first-order stochastic dominance comparisons of distributions of food energy, vitamin B , and vitamin E availability for the cash and coupon recipients in Alabama.6 By inspection of the food energy quintile means for coupon and cash recipients (panel a), it appears that the quantile functions intersect. That is, coupon recipients have higher mean food energy availability in the bottom two quintiles than cash recipients, while the opposite is true in the remaining quintiles. But the test statistic reveals that no difference in quintile means is statistically significant. Therefore, we reject the null hypothesis and conclude that the distributions of food energy for coupon and cash recipients are statistically equivalent.
In Table 3 we also find apparent crossings in quantile functions for vitamins B and E (panels b and6
c). But the inference tests reveal that, in both cases, only the difference in the bottom quintile is statistically significant. Thus, for vitamins B and E, coupon recipients FOD cash recipients, which6
means undernutrition is greater for cash recipients than coupon recipients. For all other micronutrients not shown in Table 3, we find no significant differences between cash and coupon recipients, as in the food energy comparison.
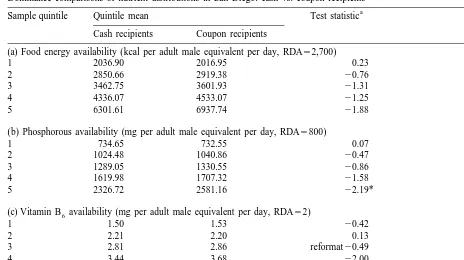
The corresponding results for San Diego are shown in Table 4. Once again, as in Alabama, there is an apparent crossing in quantile functions for food energy availability in the treatment (cash) and control (coupon) groups, but the differences are not significant at any of the quintiles (panel a). Hence, coupon and cash recipients are statistically equivalent with respect to the availability of food energy.
Table 3
Dominance comparisons of nutrient distributions in Alabama: cash vs. coupon recipients
a
Sample quintile Quintile mean: Test statistic
Cash recipients Coupon recipients
(a) Food energy availability (kcal per adult male equivalent per day, RDA52700)
1 2137.40 2238.87 21.30
2 3306.04 3334.10 20.35
3 4253.59 4206.49 0.50
4 5470.21 5348.04 0.91
5 8433.48 8224.15 0.72
(b) Vitamin B availability (mg per adult male equivalent per day, RDA52)6
1 1.30 1.41 22.11*
2 2.15 2.18 20.52
3 2.87 2.80 0.93
4 3.74 3.66 0.86
5 5.73 5.67 0.31
(c) Vitamin E availability (IU per adult male equivalent per day, RDA515)
1 5.50 6.19 22.11*
The test statistic for the differences in quintile means is the Student Maximum Modulus (SMM) — a joint test statistic. *
Table 4
Dominance comparisons of nutrient distributions in San Diego: cash vs. coupon recipients
a
Sample quintile Quintile mean Test statistic
Cash recipients Coupon recipients
(a) Food energy availability (kcal per adult male equivalent per day, RDA52,700)
1 2036.90 2016.95 0.23
2 2850.66 2919.38 20.76
3 3462.75 3601.93 21.31
4 4336.07 4533.07 21.25
5 6301.61 6937.74 21.88
(b) Phosphorous availability (mg per adult male equivalent per day, RDA5800)
1 734.65 732.55 0.07
2 1024.48 1040.86 20.47
3 1289.05 1330.55 20.86
4 1619.98 1707.32 21.58
5 2326.72 2581.16 22.19*
(c) Vitamin B availability (mg per adult male equivalent per day, RDA52)6
1 1.50 1.53 20.42
The test statistic for the differences in quintile means is the Student Maximum Modulus (SMM) — a joint test statistic. *
Significantly different from zero at the 10-percent level using a one-tailed test.
Table 4 also shows the importance of taking into account the RDA in nutrition comparisons. Consider phosphorous availability (panel b) for coupon and cash recipients. Coupon recipients have greater phosphorous availability than cash recipients in every quintile except the first. However, only one of these differences is statistically significant and it is in the fifth quintile — far above the
recommended amount for phosphorus (RDA5800). In this case, it is reasonable to use truncated
dominance, which leads to the conclusion that coupon and cash recipients are equivalently undernourished with respect to phosphorus.
Comparisons for all other micronutrients in the San Diego experiment reveal no significant differences between coupon and cash recipients. For vitamin B (Table 4, panel c), the difference in6
means in the fourth quintile is nearly significant, but the means are far above the recommended allowance (RDA52) at this quintile. Therefore, we find no evidence that cash recipients are more undernourished than coupon recipients in the San Diego experiment.
Overall, our findings reveal that food stamp cashout leads to few changes in undernutrition. Among
these changes, reductions in the availability of vitamins E and B in Alabama may be cause for6
cash transfers in economic theory. The theory predicts that conversion from coupon to cash benefits will effect behavior only if food assistance exceeds the desired level of food consumption in the absence of assistance — a condition met in only a small proportion of food stamp households.
5. Conclusions
We make comparisons of nutrient distributions for cash and coupon recipients who participated in two food stamp cashout experiments in Alabama and San Diego, California. A substantial proportion of households participating in the experiments fall short of recommended levels for food energy and a variety of nutrients. To focus attention on households who are at or below the nutrient requirement threshold (RDA), we make truncated dominance comparisons of the nutrient distributions of cash and coupon recipients in the experiments. We find that cashout leads to greater undernutrition for cash recipients than coupon recipients in only two of 26 cases (vitamins E and B in Alabama). The modest6 effects of the cashout on behavior are consistent with the standard analysis of in-kind versus cash transfers in economic theory.
Acknowledgements
The authors wish to thank Steven Carlson (Food and Nutrition Service, USDA) and Thomas Fraker (Mathematica Policy Research) for making the cashout data available and James Ohls for valuable comments. The authors gratefully acknowledge financial support from the University of North Carolina Institute of Nutrition. Lester Zeager wishes to thank the College of Arts and Sciences, East Carolina University, for release time for this project.
References
Beach, C.M., Davidson, R., 1983. Distribution-free statistical inference with Lorenz curves and income shares. Rev. Econ. Stud. 50, 723–735.
Beach, C.M., Richmond, J., 1985. Joint confidence intervals for income shares and Lorenz curves. Int. Econ. Rev. 26, 439–450.
Bishop, J.A. Formby, J.P., 1999. Tests of significance for Lorenz partial orders. In: Silber, J. (Ed.), Income Inequality Measurement: From Theory to Practice. Springer, Berlin (in press).
Bishop, J.A., Formby, J.P., Thistle, P.D., 1989. Statistical inference, income distributions, and social welfare. In: Slottje, D.J. (Ed.), Research on Economic Inequality, Vol. 1, JAI Press, Greenwich, CT, pp. 49–82.
Bishop, J.A., Formby, J.P., Zeager, L.A., 1992. Nutrition and nonparticipation in the US Food Stamp program. Appl. Econ. 24, 945–949.
Bishop, J.A., Formby, J.P., Zeager, L.A., 1996. Relative undernutrition in Puerto Rico under alternative food assistance programs. Appl. Econ. 28, 1009–1017.
Butler, J.S., Raymond, J.E., 1996. The effect of the Food Stamp program on nutrient intake. Econ. Inquiry 34, 781–798. Devaney, B., Fraker, T., 1986. Cashing out food stamps: Impacts on food expenditures and diet quality. J. Policy Anal.
Manag. 5, 725–741.
Foster, J.E., Shorrocks, A.F., 1988. Poverty orderings. Econometrica 56, 173–177.
Fraker, T.M., Martini, A.P., Ohls, J.C., Ponza, M., Quinn, E.A. (Eds.), 1992. The Evaluation of the Alabama Food Stamp Cash-Out Demonstration, Vols. I and II, Mathematica Policy Research, Inc, Washington.
Fraker, T.M., Martini, A.P., Ohls, J.C., 1995a. The effect of food stamp cashout on food expenditures. J. Hum. Resour. 30, 633–649.
Fraker, T.M., Martini, A.P., Ohls, J.C., Ponza, M., 1995b. The effect of cashing-out food stamps on household food use and the cost of issuing benefits. J. Policy Anal. Manag. 14, 372–392.
Kakwani, N., 1989. On measuring undernutrition. Oxford Econ. Papers 41, 528–552. Miller, R.G., 1981. Simultaneous Statistical Inference, 2nd Ed, Wiley, New York.
Ohls, J.C., Fraker, T.M., Martini, A.P., Ponza, M. (Eds.), 1992. The Effects of Cash-Out On Food Use By Food Stamp Participants in San Diego, Mathematica Policy Research, Inc, Princeton.
Ravallion, M., 1990. Income effects on undernutrition. Econ. Dev. Cult. Change 38, 489–515.
Ravallion, M., 1992. Does undernutrition respond to incomes and prices?. Dominance tests for Indonesia. World Bank Econ. Rev. 6, 109–124.
Silberberg, E., 1985. Nutrition and the demand for tastes. J. Polit. Econ. 93, 881–900.
Southworth, H.M., 1945. The economics of public measures to subsidize food consumption. J. Farm Econ. 27, 38–66. Stoline, M.R., Ury, H.K., 1979. Table of the studentized maximum modulus distribution and an application to multiple