www.elsevier.com / locate / econbase
The academic performance of legacies
*
James Monks
Department of Economics, Mount Holyoke College, South Hadley, MA 01075, USA
Received 28 April 1999; accepted 17 August 1999
Abstract
The mounting evidence of the returns to college quality has focused attention on the admissions practice of preferential treatment of legacies. This paper finds that legacies are slightly less likely to receive top grades, although the magnitude of these effects are quite small. 2000 Elsevier Science S.A. All rights reserved.
Keywords: Resource allocation; Human capital formation
JEL classification: H2
1. Introduction
It is a common practice among college and university admissions directors to give special consideration to applicants whose relatives attended the institution — legacies. It is even believed that this practice is most pronounced at highly selective private institutions, where the competition for slots in the incoming freshman class can be quite fierce. Evidence of this practice at Harvard and Yale was unveiled in a study by Larew (1994). He concludes, ‘‘droves of unqualified, unprepared kids (are) getting into our top colleges’’. By comparing admission applications from Harvard and Yale from 1981 to 1988, the U.S. Department of Education’s Office for Civil Rights (OCR) found that admitted legacies scored lower than nonlegacies in all quantifiable areas of admission criteria. Larew concludes that legacies face lower academic standards and are unprepared for the institutions to which they are admitted.
What could not be addressed by the data available to the OCR was how legacies performed once admitted to these institutions. This study examines the academic performance of legacies relative to the nonlegacy student body at a set of highly selective, private institutions. This is a pressing question in an educational environment where both families and institutions devote substantial resources to the
*Tel.: 11-617-253-5031; fax: 11-617-258-8280.
E-mail address: [email protected] (J. Monks)
application process. Additionally, the rising returns to higher education and the mounting evidence of significant premiums earned by graduates of more selective institutions warrant examination into the performance of legacies at these institutions.
Using data from a sample of seniors in the spring of 1998 at a set of private, highly selective colleges and universities, I am able to estimate how well legacies performed academically relative to
1
their peers. I find that legacies perform nearly as well as nonlegacies. In general, legacies performed at least as well in the classroom, if not better, than nonlegacies; and conditional on individual, institutional, and familial characteristics legacies are only 3.08 percentage points less likely than comparable nonlegacies to get a B plus or better in overall grade point average, and only 1.86 percentage points less likely to get an A minus or better in their major field of study.
2. Data
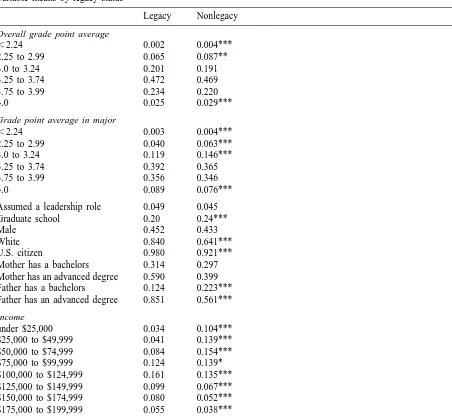
In the spring of 1998, a sample of seniors from 27 private, selective institutions were asked a series of questions about their background, experiences over the past 4 years, and plans for the immediate and long term future. Among the questions asked were the individual’s overall grade point average, and grade point average in his or her major. Responses were categorized as less than or equal to 2.24 (C or below), 2.25 to 2.99 (B minus / C plus), 3.0 to 3.24 (B), 3.25 to 3.74 (B plus), 3.75 to 3.99 (A minus), and 4.0 (A). Additionally, each individual was asked if his mother, his father, or both attended the institution. A total of 16,136 individuals responded to the survey. Individuals who did not respond to any of the variables used in this analysis or whose responses were inconsistent were excluded from the sample. This left 11,867 respondents; 964 legacies (either or both parents attended the institution from which the student was graduating), and 10,903 nonlegacies. Table 1 presents variable means by legacy status.
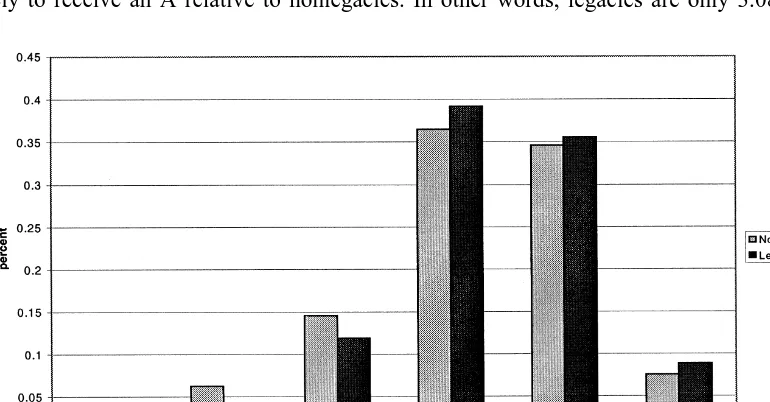
A comparison of the percentage of legacies versus nonlegacies in each grade category in Fig. 1 reveals that legacies performed nearly as well as their counterparts in overall GPA. While legacies were slightly less likely to have a 4.0 average, they were more likely to have a 3.0 to 3.99 GPA, and less likely to have a GPA less than 3.0. Fig. 2 illustrates that legacies clearly outperformed nonlegacies within their major. In this case, legacies were more likely to have a 3.25 or better GPA in their major, and less likely to be below a 3.25 in their major. Prima facie it appears that legacies receive higher grades than the rest of the student body.
These broad comparisons may be misleading for a number of reasons. It may be that certain institutions have a high percentage of legacies and grade inflation. This may lead to an exaggeration of the academic performance of legacies across institutions. Additionally, because legacies are much more likely to be white, high income, U.S citizens, whose parents are highly educated (of course) it is to be expected that they perform well academically (see Table 1). Legacies may also be more likely to major in ‘easier’ subjects and thus have an inflated grade point average. The question is how well do legacies perform relative to comparable nonlegacies?
1
Table 1
Assumed a leadership role 0.049 0.045
Graduate school 0.20 0.24***
Male 0.452 0.433
White 0.840 0.641***
U.S. citizen 0.980 0.921***
Mother has a bachelors 0.314 0.297 Mother has an advanced degree 0.590 0.399 Father has a bachelors 0.124 0.223*** Father has an advanced degree 0.851 0.561***
Income
Means are significantly different at the ***1%, **5%, *10% level.
3. Empirical results
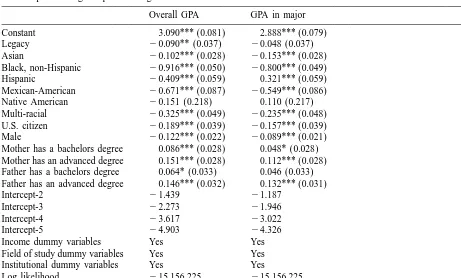
In order to estimate the probability that a legacy will receive a certain grade relative to a nonlegacy I perform ordered probits. I regress overall GPA and GPA in one’s major field of study on dummy variables for legacy, race, citizenship, mother’s education, father’s education, parental income level, field of study, and institution. The results are presented in Table 2.
Fig. 1. Overall grade point average.
although the coefficient on the legacy dummy variable is not significantly different from zero at conventional levels. Using the estimated coefficients from Table 2 multiplied by the variable means, I am able to calculate the change in probability that a legacy receives a certain grade relative to a nonlegacy. Table 3 presents these results. While legacies are less likely to receive a 3.25 or better in overall GPA, the magnitude of this likelihood is quite small. In particular, legacies are only 0.45 percent less likely to receive a B plus, 2.21 percent less likely to receive an A minus, and 0.42 percent less likely to receive an A relative to nonlegacies. In other words, legacies are only 3.08 percentage
Table 2
a
Ordered probits of grade point average
Overall GPA GPA in major
Constant 3.090*** (0.081) 2.888*** (0.079)
Legacy 20.090** (0.037) 20.048 (0.037)
Asian 20.102*** (0.028) 20.153*** (0.028)
Black, non-Hispanic 20.916*** (0.050) 20.800*** (0.049) Hispanic 20.409*** (0.059) 0.321*** (0.059) Mexican-American 20.671*** (0.087) 20.549*** (0.086) Native American 20.151 (0.218) 0.110 (0.217) Multi-racial 20.325*** (0.049) 20.235*** (0.048) U.S. citizen 20.189*** (0.039) 20.157*** (0.039)
Male 20.122*** (0.022) 20.089*** (0.021)
Mother has a bachelors degree 0.086*** (0.028) 0.048* (0.028) Mother has an advanced degree 0.151*** (0.028) 0.112*** (0.028) Father has a bachelors degree 0.064* (0.033) 0.046 (0.033) Father has an advanced degree 0.146*** (0.032) 0.132*** (0.031)
Intercept-2 21.439 21.187
Intercept-3 22.273 21.946
Intercept-4 23.617 23.022
Intercept-5 24.903 24.326
Income dummy variables Yes Yes
Field of study dummy variables Yes Yes Institutional dummy variables Yes Yes
Log likelihood 215,156.225 215,156.225
Number of observations 11,867 11,867
a
Standard errors are in parentheses.
Significant at the ***1%, **5%, *10% level.
points less likely than nonlegacies to receive an overall GPA of 3.25 or higher. A similar pattern holds for GPA within the major. Legacies are 1.86 percentage points (1.2910.57) less likely than nonlegacies to receive a GPA of 3.75 or higher within their major.
4. Summary
As competition increases for scarce slots in the freshman classes of selective institutions of higher education, the decisions and procedures of admissions offices are coming under heightened scrutiny.
Table 3
Change in the probability of receiving each grade if one is a legacy
#2.24 2.25–2.99 3.0–3.24 3.25–3.74 3.75–3.99 4.00
Overall grade
point average 0.07% 1.3% 1.7% 20.45% 22.21% 20.42%
Grade point
The practice of providing preferential treatment to relatives of alumni / ae has already come under harsh criticism. While this paper does not address the impact of legacy status on admission probabilities, nor will the data allow such an analysis, it does provide insight into the academic performance of legacies upon admission to a set of private, highly selective institutions.
I find that, in comparison to the overall student body, legacies perform at least as well, if not better, than their nonlegacy counterparts. This is true for the student’s overall GPA, and GPA in one’s major. Because legacies are much more likely to be white, affluent, and have college educated parents it is to be expected that legacies perform well academically. Conditional on individual, institutional, and familial characteristics, however, legacies do not do as well in the classroom as their nonlegacy counterparts. Legacies are less likely to receive a B plus or better in overall GPA, although the magnitude of this effect is quite small. While previous studies have found significant preferential treatment of legacies in the admissions process, it does not appear that they are generally ‘unprepared’ for the academic rigors to which they are accepted.
References