ANALYSIS
A framework for the economic evaluation and selection of
sustainability indicators in agriculture
David J. Pannell *, Nicole A. Glenn
Agricultural and Resource Economics,Uni6ersity of Western Australia,Nedlands6907,Australia Received 20 April 1998; received in revised form 9 September 1999; accepted 4 October 1999
Abstract
In recent years, the concept of ‘sustainability indicators’ has become prominent in agricultural science. The idea is that particular characteristics of resources are monitored and recorded, with the intention that this information serves as an aid for decision making by farmers and/or policy makers. A great many sustainability indicators have been proposed by agricultural scientists. However, there is no guidance currently available as to which of the possible sustainability indicators provide information of economic value. In this paper we present a conceptual framework for the economic valuation and prioritisation of sustainability indicators. The framework is based on Bayesian decision theory, particularly its use to calculate the value of information under conditions of uncertainty. We present an illustrative numerical example. Based on this example and the theoretical framework, we identify a number of important insights about the practical use of sustainability indicators. © 2000 Elsevier Science B.V. All rights reserved.
Keywords:Sustainability indicators; Economic valuation; Bayesian decision theory; Management decisions
www.elsevier.com/locate/ecolecon
1. Introduction
The concept of sustainability apparently has great appeal with regard to environmental and resource management, yet its applicability in prac-tical decision making is hampered by the ambigu-ity of its meaning, and the multiplicambigu-ity of definitions that have been proposed (Pannell and
Schilizzi, 1999). The idea of sustainability indica-tors seems to have grown out of a recognition that sustainability cannot be condensed to a single simple definition. Its multifaceted nature can be dealt with by monitoring a range of indicators of different types. Hence, in recent years terms such as ‘sustainability indicators’ and ‘environmental indicators’ have increasingly been used (e.g. Lefroy and Hobbs, 1992; Standing Committee on Agriculture and Resource Management, 1993; Mannipieri, 1994; Oades and Walters, 1994; * Corresponding author. Fax: +61-8-98928496.
E-mail address:[email protected] (D.J. Pannell)
Pankhurst et al., 1995; Kellogg, and Goss, 1997; Ministry for the Environment, 1997).
The idea of promoting the monitoring of sus-tainability indicators has been embraced by many people concerned with promoting adoption of more sustainable land-management practices. Pannell and Schilizzi (1999) argued that sustain-ability indicators are a practical and reasonable vehicle for attempting to deal with the multi-faceted nature of the ambiguous term ‘sustainabil-ity’. A great many sustainability indicators have been proposed in the existing literature. Examples relevant to agriculture include:
Microbial biomass within the soil
Organic matter in soils
Protein levels of crops
Diversity of production
Earthworm density in soil
Pesticide usage
Soil pH
Effective crop root depth
Depth to groundwater table
Most of the proposed indicators are strongly technical in focus, with no close link to manage-ment decisions. It has been recognised that the types of indicators most useful for different groups of users (e.g. on-farm and off-farm) are likely to differ, but the nature of the differences has not been explored. This appears to reflect a lack of emphasis on actual decision making in the literature so far.
There have been attempts to persuade farmers to monitor and use sustainability indicators, but it is clear that the attempts have failed.1
Given the lack of a management focus of most indicators proposed so far, this is not surprising. It may also be related to the ad hoc nature of the criteria for selection of indicators that have been proposed so far. The criteria do not appear to have been based on a consistent, underlying conceptual frame-work.
In this paper we argue that the value of a sustainability indicator springs from its potential to improve decision making, and so it is best thought of as a source of information. We present a conceptual framework, based on decision theory and standard information theory, to help guide thinking about the values of potential indicators. We present a simple numerical example from Australian agriculture to illustrate the issues and highlight a number of insights arising from the example and the framework itself. Finally, we make initial, tentative suggestions about criteria that are most likely to identify indicators that would be the most valuable to monitor. As a result of our conceptual framework, the set of criteria we suggest is somewhat different to any already in the literature. The scope of our analysis is intended to be broad. Although illustrated with specific examples, it should be apparent that the principles identified are relevant to any monitor-ing that is used to inform decisions involvmonitor-ing continuous or approximately continuous decision variables. We do not believe that it is limited in relevance to developed countries or to primarily economic decisions.
2. Conceptual framework for choice of indicators
From the perspective of agricultural policy, there are two broad decisions to make: which indicators to recommend and promote to farmers, and which indicators to collect to assist in policy making. As recognised by some in the literature, these sets of indicators are likely to differ. Given the differences in decision problems faced by these two sets of decision makers, we believe that the sets of indicators are likely to differ substantially, potentially with little or no overlap between them. In choosing indicators to recommend to farm-ers, it has to be recognised that whatever is rec-ommended to them, farmers will make their own, independent choices based solely on their own perceptions about whether indicators are worth monitoring. Even so-called ‘minimum’ indicator sets published so far seem a long way from this recognition in that they make unrealistically large demands on farmers’ time and energy. In later
1For example, a survey of farmers in the upper Kent River
parts of this paper, we will be exploring the factors that are most likely to promote a percep-tion that an indicator is worth monitoring.
2.1. Costs and benefits of monitoring sustainability indicators
The fundamental criterion for choosing to mon-itor an indicator is that the benefits from doing so must exceed the costs. A decision maker (either farmer or policy maker) should choose to monitor the set of indicators for which the total benefits exceed the total costs by the greatest absolute amount.
Costs are relatively straightforward to concep-tualise. They include:
direct financial costs of equipment, materials and analysis;
the opportunity cost of the time spent on the monitoring process (meaning the benefits which are foregone by virtue of one not being able to spend that time in some other way). Benefits potentially include:
improved decision making, either by farmers or policy makers;
increased awareness or understanding among farmers of the potential importance of issues for which monitoring is being conducted. Even the benefit of ‘increased awareness or understanding’ is desirable primarily because it may lead, in the longer term, to improved deci-sion making. It seems extremely unlikely that society as a whole or individual farmers would be willing to invest in a program of monitoring sustainability indicators purely for the sake of interest. Although they may well find the issues of interest from an intellectual point of view, they would be interested primarily in averting damage to or degradation of natural resources; in other words, in improved decision making about the management of those resources.
The benefits of improved decision making are indirect. They may spring, for example, from greater economic returns, from better achieve-ment of social welfare objectives (e.g. intergenera-tional equity) or from protection of ecological systems which may have extrinsic value (e.g. by increasing economic output) and/or intrinsic value
(e.g. through intrinsic ‘rights to exist’). We will tend to focus on economic benefits in the remain-der of this paper. While this objective is impor-tant, we do not imply that other types of benefits are unimportant or unattainable. Indeed, our framework could, in principle, be applied in the pursuit of non-financial payoffs.
Whatever the underlying benefits, the key point is the indirectness of benefits arising from im-proved decision making. This is fundamentally different to benefits arising, for example, from a new production technology. The benefits of moni-toring sustainability indicators arise solely from changing decisions about which of the existing production technologies should be used. This has profound implications, as we will see below.
With this clarified, we can recognise that the question of the value of monitoring a sustainabil-ity indicator is, at heart, a question about the value of information. There is a well-developed literature on the value of information that ap-pears so far to have been completely ignored in discussions of the choice of sustainability indica-tors. This is unfortunate because we believe that this literature offers a number of important in-sights that greatly help to clarify thinking about the issue. In Section 3, we outline a conceptual framework for valuing a sustainability indicator based on the standard literature on information value.
3. A conceptual model for estimating the value of a sustainability indicator
farm-ers or government. We see no point in this. To the extent that they are perceived to be of value, they are already widely monitored, and their inclusion in sustainability-indicator programs is most un-likely to change this. The point of a sustainability-indicator program is surely to focus on issues that are much more of a long-term nature, on the basis that this may have been neglected historically. That seems to us to be the only basis on which a renewed effort to promote monitoring can be justified.
To a farmer, the gross benefit of monitoring a sustainability indicator depends primarily on the scale of production to which it is relevant (e.g. the area of land for which the information is useful) and the benefit per unit of production (e.g. the benefit per hectare of relevant land). For a gov-ernment, there is an additional consideration in the level of adoption that is achieved (e.g. the number of farmers who choose to monitor the indicator and the area over which they apply the results). However, it has been found that adoption is strongly affected by the economic benefits of the technology or practice (e.g. Lindner, 1987), so adoption and benefit per unit are closely related. Section 3.1 outlines a conceptual framework for valuing benefit per unit.
3.1. The 6alue of information from a
sustainability indicator
Throughout this paper, the term ‘value’ is used in the sense of an economic or financial value. To avoid confusion, we will refer to the ‘level’ of an indicator to denote its measured physical magnitude.
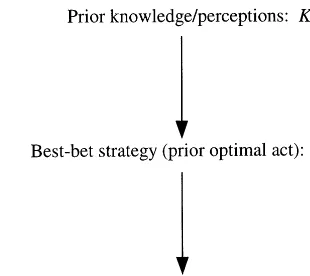
Anderson et al. (1977) provided a description of the standard theoretical framework for calculating the value of information, focusing on its applica-tion in agriculture. The framework is based on ‘Bayesian decision analysis’ or ‘Bayesian decision theory’. In this approach, the value of informa-tion arises from its capacity to reduce uncertainty about the state of the world, leading to decisions that have a higher expected payoff (using ‘ex-pected’ in the statistical sense of a weighted aver-age and ‘payoff’ to mean the contribution towards any desired outcome, not necessarily
Fig. 1. Use of knowledge prior to obtaining additional infor-mation.
financial). Uncertainty is represented explicitly as probabilities of different possible states of the world being the true state. For example, a farmer may be uncertain about the current depth of a rising saline, ground-water-table. Each of the pos-sible depths is assigned a probability, with the probabilities of all possible depths summing to 1, thus representing a probability distribution. The relevant probabilities are those estimated subjec-tively by the decision maker (the farmer or policy maker). Clearly, the probability distribution of possible states of the world is representative of the decision maker’s perceptions, not necessarily of any objective reality. If the objective reality could be determined, it would be represented as a prob-ability of 1 for the single true state of the world and 0 for all others. In practice, the objective truth is never known; we can only deal with different degrees of uncertainty.
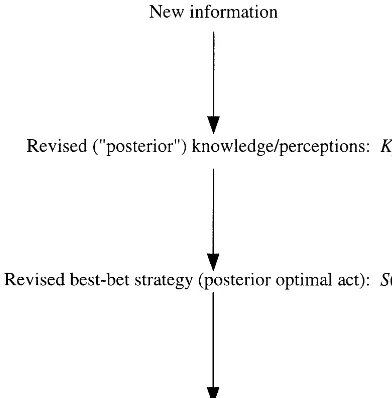
Fig. 2. Use of additional information to modify strategy and increase expected payoff.
tions) of the prior optimal act. In other words, the new level of knowledge is used to evaluate the prior strategy (S0), even though the old knowl-edge was used to select that strategy. That is why the second term in Eq. (1) is p(S(K0), K1), rather thanp(S(K0),K0). If we did not do the evaluation this way, the decision maker might appear better or worse off as a result of the information, even if it did not change the optimal decision. This would clearly be nonsensical, since the objective truth about the biophysical world is not altered by changing a decision maker’s level of uncertainty about it.
Now, GVOI1 is the result for just one possible observed level of the sustainability indicator. In reality, there are many possible levels, and before making an observation a decision maker does not know what the level is going to be. In order to put a likely value on the informationbefore we ha6e it,
we have to rely on subjective estimates of the probabilities that the indicator will take each of its possible levels. Suppose that there aren possi-ble levels of the indicator and P(Ii) gives the subjective probability of observing level Ii. Then the expected gross value of collecting information on I (evaluated before actually collecting the in-formation) is:
E(GVOI)=%i=1...n(p(Si,Ki)−p(S0,Ki)) ·P(Ii)
(2)
This forward-looking perspective, incorporating uncertainty about what the level of the indicator will be once it is observed, is the correct one to use for a decision maker attempting to decide whether or not it is worth investing in monitoring a sustainability indicator.
4. Requirements to operationalise the model
This section is an outline of the steps that are necessary to calculate the value of information in practice. It is intended to provide a more concrete understanding of the process so that its implica-tions can be readily understood.
Now imagine that the farmer observes a sus-tainability indicator, such as the soil pH in the surface layer. The indicator could conceivably take any of a large number of levels.2 Suppose that when the farmer observes it, the level is I1. Having made this observation, the farmer revises his or her perceptions of the problem toK1 (Fig. 2). The result is a new, ‘posterior, optimal act’ [S(K1)] and a new expected payoff based on the new strategy and the new knowledge [p(S(K1),
K1)].
How much better off is the farmer given that he or she has observedI1? Call this the gross value of information for level I1 (GVOI1).
GVOI1=p(S(K1),K1)−p(S(K0),K1) (1)
Note that in calculating the improvement in pay-off, it is necessary to allow for the fact that the new information may have changed perceptions about the expected payoff for the prior optimal act. One makes this allowance by comparing (a) the expected payoff for the new best-bet strategy with (b) the revised payoff (based on new
percep-2It could take any of an infinite number of levels if it is a
4.1. The basic elements of a risky-decision model
This description is based on the example of a farmer’s decision problem, but a similar process applies to a policy maker.
1. What are the feasible decision options? (e.g. different rates of lime which could be applied this year).
2. What are the relationships between elements of the decision problem? (e.g. between soil pH and crop yield). What are the values of parame-ters for these relationships? (e.g. slopes of biologi-cal relationships, costs of inputs).
3. What are the values of exogenous variables (e.g. prices) and the initial values of endogenous variables? (e.g. current soil pH).
4. A ‘state’ is a single possible set of answers to questions 2 and 3. What are all the possible states? (e.g. different levels of current soil pH, different costs of lime, different relationships be-tween pH and yield) and what are the farmer’s current subjective perceptions of their probabilities?
5. For each decision option in each state, what is the payoff? (e.g. for each possible soil pH and each rate of lime application, what would be the stream of income in this year and future years?)
6. Given 1 – 5, which decision option gives the highest expected payoff, using ‘expected’ in the statistical sense to mean a weighted average? (e.g. which lime rate gives the highest expected value of economic benefit when all of the possible states are weighted by their subjective probabilities given in step 2?)
4.2. Making use of the information from monitoring a sustainability indicator
7. Observe the level of the sustainability indica-tor (e.g. measure the pH of the soil surface).
8. For each possible state of the world, in the judgement of the decision maker, how likely is it that the level observed in 1 would be observed?
(e.g. for each possible profile of aluminium con-centrations in the soil, what is the probability that a measurement of surface pH will yield the level which was observed?)
9. Based on these likelihoods, use Bayes’ rule to modify the probabilities of the different states. In the original risky decision, the probabilities of step 4 would be altered, but the definition of possible states (steps 1 – 4) and their payoffs (step 5) would be unaltered.
10. Given the new probabilities of states, what is the new best-bet strategy? (e.g. given the mea-sured surface pH, what is the new optimal lime rate?)
Fig. 2 was a simple representation of this phase of the process.
4.3. Calculating the 6alue of information from
monitoring a sustainability indicator
11. What are the possible levels of the indicator, and what are farmers’ prior subjective estimates of the probabilities of observing each of them? (e.g. what are the probabilities of observing the different possible surface pH levels at the particu-lar site in question?)
12. For each possible level of the indicator, repeat steps 7 – 10 and record the expected payoff (e.g. for each plausible surface pH level which could be observed, calculate the lime rate which would be optimal were that pH to be observed, and record the expected economic payoff in each case).
13. For each possible level of the indicator, calculate the expected payoff if that level were to be observed but the farmer continued to use the optimal strategy from step 6 (e.g. for each plausi-ble surface-pH level which could be observed, calculate the expected economic payoff if the farmer used the optimal lime rate from step 6).
15. Weight the increases (from step 14) by the probability of observing each indicator level (from step 11) and add them up to give the expected gross value of observing the indicator. If appro-priate, scale this up to the value relevant to the whole farm.
16. Subtract the costs of monitoring the indica-tor to give the expected net value of observing the indicator.
The process outlined above is, of course, not specific to a sustainability indicator. It is relevant to any variable or indicator that is used as an input to decision making. Our message is that this very general framework, well recognised within operations-research and decision-analysis fields, is highly relevant to the consideration and evalua-tion of sustainability indicators as well.
5. The importance of uncertainty in the process
Uncertainty is central to the process of using and valuing a sustainability indicator. For one thing, it is present throughout the decision prob-lem. For example, the decision maker faces uncer-tainty about:
the magnitudes of particular biophysical variables;
the relationship between the level of an indica-tor and the magnitudes of particular physical variables;
the effects of these variables on production;
the impact of decision choices on production; the effects of the uncertain biophysical
vari-ables on the impact of decision choices on production.
It is notable that in the case of many sustain-ability-related problems, the levels of uncertainty are particularly high. For example, in the Western Australian wheat/sheep belt, at the policy level it is not known with any precision how much land is at risk of dryland salinity in the long run.3At the farm level, because of the complexity and low
observability of sub-surface geological structures, it is not known how variations in the area of trees, their density and their spatial layout will affect the incidence of salinity on any particular farm.
The next important feature of uncertainty is that it is the source of the value from monitoring sustainability indicators. The whole purpose of the monitoring is to reduce uncertainty. It is true that the purpose is not described in these terms in existing publications, but it is clear from our conceptual framework that it is so.
Paradoxically, the high level of uncertainty also exerts a negative influence on the value of moni-toring a sustainability indicator. The reason is that, in order to be able to use a sustainability indicator to modify decisions, the decision maker has to be able to tell how different values of the indicator affect the relative payoffs of different strategies. If there is too much uncertainty in the system, it is likely that reductions in uncertainty about the variable being measured do not trans-late into reductions in uncertainty about the pay-offs of different strategies. In terms of the framework, this would be reflected in the distribu-tion of the likelihoods, representing the probabili-ties of different states given a particular value of the sustainability indicator. The likelihoods of different states would be similar, so that observing the indicator does not help to pinpoint the true state.
6. A numerical example
This example is greatly simplified in order to focus on the principles involved, rather than the technical details. The process and principles are very general in their relevance.
The example is a stylised version of a serious problem faced by many farmers in Western Aus-tralia: soil salinisation from a rising saline water table. The salinity in the groundwater is due to an accumulation of salts in rain water over millions of years. The rise in the water table is occurring because current agricultural crops and pastures allow higher amounts of the rain that falls to undergo deep drainage to the water table.
3This is not to say that estimates of the extent of salinity
6.1. Decision 6ariable
The farmer must choose the area of land that should be planted to trees, which have a lower rate of deep drainage and so can delay or prevent the water table reaching the surface. The rotation length for trees is 10 years. To simplify the prob-lem, it is assumed that the decision on tree area is made once for the whole farm and cannot be revised until the end of the rotation. Land not devoted to trees is used for production of wheat, unless there is saline land on the farm, in which case the area of wheat is reduced by the area of saline land.
6.2. Relationships and constraints of the model
The area of saline land in year tis given by
St=max(A*(b1−b*D2 1), 0) (3)
whereSis saline area,Ais total arable area,Dis depth of water table and b1 and b2 are parame-ters. The water table depth at a particular point in year t is given by
Dt=Dt−1+Rt (4)
where R is ‘recharge’ or deep drainage, which is given by
Rt=b3−b*T4 (5)
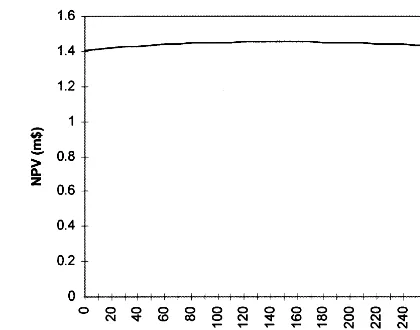
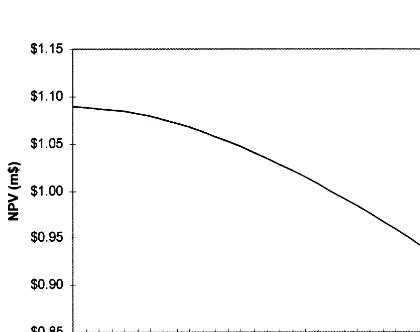
Fig. 3. Payoff for deterministic model (discount rate 10%). where T is the area of trees and b3 and b4 are parameters. The area of trees, saline land and wheat (W) must sum to the total arable area.
W+T+S=A (6)
6.3. Numerical assumptions
Table 1 shows the assumed values of biophysi-cal parameters, prices, costs, initial endogenous variables and scale.
6.4. Other assumptions
Results are compared for two discount rates: 10% and 15%. The time period used for the analysis is 20 years. The objective of the farmer is assumed to be maximisation of the overall eco-nomic return from the farm over 20 years, mea-sured as the net present value (NPV). The benefits of trees in the model include direct financial re-turns for harvested wood, and indirect benefits from reducing deep drainage, thus reducing the threat of salinity.4 With the parameters used, it is possible to completely avoid loss of land to salin-ity if the area of trees is large enough (250 ha for the standard assumptions). However this benefit must be weighed up against the costs of trees, Table 1
Numerical assumption used in the model
Description Level
Initial6alue of endogenous6ariable
5000 Initial water table depth (mm)
Biophysical parameters
0.5 b1(proportion)
b2(proportion/mm depth) 0.0005
b3(mm) 500
b4(mm/ha trees) 2
Wheat yield (t/ha) 1.5
Prices and costs
Wheat sale price ($/t) 200 Wheat production costs ($/ha) 100 1000 Tree establishment cost ($/ha)
3000 Tree sale price after 10 years net of harvest
and transport costs ($/ha)
4There may, of course, be additional benefits and costs
Table 2
Expected value of information for salinity example Discount rate
Indicator Expected value of infor-(%) mation ($/ha/year)
2.65
Both 10
15 0.00
Both
0.45 10
Water table depth
2.00 10
Deep drainage
relative steepness in Fig. 4. These are both impor-tant influences on the value of information, as we shall see.
6.5. Types of information
We assume that the farmer is interested in collecting information about either or both of two uncertain variables: the initial water table depth, and the rate of deep drainage per year if no trees are planted (which is given by parameter b3). For simplicity, all parameters and relationships apart from these two are assumed to be non-stochastic and known with certainty.
Prior probability distributions for the two un-certain variables were specified, giving a range for initial water table depth between 3 – 7 m, and a range for b3between 100 – 900 mm per year. The two distributions were assumed to be statistically independent. In the interest of brevity, the numer-ical details are not given here but are available in a technical appendix from the senior author, or from the world wide web (http:// www.general.uwa.edu.au/dpannell/indicapp.htm).
The sources of information are assumed to be observations at a particular point which provide an indication of the levels of the variables across the whole farm. Likelihoods associated with these observations were specified, and are also available in the technical appendix. They were set at levels that represent a reasonably high ability to learn about farm-wide values on the basis of observations at a point, and so would tend to favour high economic returns from the monitor-ing process.
The full process of estimating the value of the monitoring process was undertaken for four sce-narios: (a) observe both indicators, and use a 10% discount rate; (b) observe both indicators, 15% discount rate; (c) observe only water table depth, 10% discount rate; and (d) observe only the an-nual rate of deep drainage, 10% discount rate.
6.6. Results
The results shown in Table 2 have been con-verted to annuities, and expressed as per hectare of the farm.
which consist of the direct establishment costs ($1000 per ha every 10 years) and the opportunity cost of productive crop land. The opportunity cost arises because the area of crop must be reduced to make room for trees, so that some crop income is foregone. We assume that the farmer is not concerned whether the source of income is trees or wheat, but wishes only to maximise the NPV over 20 years.
Fig. 3 and Fig. 4 illustrate the payoffs for different areas of trees for two different discount rates. These results are for a deterministic version of the model (i.e. excluding any risk or uncer-tainty). The areas of trees shown are for years 1 – 10 of the decision period. For the purposes of these figures only, it is assumed that the area of trees in years 11 – 20 is zero (although this is not optimal in most cases). Note in particular the flatness of the payoff curve in Fig. 3 and its
Some may be surprised at the low magnitudes of the values given in Table 2. We would emphasise that we have represented salinity as the very serious threat that it is. We assumed that when land changes from crop land to saline land, it suffers a drop in annual net revenue from $200/ha to zero. In the absence of trees, 50% of the total farm land goes saline. The average time for this to occur over the 25 scenarios modelled is 12 years. To put the results in context, if it were possible to costlessly remove the threat of salinity, the expected gain for a 10% discount rate would be $29.00/ha year−1
over the whole farm, more than ten times as much as the highest value generated by improved decision mak-ing from monitormak-ing of sustainability indicators.
Also, the indicators in this example are quite closely related to the management problem, and the other parameters and relationships of the model are assumed to be known with certainty and with perfect accuracy. Thus, although they seem low, the results in Table 2 are likely to be overstatements of realistic values.
There are different reasons for the low values in the two cases, 10% and 15% discount rates. We noted that in the 10% case, the payoff function is very flat (Fig. 3). This means that even if the farmer has an area of trees which differs substantially from the true optimum, the loss of profit relative to the optimum is low. Since the benefits of sustainability indicators arise from refining decisions, if refining decisions does not make much difference to the payoff, the value of monitoring the indicator is low. It might be questioned how the payoff curve could be so flat in a situation where the impact of salinity is so large and adverse. The reason is that although salinity is costly, the treatment available to deal with salinity is also costly. In the case of a 10% discount rate, the two costs are fairly evenly bal-anced.
On the other hand, with a discount rate of 15%, the optimal choice is so clear that there is no conceivable information that would alter it. Since the information cannot alter the decision, it has zero value.5
This leaves us with a serious conundrum if we are seeking cases where the payoff to monitoring a sustainability indicator is likely to be high. If the treatment is either highly advantageous or clearly uneconomic, the best decision is obvious and the value of any further information will be low. However, if the benefits and costs of treatment are similar enough so that the optimal decision is unclear and can be clarified by further information, then the overall payoff curve is likely to be flat, so that again the information is of limited value. This cleft stick is absolutely ines-capable.
Again, we note that this result is not specific to sustainability indicators. It applies to many types of information relevant to management decision mak-ing. For example, the flat payoff curve depicted in Fig. 3 is commonly observed in many agricultural input decisions, such as fertiliser rate decisions (e.g. Anderson, 1975).
7. Insights on the value of a sustainability indicator
Some key insights are suggested here, based on an understanding of the elements and structure of the framework or on the numerical example pre-sented above. The first set of insights is very general and relates to the whole process of valuing a sustainability indicator.
1. Calculating the value of a sustainability indica-tor is complex and difficult.
2. The value arises purely from changing a deci-sion maker’s management choices. If an indicator does not have the potential to change a manage-ment choice, it has no value, economic, social or environmental, other than perhaps its intrinsic-in-terest value. If there is no management option which can economically address the sustainability problem when it reaches a bad enough level, then there is no prospect of changing management as a result of monitoring. Consequently, in this situa-tion there is no value to the manager of a sustain-ability indicator for this problem. We believe that
5If the model is solved for a sufficiently low interest rate,
this applies in some regions for some prominent agricultural resource management problems.
3. The change in management, if it occurs, is the result of a reduction in uncertainty about the impacts of different management strategies. The reduction in uncertainty allows the decision maker to refine his or her best-bet strategy.
4. Uncertainty is subjective and personal. For this reason, the value of a sustainability indicator is necessarily subjective and personal.
5. To calculate the value of a sustainability indicator, it is necessary to be able to determine the farm management strategy that is optimal from the farmer’s perspective in a given context.
6. There is likely to be wide variation between the values of different sustainability indicators in a given situation, and wide variation in the value of a given sustainability indicator in different situations. It is not possible to conclude that monitoring indicators is, in general, a good thing. Each has to be assessed separately in different regions and farming systems.
7. In many cases, the value of continuing to monitor would fall over time as uncertainty is reduced. In some cases, the value of observing a sustainability indicator may be dramatically re-duced after a small number of observations, po-tentially just one. This applies particularly to cases where the value of the indicator is derived from improved qualitative understanding of the system. Once this understanding is obtained, fur-ther monitoring has little or no additional value of this type. This is not necessarily a bad thing, but it does mean that farmers are unlikely to be willing to invest in regular ongoing monitoring of sustainability indicators unless the results feed directly and quantitatively into ongoing manage-ment decisions. Many of the indicators proposed in the literature are more of the qualitative, ‘raising-awareness’ type than the quantitative ‘on-going-management’ type. An important point about the benefit of ‘raising awareness’ is that it is likely to be considered to be more important by policy makers than by farmers. From a farmer’s point of view, the benefits of becoming aware of a
new area of knowledge are highly speculative and uncertain prior to the event. Many will choose not to invest in monitoring merely for the sake of relatively nebulous benefits from increased awareness.
The next set of observations deals with factors that influence the magnitude of the value of mon-itoring a sustainability indicator.
8. The gross value of a sustainability indicator (the value before deducting the cost of monitoring the indicator’s level) can never be negative. At worst, its value would be zero if there was no realistic probability of any change in management resulting.
9. A necessary (but not sufficient) condition for the value of monitoring an indicator to be high is for productivity to be sensitive to management choices. Situations where the payoff curve is rela-tively flat seem to be not uncommon in agricul-ture. In these situations, the benefits of monitoring sustainability indicators are relatively low, since they can have little impact on the payoff even if they do lead to changed management.
10. If productivity is very sensitive to manage-ment choices, the optimal choice may be so obvi-ous that there is little value in collecting further information about it.
11. The greater the current level of uncertainty about a variable, the greater is the value of moni-toring, provided that monitoring does lead to reductions in uncertainty.
12. The greater the degree of uncertainty about the consequences of different management strate-gies, the lower will be the value of a related indicator.
scale, the economic value of monitoring the indi-cator will be low, since monitoring will not reduce the uncertainty inherent in the decision.
14. The larger is the scale to which a sustain-ability indicator is relevant, the larger will be the value of monitoring it.
15. Monitoring a sustainability indicator in-volves an up-front cost with benefits occurring at some later time. This means that the decision maker’s discount rate may be an important influ-ence on the value of an indicator. The discount rate represents the rate at which the dollars in the future must be discounted to express them in terms equivalent to present-day dollars. Discount-ing is necessary to allow for the reality that if funds were not invested in monitoring, they could be invested in alternative money-making ventures and compounded over time.
The final two points deal with the idea of ‘thresholds’ for indicators, which have been con-sidered by some as the vehicle for operationalising the use of indicators.
16 Unless the management options are dichoto-mous, there is no sense in which a sustainability indicator has a threshold level (as supposed in some parts of the literature). There may be differ-ent optimal managemdiffer-ent strategies for many dif-ferent indicator levels.
17. Even if there are only two management options, the threshold indicator level for switching from one to the other is determined in an eco-nomic decision problem. This depends on the biological and physical relationships of the prob-lem, but in no way can be divorced from eco-nomic considerations. Consequently it is pointless to attempt to determine threshold indicator levels based only on biological or physical criteria.
We highlight the points relating to uncertainty as being particularly important in the use and valuation of indicators, but particularly neglected in existing discussions about sustainability indica-tors. This neglect appears to arise from the lack of a focus on decision making.
8. How do other suggested criteria relate to our framework?
As noted earlier, there have been a number of attempts to specify criteria for selection of sus-tainability indicators, but the criteria have gener-ally been selected on an ad hoc basis, rather than on the basis of their consistency with a sound conceptual framework. Most (but not all) of the criteria with intuitive appeal to previous authors do, nevertheless, make sense within the frame-work proposed here. To illustrate, consider the criteria suggested by Walker and Reuter (1996).
1. Ease of capture of the information by a non-specialist.
2. Total cost of monitoring per hectare. 3. Existence of a standard method of
estimation.
4. Interpretation criteria (e.g. desired levels or threshold levels) are available.
5. Significant at the catchment scale. 6. Low error associated with measurement. 7. Known response to land management or
disturbance.
8. Stable over the period of measurement. 9. Trend indicators are mappable.
10. The indicators are ‘generic’ (providing a gen-eral picture about environmental health) or ‘diagnostic’ (more specific to a problem or trend). (this does not appear to be a criterion as such, but a method of categorisation). 11. Context data (e.g. information on soils,
cli-mate, etc.) can be expected to be available (this also does not appear to be a criterion for selecting among alternative indicators, since the context data would be equally avail-able for all possible indicators in a given context. It may be useful when choosing be-tween regions or sites to monitor).
Item 4 is an attempt to relate the indicator to a decision process. While it is positive that this attempt was made, the concept of the decision process held by Walker and Reuter (1996) and others (e.g. Syers et al., 1995) is the following three steps: (a) measure/observe the levels of a set of indicators; (b) compare their levels to pre-defined desired levels or threshold levels; (c) if observed levels deviate from desired levels or ex-ceed threshold levels, act accordingly. This is flawed as a concept of how information is used in management because in, reality, ‘desired’ levels of sustainability indicators are artefacts of the selec-tion of the optimal management strategy, not fixed, immutable levels based on biological or physical considerations (as seems to be implied). Because of this, ‘desired’ levels are, in part, func-tions of their current levels as well as of output prices, input costs, yields, resource constraints and the farmer’s personal objectives.
Contrast the concept of Walker and Reuter (1996) with the framework proposed here: (a) observe the levels of sustainability indicators; (b) revise perceptions about the problem; (c) identify the optimal ‘best-best’ strategy given the new perceptions; and (d) implement the new strategy. This process is consistent with the process used in the existing monitoring of variables such as out-put price. It does not make sense to consider that there is a ‘desired’ price. Nor is there normally a threshold price which defines a once-and-for-all change in management. Rather, every possible price has its own consequences for management — management choices change almost continu-ously as prices change. This is how most sustain-ability indicators should be viewed.
Item 5 from Walker and Reuter’s list of criteria for selecting indicators is very specific to decisions at the catchment level. In reality, very few real decisions are made at the catchment scale. For farmers, the relevant scale is the whole farm, or sections thereof, while for decisions made by gov-ernments, the scale is almost always larger than a single catchment. This is not a denial that there are important resource management issues occur-ring at the catchment scale. It is a recognition that, notwithstanding the rhetoric of ‘integrated catchment management’, almost all decisions
about policy or management are made at higher or lower scales. Since we have been making a case that sustainability indicators must be closely linked to management decisions, linking sustain-ability indicators to a catchment scale is probably counter-productive.
This discussion highlights the importance of a sound conceptual framework for selecting indica-tors. Some criteria from an illustrative set pro-posed in the literature were found to be consistent with our framework, but others were not consis-tent, or were not criteria at all.
9. Suggested criteria for selecting indicators
Here we use the framework outlined above to suggest criteria for selecting sustainability indica-tors. One limitation of criteria proposed in the previous literature is that there has been no dis-tinction made between different types of choices for which criteria are needed. Here we suggest criteria that are most important for four different choices relevant to design of a program of pro-moting use of sustainability indicators to farmers. Criteria are needed for the choices between re-gions, between farms/sites, between resource man-agement problems and between alternative indicators for any given management problem. In each case, we indicate whether the criterion is desirable, highly desirable or essential for a given choice to be made.
9.1. Criteria for choosing between regions
Presence of a resource-management problem that meets the criteria below for choosing be-tween resource-management problems (essent-ial).
High degree of threat to the resource within the region (desirable).
Large scale of the threat to the resource within the region (desirable).
9.2. Criteria for choosing between farms/sites
Presence of a resource management problem which meets the criteria under the next heading (essential).
High degree of threat to the resource (desirable).
Context data likely to be available (desirable).
9.3. Criteria for choosing between resource management problems
In at least some situations, it is worth adjusting management or policy to deal with the problem (i.e. there is at least one effective and economic management option available) (essential). The payoff is somewhat sensitive to the
manage-ment option so that farmers benefit from its adoption (essential).
The payoff is not so sensitive to the management option that it is obvious whether the option should be adopted. That is, in at least some situations, it isnotworth adjusting management to deal with the problem (essential).
High degree of threat to the resource (desirable).
Large scale of the threat to the resource (desirable).
9.4. Criteria for choosing between indicators
High uncertainty about the level of the indicator to be monitored (desirable).
Low uncertainty about links between the indica-tor, management practices and production (highly desirable).
The indicator can be measured reliably and accurately (desirable).
Low cost of monitoring the indicator over the necessary scale (desirable).
We note that our criteria span a much broader range of issues than considered elsewhere. For example, the criteria proposed by Walker and Reuter (1996) are encapsulated within just three of our criteria, and they miss all of the criteria that we consider to be the essential ones.
10. Conclusion
In such a complex area as the development of programs to promote use of sustainability
indica-tors, it is essential to have a sound conceptual framework to use as the basis for evaluation and planning. This has been absent from past literature in the area. We have attempted to fill this gap, basing our framework on the view that sustainabil-ity indicators are primarily sources of information and that this information has value primarily as an input to decision making. The framework has revealed a number of important insights which should influence the choice of indicators for any given resource management problem. They should also influence decisions about the circumstances in which sustainability indicators should be moni-tored at all.
Acknowledgements
We thank two referees for their helpful com-ments, and the Grains Research and Development Corporation for funding the research project.
References
Anderson, J.R., 1975. One more or less cheer for optimality. J. Aust. Inst. Agric. Sci. 41, 195 – 197.
Anderson, J.R., Dillon, J.L., Hardaker, J.B., 1977. Agricul-tural Decision Analysis. Iowa State University Press, Ames.
Ferdowsian, R., George, R., Lewis, F., McFarlane, D., Short, R., Speed, R., 1996. The extent of dryland salinity in Western Australia. In: Proceedings of the Fourth National Conference and Workshop on the Productive Use and Rehabilitation of Saline Lands, 25 – 30 March 1996, Promeco Conventions, Perth, pp. 89 – 98.
Kellogg, R.L., Goss, D.W., 1997. Development of environ-mental indicators for use in macroeconomic models. J. Agric. Appl. Econ. 29, 77 – 86.
Kington, E., Pannell, D.J., 1999. Dryland salinity in the upper Kent River catchment of Western Australia: farmer per-ceptions and practices. Submitted for publication. Lefroy, T., Hobbs, R., 1992. Ecological indicators for
sustain-able agriculture. Aust. J. Soil Water Conserv. 5, 22 – 27. Lindner,.K., 1987. Adoption of diffusion technology: an
overview. In: B.R. Champ, E. Highley and J.V. Remenyi (Eds.), Technological change in postharvest handling in transportation of grains in the humid tropics. ACIAR Proceedings No. 19, pp 144 – 151.
P.R. (Eds.), Soil Biota: Management in Sustainable Farm-ing Systems. CSIRO PublishFarm-ing, Melbourne, pp. 238 – 244. Ministry for the Environment, 1997. Environmental Perfor-mance Indicators — Proposals for Air, Fresh Water, and Land. Ministry for the Environment, Wellington, New Zealand.
Oades, J.M., Walters, L.J., 1994. Indicators for sustainable agriculture: policies to paddock. In: Pankhurst, C.E., Doube, B.M., Gupta, V.V.S.R., Grace, P.R. (Eds.), Soil Biota: Management in Sustainable Farming Systems. CSIRO Publishing, Melbourne, pp. 219 – 223.
Pankhurst, C.E., Hawke, B.J., McDonald, H.J., et al., 1995. Evaluation of soil biological properties as potential bioindicators of soil health. Aust. J. Exp. Agric. 35, 1015 – 1028.
Pannell, D.J., Schilizzi, S., 1999. Sustainable agriculture: a question of ecology, equity, economic efficiency or expedi-ence? J. Sustainable Agric. 13, 57 – 66.
Standing Committee on Agriculture and Resource Manage-ment, 1993. Sustainable agriculture: tracking the indicators for Australia and New Zealand, Report No. 51. CSIRO Publishing, Melbourne.
Syers, J.K., Hamblin, A., Pushparajah, E., 1995. Indicators and thresholds for the evaluation of sustainable land man-agement. Can. J. Soil Sci. 75, 423 – 428.
Walker, J., Reuter, D.J., 1996. Key indicators to assess farm and catchment health. In: Walker, J.W., Reuter, D.J. (Eds.), Indicators of catchment health — a technical per-spective. CSIRO Publishing, Melbourne, pp. 21 – 33.