INTEGRATION OF LIDAR AND 3D MODELLING FOR THE ANALYSIS OF A
FLOODING EVENT
Guarnieri A.a, Gregoretti C. b, Pirotti F. a, Vettore A. a
a
CIRGEO – Inderdepartmental Research Center in Geomatics, University of Padova, via dell’Università 16, 35020 Padova, Italy
b
TESAF Department, University of Padova, via dell’Università 16, 35020 Padova, Italy E-mail: alberto.guarnieri(carlo.gregoretti,francesco.pirotti,antonio.vettore)@unipd.it
KEY WORDS: LiDAR, 3D Modelling, Hydrogeologic Risk
ABSTRACT:
Laser scanner technology can be very useful for applications relative to surveying river-beds with high and very high resolution (sampling heights at one meter spacing or less). A 3D model of structures including the river-bed, sides and contiguous areas allows to develop rigorous hydraulic models relative to flooding predictions and to the estimation of relative damages. In the field of hydraulic modelling, an important role has been played by 3D modelling when the flooding of the Bacchiglione River in 2010. Laser scanner techniques have been used for the rapid and accurate definition of which areas are prone to high risk and to potential damage in the case of bursting of river banks. The results allow estimating the amount of safety in particular cases which depend on the presence of natural and/or artificial protection structures which prevent devastation of houses or other human-made artefacts by acting as an obstacle to the water flow.
1. INTRODUCTION
The surveying techniques which use laser scanner technology bring added value to the field of hydrology; in this case Terrestrial Laser Scanner (TLS) is applied to the 3D modelling of fluvial structures. TLS instruments rely on Time of Flight (TOF) or interferometric techniques using the laser pulse as a measuring unit of distance (Roggero, 2001; Heritage and Large, 2009).
The sensor emits a light impulse of a certain wavelength, usually in the near infrared range (1000 nm- 1500 nm) and at a certain pulse frequency (usually ranging from 50 – 200 KHz). The earth surface’s topography is therefore represented with irregular 3D points, usually referred to as “point cloud” (Baltsavias, 1999).
The precision of LiDAR measurements is high (less than 0.1 m) (Mallet and Bretar, 2009), and the consequent altimetric and planimetric accuracies depend on the scan angle and also on the accuracy in positioning the different scan stations in the world reference frame (Pirotti et al., 2013).
The high point-density allows creating accurate 3D models of the different elements of interest which play a role in hydraulic modelling. The recent approaches in the field of geomorphology and hydro-geological risk assessment have seen a growing necessity of methods for the prevention of damages from extreme events. For such a target, the methods have to forecast the behaviour of water when events can result in water overflow of banks. To simulate the behaviour of different parts of the model all the parts of interest have to be given a response which models realistic behaviour from a certain input parameters. Modelling reality with specific models is a key factor for understanding the effects of events and the dynamics of the environment which is influenced by the event.
For a correct simulation of an event, an accurate comprehension of the intrinsic dynamics, which play a role in its cause and effects, is crucial, as well as the correct geometric representation of the parts involved. This is where data from a TLS survey can
become a key input in the field of the simulation and assessment of hydro-geologic events. The topography of the parts which have a role in the hydraulic behaviour of water is a key factor for the forecast of effects. The river-bed, bank and the surrounding area are all part of a system which needs to be evaluated in the simulation for a full understanding of risk and damages of an eventual flood. Small differences in the topography obtained by the survey can give rise to significant differences in the results, resulting in over- or under-estimation of the danger to artefacts and to people.
The effect of errors in managing risk assessment from evaluating flooding events and from classification of risk levels geospatially distributed shows the importance of an accurate knowledge of the topography of the area involved with an Bacchiglione flows in east-west direction, in an overall near-flat terrain. A lot of buildings reside near the river, which is monitored in order to give eventual awareness of any danger of overflowing in case of extreme events. In figure 1 an image of the area is shown. There are several bridges connecting different parts of the city and the nearby buildings are often not high above the average water level. The geographic coordinates in WGS-84 datum are the following: longitude = 11°51’34” and latitude = 45°23’09”.
The International Archives of the Photogrammetry, Remote Sensing and Spatial Information Sciences, Volume XL-5/W3, 2013 The Role of Geomatics in Hydrogeological Risk, 27 – 28 February 2013, Padua, Italy
This contribution has been peer-reviewed. doi:10.5194/isprsarchives-XL-5-W3-107-2013
Figure 1. Study area, near the Bacchiglione River, Padova, Italy.
3. METHODS
The TLS survey of the area was done with a Riegl LMS - Z620; the instrument characteristics are reported in table 1.
Measurement range 2 - 2000 m
Accuracy 10 mm
Laser class 1
Min. angle stepwidth 0.004° Inclination Sensors integrated Internal Sync Timer optional
Target detection mode first target, last target or alternating Measurement rate 11K points per second
Beam divergence 0.15 mrad
Table 1. Characteristics of Riegl LMS Z620 TLS instrument used in survey.
3.1 3D modelling and TLS survey
The scan clouds were aligned using RiScanPro software, which has all the tools for merging the clouds from different scan stations. Further processing regarded the deletion of points which belong to objects not relevant to the hydraulic simulation. The registration step is important in order to assure robust results (Bologna et al., 2002).
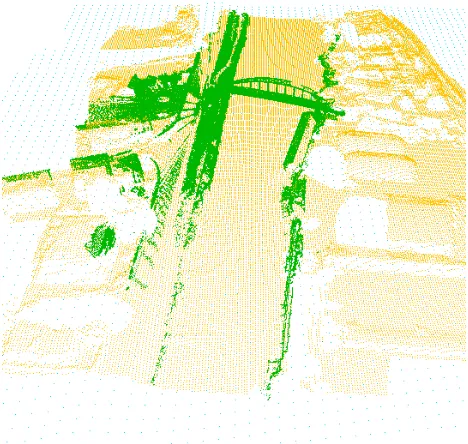
Laser scanning data from an airborne survey was also available; therefore TLS data was integrated with data from the airborne survey to cover also surrounding area and small areas which resulted with no points due to occlusion in the laser-beam path from obstacles. This data-fusion resulted in a more complete model, with different point-density in different areas (see figure 2).
Figure 2. Data fusion from the TLS points (green) and LiDAR points from an airborne survey (orange)
The part of the area which is of most interest in this study case is the one shown in figure 3 below, which depicts the points from the northern bank of the river. The area which is processed is therefore limited to the model of the river along with the areas in its northern part.
Figure 3. Top view of the point cloud showing the most sensible parts; the bridge can be clearly seen, along with the northern bank
The International Archives of the Photogrammetry, Remote Sensing and Spatial Information Sciences, Volume XL-5/W3, 2013 The Role of Geomatics in Hydrogeological Risk, 27 – 28 February 2013, Padua, Italy
This contribution has been peer-reviewed. doi:10.5194/isprsarchives-XL-5-W3-107-2013
The depth of the river is not captured by a TLS survey since the laser beam does not significantly penetrate water. Therefore it was arbitrarily set to a depth of 12 m below the water level. Artificial vertical planes were also added to the data to represent the river-bed and to limit the processing on other parts which were not of interest (the southern bank and relative areas). Figure 4 below show the dataset with the artificial planes added as reported before.
Figure 4. Vertical planes simulating the river-bed and southern bank, whereas the northern bank was modelled with the point cloud from TLS.
The model represents a 20 m segment of the river with the southern part limited by a vertical plane which was added manually to the model, and the northern part with the TLS model of the terrain and of the surface objects (in figure 4 the southern part is seen on the left).
The successive simulation regards modelling the power of the impact from water overflowing the northern bank of the river with different water levels. The variation of the water level gives results on the increase in damages and on the behaviour of the objects in the path of the water-overflow.
3.2 Hydraulic modelling
The analytic approach in the method is represented by the Ritter model for the peak outflow following the instantaneous failure of a dam (Ritter, 1892). In this approach a river or channel of infinite length, horizontal bed and null roughness, rectangular section of infinite width is assessed. The equations used are the ones of De Saint Venant (Ritter, 1982) following the above conditions and which are below reported.
0
0
h h h
u h
t x x
u u h
g
t x x
(1)
where h = depth of the water (m)
u = vertical velocity (ms-1)
g = acceleration of gravity (ms-2)
t = time (s)
x = the axis along the water flow (m)
The procedure is therefore the following:
1) define the geometry of the model to be processed;
2) define the volume of the fluid (water) and divided it in multiple cells;
3) define the physical model and the numeric model; 4) define the characteristics and parameters of the model; 5) apply an iterative resolution of the equations; 6) assess the results and make the analysis of errors.
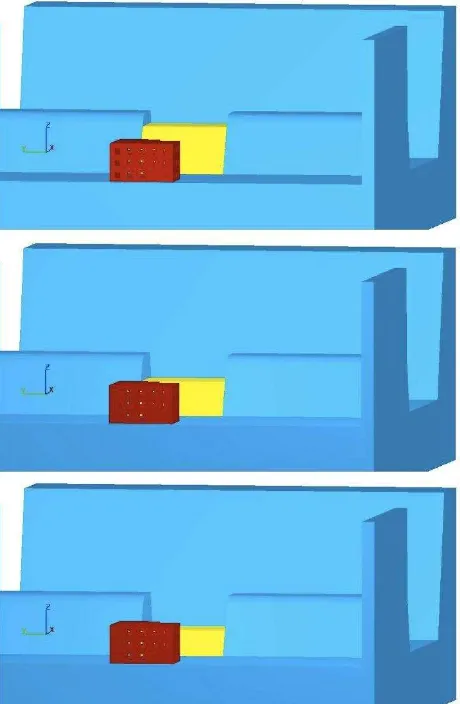
With reference to the above list of points included in the procedure, the first step was done with three different parameters where the bank destructions was at different heights (3 m, 6 m and 8 m). The model of nearby buildings is shown in figure 5, where the river bank shown in yellow color is the one which breaks, and the red cubes are the buildings.
Figure 5. Geometry representation of the model. Yellow colour represents the river bank which breaks at 3 m, 6 m and 8 m respectively from top to bottom. The red cube is the building and the blue is the overall geometric model.
The parameters of the model include not only the geometries but also the water level. The water level was set at 12 m which is just one meter below the top-most part of the river bank. The water velocity was set at 2 m/s.
The data output from the simulation model allow evaluating both the damages and the impact, in all three cases, on the vertical surfaces represented in this case by the buildings. The International Archives of the Photogrammetry, Remote Sensing and Spatial Information Sciences, Volume XL-5/W3, 2013
The Role of Geomatics in Hydrogeological Risk, 27 – 28 February 2013, Padua, Italy
This contribution has been peer-reviewed. doi:10.5194/isprsarchives-XL-5-W3-107-2013
4. RESULTS
Table 2. Results of the simulation with Fx reporting force of impact in Newtons for each height of the water wall.
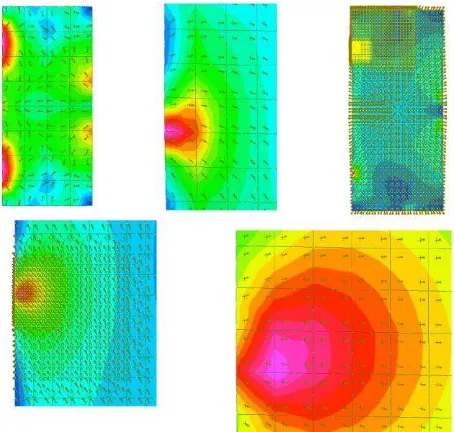
The element used to estimate the damages was the weakest part of the building which gets the impact, the doorway. The doorway has a width of 960 mm and a height of 2120 mm. The Strauss software was used to do a FEM (Finite Elements Modelling) over the forces, using the doorway as a “plate” which is a bi-dimensional element. The element is connected on one side by the hinges, and it has a uniform pressure applied by the mass of water by a factor of 0.1 (10%) of the overall pressure resulting from the breakthrough of the water.
Following the aim of the analysis, the following figures show corresponding to the doorway of the building.
To evaluate what the minimum thickness of the door has to be in order to protect the people dwelling in the house, the Nevertheless the results are rigorous and robust, and show well how an accurate geometric model can be of use in this time of flooding from overflowing of the water.
REFERENCES
Baltsavias, E.P., 1999. Airborne laser scanning: Basic relations and formulas. ISPRS Journal of Photogrammetry & Remote Sensing, 54 (2-3), pp. 199-214. State-of-the-art. ISPRS Journal of Photogrammetry & Remote Sensing, 64 (2-3), 1-16.
Pirotti, F., Guarnieri, A., Vettore, A., 2013. State of the art of ground and aerial laser scanning technologies for high-resolution topography of the earth surface. European Journal of Remote Sensing 46, pp. 66-78.
Ritter, A., 1982. Die fortpflanzung der wasserwellen zeitschrift des Vereins. Deutscher Ingenieure, pp. 947 – 954.
Roggero, M. 2001. Dense DTM from Laser Scanner Data- OEEPE Workshop Airborne laser scanning and interferometric SAR for detailed digital elevation models – Stockholm. The International Archives of the Photogrammetry, Remote Sensing and Spatial Information Sciences, Volume XL-5/W3, 2013
The Role of Geomatics in Hydrogeological Risk, 27 – 28 February 2013, Padua, Italy
This contribution has been peer-reviewed. doi:10.5194/isprsarchives-XL-5-W3-107-2013