REMOTELY-SENSED URBAN WET-LANDSCAPES: AN INDICATOR OF COUPLED
EFFECTS OF HUMAN IMPACT AND CLIMATE CHANGE
Wei “Wayne” Ji
Department of Geosciences, the University of Missouri – Kansas City, U.S.A. – [email protected]
Commission VIII, WG VIII/8
KEY WORDS: Urban Wetlands, Coupled Effects, Human Impact, Climate Change, Rule-based Classification, Scale Effects
ABSTRACT:
This study proposes the concept of urban wet-landscapes (loosely-defined wetlands) as against dry-landscapes (mainly impervious surfaces). The study is to examine whether the dynamics of urban wet-landscapes is a sensitive indicator of the coupled effects of the two major driving forces of urban landscape change – human built-up impact and climate (precipitation) variation. Using a series of satellite images, the study was conducted in the Kansas City metropolitan area of the United States. A rule-based classification algorithm was developed to identify fine-scale, hidden wetlands that could not be appropriately detected based on their spectral differentiability by a traditional image classification. The spatial analyses of wetland changes were implemented at the scales of metropolitan, watershed, and sub-watershed as well as based on the size of surface water bodies in order to reveal urban wetland change trends in relation to the driving forces. The study identified that wet-landscape dynamics varied in trend and magnitude from the metropolitan, watersheds, to sub-watersheds. The study also found that increased precipitation in the region in the past decades swelled larger wetlands in particular while smaller wetlands decreased mainly due to human development activities. These findings suggest that wet-landscapes, as against the dry-landscapes, can be a more effective indicator of the coupled effects of human impact and climate change.
1. INTRODUCTION
To understand urban landscape transformation and associated consequences, remote sensing techniques have been widely adopted. In the past studies, the related change detections predominantly focused on urban impervious surface dynamics associated with human developments as driving forces (e.g. Arnold and Gibbons, 1996; Da Costa and Cintra, 1999; Chen et al., 2000; Masek et al., 2000; Ryznar and Wagner, 2001; Lo and Yang, 2002; Yang, 2002; Ji et al., 2006; Herold, et al., 2008; Thapa and Murayama, 2009; Weng, 2012). While remote sensing-detected impervious surface change can depict human-induced urban land cover changes in general, this indicator, here referred to as “dry-landscapes”, is less effective to reflect urban landscape changes that have been shaped jointly by climate impacts (e.g. precipitation variation). To address this issue, this study investigates the sensitivity of “wet-landscapes” (loosely defined wetlands or surface waters) to the coupled effect of human disturbances and climate variation.
This research goal requires appropriately detecting and interpreting wet-landscape changes across spatial and temporal scales in order to understand the complex interactions of urban landscapes and underlying impacts. As such, the study has set its objectives as follows: (1) developing a knowledge-based image classification approach to detect urban wetlands at fine scales that cannot be mapped appropriately with traditional classification methods, (2) identifying urban wetland change patterns at the metropolitan, watershed, and sub-watershed levels, and (3) analysing precipitation impacts on the wetlands of different size groups.
2. METHODOLOGY
2.1 Study Area
The study site is in the Kansas City metropolitan area, which is located in the central United States. Rolling hills and open plains characterize the general topography of the area, with grasslands, forests, and croplands as the predominant land-cover types. Major watersheds in the area include Blue River, Little Blue River, and Shoal Creek-Missouri River. In recent decades, the area witnessed significant population and economic growth, resulting in rapid urban sprawl in all parts of the metropolitan area (Ji et al., 2006). The region has experienced a noticeable increase of precipitation since the 19th
century (U.S. Environmental Protection Agency, 1997 & 1998).
2.2 Data
The study used four SPOT satellite images, covering the period from 1992 to 2010. One 1992 SPOT-2 image covered the northern part of the Kansas City metropolitan area and the other covered the southern part. A mosaic of these two images (the 1992 image) was used in this research. The long term change of land cover was reflected in the remote sensing results between 1992 and 2008 (SPOT-5). The 2010 SPOT-5 image was used to help gain extra understanding of the short-term change after 2008. All the images were geo-referenced using ERDAS™ Imagine’s Autosync module. This process achieved an accuracy of less than 0.5 pixel root mean square error (RMSE) for each image used. The study also utilized various ancillary data to support the image classification accuracy assessment, delineating watersheds, and / or developing a knowledge base for the image classification.
The International Archives of the Photogrammetry, Remote Sensing and Spatial Information Sciences, Volume XLI-B8, 2016 XXIII ISPRS Congress, 12–19 July 2016, Prague, Czech Republic
This contribution has been peer-reviewed.
2.3 Image Classification Methods
The study developed an approach that integrates a traditional, maximum likelihood classification with a knowledge-based classification. The former was used to delineate general wetland features as the base map, while the latter acted as a fine-turning of the base map by detecting subtle wetland features at fine-scales that could not be mapped with the traditional classification. The classification scheme included the following land-use/land-cover classes: Wetlands (W), farmland/grassland (FG), impervious surfaces (IS), and forestland (F) (Table 1).
Farmland/Grassland Cultivated land, grasslands, golf courses, lawns
Impervious surfaces Built up areas (buildings, roads, paved walk-ways etc.)
Forestland Trees and shrubs
__________________________________________________________________
Table 1: The land-cover classification scheme
For the traditional approach, a supervised classification with the maximum likelihood classifier was applied to the SPOT images of 1992, 2008, and 2010. For the knowledge-based classification, we developed a knowledge base for urban wetland classification, which consists of a set of decision rules that describe the conditions defining occurrences of various wetland types. The decision rules were applied to the base maps generated through the traditional classification using the ERDAS IMAGINE Expert Classifier software.
The knowledge base was composed of a set of decision rules of identifying wetland cover in terms to their five “properties”: terrain, spatial adjacencies, habitat conditions, hydro-geomorphological characteristics, and relevant geostatistics. Based on these properties, 10 variables were considered in the knowledge base such as elevation, slope, NDVI, the distance from river, the distance from impervious surfaces, wetland vegetation, agricultural zones, and hydric soil surfaces. These variables were evaluated using raster or vector-based analyses, which resulted in a decision-tree for the knowledge-based classification.
The accuracy assessment was conducted on both the traditional classifications and the Knowledge-based classifications. The error matrix was constructed consisting of the measures including overall accuracy, producer’s accuracy, and user’s accuracy. Comparing the accuracy assessment results, we analysed the effectiveness of the knowledge-based classification approach.
2.4 Assessment of Urban Wet-landscape Dynamics
To better understand urban wetland dynamics in response to driving factors, the study analysed and compared the land cover changes generated from all the classifications with the two approaches at the following scales: metropolitan, watershed, and sub-watersheds.
Further, to understand precipitation impacts on surface waters, we separated remotely-sensed wetland cover into a large-size group and a small-size one, by adopting the upper limit for a
pond (or lake) size, 8 hectares (19.768 acres or 80,000 square meters) used by the Ramsar Wetland Convention as the dividing threshold.
3. RESULTS AND ANALYSIS
3.1 The effectiveness of the knowledge-based classification
The knowledge-based classification approach significantly improved classification accuracies on the wetland cover as compared with the traditional approach for all three detection years. For example, for the 1992 knowledge-based classification, the producer’s and the user’s accuracies are 92.1% and 90.3%, respectively, as compared to 84.6% and 68.5% with the traditional approach.
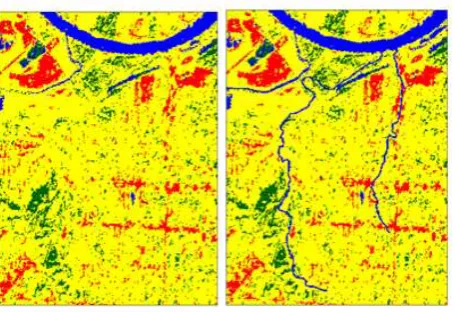
As a result, the knowledge-based approach noticeably improved detecting capabilities of many wetland features at fine scales that could not be revealed by the traditional approach. An example is shown in Figure 1, in which the left image was produced with the traditional approach while the right one by the knowledge-based method. The wetlands are in blue in the figure.
Figure 1. Rock Creek & Sugar Creek in Shoal Creek-Missouri River Watersheds, 1992. On the right image, two fine stream lines are revealed by the knowledge-based classification.
3.2 Across-scale Wet-landscape Dynamics
At the metropolitan level, for all the three study years, the knowledge-based approach detected more wet-landscape cover than the traditional method, causing a slight decrease of other three land covers in the comparison. However, the detected all land cover changes maintained the same patterns with the two methods: remotely-sensed urban wet-landscapes appeared a rising trend during the study period, while impervious surfaces also gained significantly.
This wet-landscape rising trend appears somewhat counter intuitive as one would expect some wetland areas to be replaced by impervious surfaces as urban area grow. It leads to the consideration of precipitation impact on the change pattern of urban wetlands.
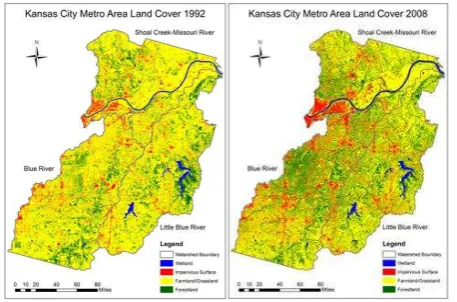
At the watershed-level, the change patterns of urban wetlands varied in each of three study watersheds (Figures 2, 3, 4, and 5). Based on the data generated by the two classification methods, the Blue River watershed, which has few large wetlands, saw a decrease of wetland cover during the study period, whereas the Little Blue Watershed, which contains two large lakes, experienced a marginal increase in the study period. For the The International Archives of the Photogrammetry, Remote Sensing and Spatial Information Sciences, Volume XLI-B8, 2016
XXIII ISPRS Congress, 12–19 July 2016, Prague, Czech Republic
This contribution has been peer-reviewed.
Shoal Creek-Missouri River watershed which has the largest wetland cover among the three watershed, the traditional classification results showed the wetland cover had consecutive increases during the study period, whereas the knowledge-based data indicated no change between 1992 and 2008 before an increase in 2010. Clearly, the watershed-level wetland change patterns were spatially more subtle and more relevant to the driving factors than the general depiction at the metropolitan scale.
At the sub-watershed scale, wetland change patterns were not necessarily the same as their parent watersheds and different classification methods could detect different change trends.
Figures 2 and 3. Watershed land covers in 1992 (left) and 2008 (right).
Figures 4 and 5. Watershed land covers in 2010 (left) and watersheds in study area (right).
3.3. Precipitation Impacts on Wetlands of Different Sizes
Figure 6 shows that there were consecutive increases in wetland cover in the study years when all wetlands were combined in the analysis. However, when excluding the larger wetland bodies from analysis, the study area registered a decline in wetland cover, suggesting that the two size groups had different underlying trends: a gain in the larger wetlands and a loss in the smaller ones. Generally, the two classification methods identified the same trends in terms of the size groups of urban wetlands.
To understand precipitation impacts on wetlands of different size groups, the study analysed historic inflow variation data of three large lakes near the study area for over half a century.
There was a long-term rising trend of inflow to all studylakes. These results confirmed a rise in precipitation in the region in recent decades.
These findings suggest that relatively higher precipitation amounts would swell larger wetland bodies more significantly in space and time than they would for smaller wetland bodies. This means that the wetland-gaining trends directly detected by remote sensing methods would be largely caused by the swelling effect of increased precipitation, which is more noticeable in the larger wetlands, and that a general decline in the cover of the smaller wetlands could be caused largely by human development as indicated by nearby impervious surface growth.
Figure 6. Comparison of cover changes of wetland size groups for three study years at the metropolitan level.
4. CONCLUSIONS AND DISCUSSION
The study confirms that wet-landscape dynamics can be a reliable and sensitive indicator of the coupled effects of human disturbances and precipitation variation, providing a new approach to understanding urban land transformation in the course of global change.
The knowledge-based image classification approach can improve the accuracy and capability of remote sensing detection of fine-scale wetland features that are particularly prone to human impacts. As a result, this approach can help reveal real and subtle responses of wetlands to the stressors in urban land transformation.
The increased precipitation can swell wetlands, particularly larger ones, which may inflate the remote sensing findings on urban wetland change trend. As revealed, the cover change of the smaller wetlands is more closely related to human built-up impacts. This mixed picture of urban wet-landscape dynamics, associated with the analysis of underlying driving factors, provides a new perspective for relevant urban planning, management, and research.
ACKNOWLEDGEMENTS
This study was partially supported by the U.S. Environmental Protection Agency through its research grant to Wei Ji (CD 97701501-0). The satellite images used for this study were The International Archives of the Photogrammetry, Remote Sensing and Spatial Information Sciences, Volume XLI-B8, 2016
XXIII ISPRS Congress, 12–19 July 2016, Prague, Czech Republic
This contribution has been peer-reviewed.
obtained with funds from grants of the Friends of Library, University of Missouri – Kansas City (UMKC). Xiaofan Xu, a former Master’s student of W. Ji, and Dzingirai Murambadoro, a former doctoral student of W. Ji, involved in related technical development and research analysis (see details in Ji, el al., 2015).
REFERENCES
Arnold, C.L. and Gibbons, C.J., 1996, Impervious surface coverage: The emergence of a key environmental indicator. Journal of the American Planning Association, 62, pp. 243– 258.
Chen, S., Zeng, S. and Xie, C., 2000, Remote sensing and GIS for urban growth analysis in China. Photogrammetric Engineering and Remote Sensing, 66, pp. 593–598.
Da Costa, S.M.F. and Cintra, J.P., 1999, Environmental analysis of metropolitan areas in Brazil. ISPRS Journal of Photogrammetry and Remote Sensing, 54.
US Environmental Protection Agency (EPA), 230-F-97-008y, September 1997.
US Environmental Protection Agency (EPA), 236-F-98-007i, September 1998.
Herold, M., Mayaux, P., Woodcock, C.E., Baccini, and Schmullius, C., 2008, Some challenges in global
land cover mapping: An assessment of agreement and accuracy in existing 1 km datasets. Remote Sensing of Environment, 112, pp. 2538–2556.
Ji, W., Ma, J., Wahab-Twibell, R. and Underhill, K., 2006, Characterizing urban sprawl using multi-stage remote sensing images and landscape metrics, Journal of Computers, Environment and Urban Systems, 30, pp. 861–879.
Ji, W., X. Xu, and Z. Murambadoro, 2015, Understanding Urban Wetland Dynamics: Cross-Scale Detection and Analysis of Remote Sensing. International Journal of Remote Sensing, Vol. 36, No. 7, 1763–1788.Taylor & Francis.
Lo, C.P. and Yang, X., 2002, Drivers of land-use/ land-cover changes and dynamics modelling for the Atlanta, Georgia Metropolitan Area. Photogrammetric Engineering and Remote Sensing, 68, pp. 1073–1082.
Masek, J.G., Lindsay, F.E. and Govard, S.N., 2000,
Dynamics of urban growth in the Washington DC metropolitan area, 1973-1996, from Landsat observations. International Journal of Remote Sensing, 21, pp. 3473–3486.
Ryznar, R.M. and Wagner, T.W., 2001, Using remotely sensed imagery to detect urban change: Viewing Detroit from space. Journal of the American Planning Association, 67, pp. 327–336.
Thapa, R.B. and Murayama, Y., 2009, Urban mapping, accuracy, & image classification: A comparison of multiple approaches in Tsukuba City, Japan. Applied Geography, 29, pp. 135–144.
Weng, Q., 2012, Remote sensing of impervious surfaces in the urban areas: requirements, methods, and trends. Remote Sensing of Environment, 117, pp.34–49.
Yang, X., 2002, Satellite monitoring of urban spatial growth in the Atlanta metropolitan area. Photogrammetric Engineering and Remote Sensing, 68, pp. 725–734.
The International Archives of the Photogrammetry, Remote Sensing and Spatial Information Sciences, Volume XLI-B8, 2016 XXIII ISPRS Congress, 12–19 July 2016, Prague, Czech Republic
This contribution has been peer-reviewed.