TOWARDS PEOPLE DETECTION FROM FUSED TIME-OF-FLIGHT AND THERMAL
INFRARED IMAGES
L. Hoegner a, A. Hanel a, M. Weinmann b, B. Jutzi b, S. Hinz b, U. Stilla a
a Technische Universität München, Photogrammetry and Remote Sensing. 80333 Munich, Germany – (ludwig.hoegner, a.hanel, stilla)@tum.de
b Karlsruhe Institute of Technology, Institute of Photogrammetry and Remote Sensing, 76128 Karlsruhe, Germany – (martin.weinmann, boris.jutzi, stefan.hinz)@kit.edu
Commission III, WG III/1
KEY WORDS: Calibration, relative orientation, time-of-flight, infrared, co-registration, point cloud, segmentation
ABSTRACT:
Obtaining accurate 3d descriptions in the thermal infrared (TIR) is a quite challenging task due to the low geometric resolutions of TIR cameras and the low number of strong features in TIR images. Combining the radiometric information of the thermal infrared with 3d data from another sensor is able to overcome most of the limitations in the 3d geometric accuracy. In case of dynamic scenes with moving objects or a moving sensor system, a combination with RGB cameras of Time-of-Flight (TOF) cameras is suitable. As a TOF camera is an active sensor in the near infrared (NIR) and the thermal infrared camera captures the radiation emitted by the objects in the observed scene, the combination of these two sensors for close range applications is independent from external illumination or textures in the scene. This article is focused on the fusion of data acquired both with a time-of-flight (TOF) camera and a thermal infrared (TIR) camera. As the radiometric behaviour of many objects differs between the near infrared used by the TOF camera and the thermal infrared spectrum, a direct co-registration with feature points in both intensity images leads to a high number of outliers. A fully automatic workflow of the geometric calibration of both cameras and the relative orientation of the camera system with one calibration pattern usable for both spectral bands is presented. Based on the relative orientation, a fusion of the TOF depth image and the TIR image is used for scene segmentation and people detection. An adaptive histogram based depth level segmentation of the 3d point cloud is combined with a thermal intensity based segmentation. The feasibility of the proposed method is demonstrated in an experimental setup with different geometric and radiometric influences that show the benefit of the combination of TOF intensity and depth images and thermal infrared images.
1. INTRODUCTION
Deriving an appropriate 3d description of man-made and natural environments is of great interest in Computer Vision, Photogrammetry and Remote Sensing. Recent developments in active sensors like time-of-flight (TOF) cameras allow recording images of both intensity and 3d depth values at the same time (Jutzi, 2012). The intensity images are recorded in the near infrared (NIR) and objects show almost the same behaviour as in the visible optical domain which depends on the surface geometry and roughness relevant for the reflection of the surface (Weinmann and Jutzi, 2012). Thermal infrared (TIR) cameras on the opposite do not record the reflected but the emitted radiation in a wave length of 8 to 12 µm and show the inner behaviour of an object like the temperature (Iwaszczuk et al., 2011; Hoegner et al., 2007).
In photogrammetry and computer vision a variety of methods are well developed for 3d reconstruction from ordered (Pollefeys et al., 2008) and unordered (Mayer, 2007, Snavely et al. 2008) image sequences. These methods are limited to structured surfaces with features that can be detected as Homologous points through the sequences. As they operate in the visible spectrum, they are also dependent on the external lighting conditions. The detectors of features and descriptors of Homologous points like SIFT (Lowe, 2004), Foerstner (Förstner and Gülch, 1987), and Harris (Harris & Stephens, 1988) are based on radiometric similarity of Homologous points. This is only valid, if the compared images are within the same spectral domain.
In contrast to 3d reconstruction from images, methods based on runtime measurements with active sensors are independent from textures and corresponding points in several images. Laser scanners are recording weakly textured surfaces. The combination of laser scanners with cameras has already been introduced in industrial products. The sequential scanning principle delimitates laser scanners to static scenes. Dynamic scenes can be recorded with time-of-flight cameras recording depth values parallel for all elements of a detector matrix. The result is an intensity image in the near infrared and a depth image showing the distances of the observed object for every pixel of the image with a recording rate of several images per second (Weinmann et al. 2012).
Especially in building observation (Iwaszczuk et al., 2011; Hoegner et al., 2007), the extraction of textures on facades of buildings in the thermal infrared spectrum allows a reconstruction of the surface temperature and a look into the interior behaviour of a wall. The mentioned methods for feature extraction, Homologous point correspondences, and 3d reconstruction have been adopted to thermal images. In general, in the thermal infrared lines and edges do not show strong edges but appear blurred. The radiometric behaviour of features is different from the visible spectrum. These effects cause mismatches between features in the thermal infrared and visible domain and reduce the accuracy of object detection and extraction in infrared images. Especially in close-range applications such as indoor building inspections or industrial processes, additional sensors are necessary to improve the The International Archives of the Photogrammetry, Remote Sensing and Spatial Information Sciences, Volume XL-3, 2014
accuracy of infrared images. A coregistration of images from the visible and thermal infrared domain based on segmentation has be introduced by Coiras et al. (2000). Park et al. (2008) combine different spectral bands using so called transinformation. For almost planar scenes, the coregistration can be done using a homography (Weinmann et al., 2012). Coregistration for TOF cameras and RGB images is done calculating the relative orientation in a bundle adjustment with Homologous points (Hastedt and Luhmann, 2012) due to the fact, that the radiometric behaviour in near infrared and visible light is almost the same. Wang et al. (2012) investigate foreground background separation from combining TOF depth values and RGB values, both recorded by one camera system. Due to the RGB camera, they learn a likelihood classification for foreground and background colors. In case of a thermal camera, the temperature of a person is known and so a fixed threshold can be used instead. In contrast to Wang et al (2012), a more complex geometric calibration has to be done for TOF and TIR cameras as to different optics are used an so a relative orientation has to be calculated. So far, a coregistration of thermal images and images in the near infrared or visible spectrum is mainly done with tie points only which have been marked manually.
In this paper, a method is introduced to coregister TOF and TIR images and use the fused information for segmentation and people detection. In previous works, both camera systems have been calibrated separately and the relative orientation has been calculated from feature points, where a homography (Weinmann et al., 2012) or an essential matrix is used to describe the relative orientation (Hoegner et al., 2013). This leads to errors caused by different descriptions of the geometric calibration parameters. Projection errors in the bundle adjustment can then only be assigned to the observed feature points and the relative orientation where the errors in the geometric calibration are neglected. In the proposed method, the geometric calibration of both cameras is done with the same calibration method together with the relative orientation (chapter 2.1). This introduces the parameters of the geometric calibration in the bundle adjustment of the relative orientation and increases the accuracy of the coregistration. In a second step, a strategy is presented to detect single persons in the fused image information based on depth layers and hot spot detection.
2. METHODOLOGY
The proposed method fuses different image data types. It uses intensity and depth images captured by a time-o-flight (TOF) camera and images acquired by a thermal infrared (TIR) camera. The method is applicable for different configurations of the relative orientation of the two camera systems. Where in general a small baseline between the two cameras is optimal for coregistration, this method is also usable with longer baselines. The longer the baseline is chosen, the bigger the disparity of the visibility of 3d scenes for the cameras which causes different occlusions. It is assumed that the relative orientation is stable and constant after the system calibration. The proposed methods is grouped into two blocks. Chapter 2.1 focusses on the geometric calibration and relative orientation of the cameras. This step has to done once for the system. Chapter 2.2 deals with the object detection from fused image data for a given relative orientation provided in chapter 2.1.
2.1 Geometric camera calibration and relative orientation It is assumed that the intensities of the NIR image of the TOF camera and the intensities of the TIR image of the TIR camera are both recorded with 16 bit. The intensity information captured with the range imaging device is adapted by applying a histogram normalization which adapts the intensity information I to the interval [0; 255] (Weinmann and Jutzi, 2012).Figure 1 shows an example of the raw data of both cameras for an indoor scene with persons. Both cameras show geometric radial distortions to be corrected in the calibration. Different elements of the scene show a different radiometric behaviour in both to be warmer in general than the static scene.
Figure 1. Visualization of the data captured with a TOF and a TIR camera: Normalized active intensity (NIR), range data and thermal intensity (TIR) (from left to right). The range increases from red pixels via yellow and green pixels to blue pixels. The thermal intensity is coded in RGB with intensity increasing
from blue via green and red to white.
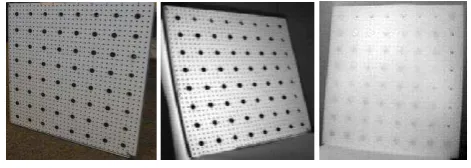
The geometric calibration is done using a 2d calibration table (Hartley and Zisserman, 2004) with point features (Fig. 2). The distance of the points in x and y is given with 6 cm. The white surface of the table and the black skews of the big points are clearly visible in the near infrared due to different reflection coefficients. In the thermal infrared the skews warm up and cool down slower than the white table itself. This leads to a different radiation of both materials in the thermal infrared intensity.
Figure 2. Calibration table with raster on the white surface. From left to right: RGB image of the calibration table, NIR image, TIR image. The big black points are painted screws with a raster size of 6 cm. The points are visible both in the NIR and
TIR image.
The calibration marks are automatically extracted using a dynamic threshold that compensates grey value differences in the background and on the calibration table. An additional morphological closing is used to reduce the noise in the resulting binary image. Using the detected binary blobs as candidates for calibration marks, a blob detector is used on the grey value images. As parameters a minimum grey value difference and a minimum and maximum blob distance are used. The minimum grey value distance is calculated from the The International Archives of the Photogrammetry, Remote Sensing and Spatial Information Sciences, Volume XL-3, 2014
histogram of the intensity images. The minimum and maximum distance are derived from the known distance of 6 cm of the calibration marks, the image resolution and the assumption, that the calibration table should cover most of the images used for the calibration. The center points of the blobs in both intensity images are used as calibration marks in a bundle block calibration. For the geometric calibration, the parameter set proposed in Weinmann and Jutzi (2012) is used with focal length, principal point, and three radial distortion parameters.
It is assumed, that both cameras are mounted fixed on a sensor platform and both see the calibration table in all calibration images. Then, the extracted calibration marks in both intensity images are Homologous points and taken for the relative orientation. The geometric calibration than is extended to the unknown parameters of the relative orientation where the projection center of the TOF camera is the origin of the coordinate system and the TIR camera is oriented relative to the TOF camera. The interior orientations and distortion parameters of both cameras are then estimated together with the five parameters of the relative orientation (y, z, ω,φ,κ).
2.2 Image fusion and people detection
The relative orientation is calculated using the calibration marks of the two intensity images of the TOF camera and the TIR camera. The TOF camera contains also a depth image which assigns a depth value to every pixel of the TOF camera. The depth values are transferred to 3d point coordinates in the coordinate system of the TOF camera using
( , ); / x ( x); / y ( y)
zI r c xz f c c yz f r c (1)
where cx , cy = principal point of TOF camera r, c = image coordinates
I(r, c) = depth value of pixel (r, c) fx, fy coordinates of projection center x, y , z = object coordinates X3D,TOF = 3d points in TOF coordinate system Rrel, Trel = Relative rotation and translation of TIR camera from relative orientation estimation
In the image plane of the TIR camera, thermal intensity values for the projected 3d points are bilinear interpolated and assigned to the 3d depth values of the TOF camera.
Two main effects influence the quality of the 3d point generation and coregistration. The quality of the depth estimation decreases with lower intensities of the reflected NIR light. A global threshold on the intensity image of the TOF camera is used to mask out depth values in the corresponding depth image. Pixels with low reflected intensity are marked as unreliable in the depth image and removed.
The second effect is caused from a stereo base between the two cameras. Different occlusion and visibility on the projection ray cause wrong intensity value assignments. Two 3d points that are visible in the TOF camera may be on the same projection ray in the TIR camera and are assigned the same thermal intensity value. This effect could lead to doubled intensity values or blurred objects. As a solution, the visibility of the 3d points for the TIR cameras has to be checked. This is done by projecting the depth image of the TOF camera into the TIR camera. For every mapped pixel of the depth image the corresponding 3d point is known. The distance image is segmented using histogram based thresholds into discrete depth layers based on a peakiness test. Using the assumption that a person is in the foreground, background points can be marked out and the projection is done only for foreground points.
In the segmented foreground there are still 3d points that do not belong to a person. It is assumed that persons are warm compared to other objects and cover a minimum part of the image. Performing a segmentation on the thermal intensity values, cool areas in the foreground are removed. Small warm objects in the foreground like i.e. lamps are removed using the minimum size of a person condition. The segmentation result contains in the local TOF coordinate systems all 3d point sets with a temperature and size typical for persons. This procedure would also include other warm, big foreground objects like animals or big technical devices like computers. Taking into account the possibility to record an image sequence with both camera systems, still objects are removed if there shapes does not change over a defined time span. A distinction of other objects like human vs. animal is not made in this work.
3. EXPERIMENTS frames per second. Due to the chosen modulation frequency, the non-ambiguity range (unique range) is less than 10 m. The used infrared camera is a bolometer-based VarioCAM hr from InfraTec. Its sensor records in the wavelength interval from 7.5 - 14 µm with a radiometric resolution of 0.05 K. The image of the captured thermal information has a size of 384 × 288 pixels and, considering an angular resolution of approximately 0.16° this corresponds to a field of view of approximately 61° × 46°. The frame rate is 25 frames per second. The cameras are mounted into a camera rack as shown in figure 3. The used TIR camera is mounted on the top of the rack. Two TOF cameras are mounted on the left and right side. In the experiments only the right TOF camera is used. The mounted RGB camera is also unused for the experiments.
Figure 3. Camera rack with two TOF cameras (left and right), a RGB camera (lower center) and a thermal infrared camera (upper center). The thermal camera Infratec VarioCAM hr and the right TOF camera PMD[vision] CamCube 2.0 are used for
the experiments.
In addition to the calibration table shown in figure 2 an indoor scene is recorded with a person the foreground partially covered by an object and with a background with complex distance and lighting conditions.
3.2 Camera system calibration
Using the calibration table for both cameras, the calibration are extracted from the images using the dynamic threshold. Figure 4 shows the result of the dynamic threshold segmentation on an intensity image of the TIR camera. Marks and border are extracted the marks are almost ellipsoid.
Figure 4. Segmented image of the calibration table generated
from a TIR image. Calibration marks and border are clearly visible.
In figure 5 the resulting calibration marks seen by the TIR camera (white) are projected onto the extracted calibration marks of the TOF camera (black). Using the center of gravity of all marks in both images, the parameters of the geometric calibration and the relative orientation are estimated.
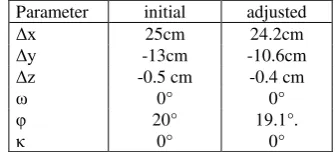
As initial values of the bundle adjustment the distance of the marks is set to 6 cm. The camera parameters are taken from the data sheets. The initial measured values of the relative orientation are given in table 1. The resulting camera parameters after the adjustment are measure with a RMS of 0.374 pixel for the TIR camera and 0.286 pixel for the TOF camera. The relative orientation results in a RMS of 0.365 pixel.
Figure 5. Segmented calibration marks of the TIR camera (white) projected onto the segmented calibration marks of the
TOF camera (black). Background: the estimated plane of the calibration table.
The values of the estimated parameters of the relative orientation are given in table 1. The TOF camera shows a slightly better accuracy because of a better contrast that allows a more accurate mark extraction despite the lower sensor resolution. The TIR camera has a lower accuracy caused by the low contrast for some marks.
Parameter initial adjusted
Δx 25cm 24.2cm
Δy -13cm -10.6cm
Δz -0.5 cm -0.4 cm
ω 0° 0°
φ 20° 19.1°.
κ 0° 0°
Table 1. Values of the relative orientation initially and after adjustment
3.3 Image fusion and people detection
After calibrating the camera system, the scene shown in figure 6 is to be processed. The intensity image of the NIR of the TOF camera (left) shows a person with almost the same NIR intensity as the suitcase the person is holding. In the background there is a table in the right and a wall in the back. Behind the person is an open door. In the depth image (right) the suitcase and the person are hard to distinguish. In the area of the open door, depth noise is visible. This noise is caused by the low reflection intensities in these areas. Additional depth noise appears on object boundaries where a part of the pixel area covers the foreground object reflection and the other part the background reflection.
Figure 6. NIR intensity (left) and depth image (right) of the TOF camera. Depth values are similar for person and suitcase
and noisy depth values can be seen around the person. The International Archives of the Photogrammetry, Remote Sensing and Spatial Information Sciences, Volume XL-3, 2014
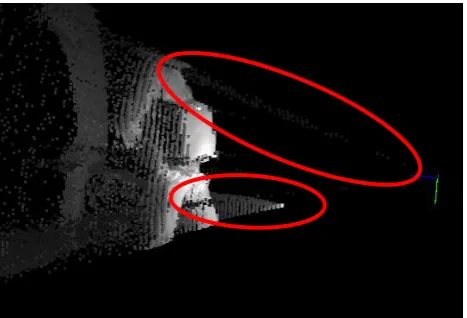
The big errors in the depth estimation can be seen in figure 7. The red ellipses mark 3d points with wrong depth values caused by low reflection intensities.
4. DISCUSSION
Type text single-spaced, with one blank line between
5. OUTLOOK
Figure 7. 3d points from depth image with NIR intensity. The red ellipses show areas with wrong depth estimation caused by
low reflection intensities (upper case) or depth jumps (lower case).
Applying a global threshold on the NIR intensities, depth values with low corresponding intensities are removed (Fig. 8). The depth image now shows homogeneous areas and much less noise.
Figure 8. Denoised depth image with noisy pixels marked out.
Applying the peakiness test, the depth image is segmented into discrete depth layers (Fig. 9). The histogram shows the depth value distribution in blue and the thresholds in red. In the resulting discrete depth layer image (Fig. 9 right) the person is totally covered in one depth layer. The same layer is also assigned to a part of the table on the right side.
In the next step, the information of the TIR camera is included. Because of the baseline between both cameras, the intensity values of the TIR camera are mapped twice on different 3d points of the TOF camera (Fig. 10 left). The suitcase can be seen with different temperatures in front of the person. All 3d points that are marked as background are now removed. For the remaining points, a threshold on the thermal infrared intensity is performed. The resulting point cloud (Fig. 10 right) contains the 3d points that are marked as person. A few remaining wrong
points have stayed between the legs of the person caused by the different perspective of both cameras, but the suitcase is removed as well as the background scene.
Figure 9. Left: histogram of the depth values of Fig. 8 (blue) with calculated thresholds (red). Right: Fig. 8 transferred to
discrete depth layers.
Figure 10. Left: 3d points seen by the TOF camera with TIR intensities. Right: Person detection result with background and
suitcase removed automatically.
4. DISCUSSION AND OUTLOOK
Compared to former work, the used calibration method increases the quality of the coregistration. The inclusion of geometric calibration and relative orientation optimizes the estimated parameters for the best fit of the relative orientation. Errors are mainly caused by two aspects: noise in the depth image is reduced by the removal of pixels with small reflection intensity. Depth jumps at foreground objects still generate a number of wrong 3d points. The second source for errors is a wrong intensity value interpolation caused by different visibilities and occlusion of the two cameras. These errors are directly related to the choses stereo baseline. For small baselines, the visibilities and occlusion are more similar und the projection errors get smaller.
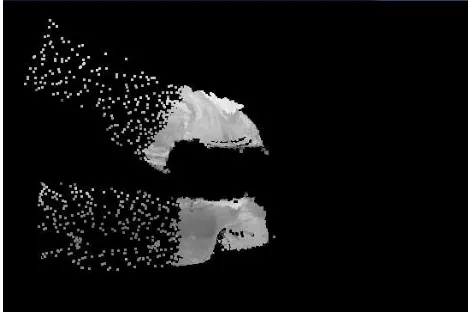
Figure 11 shows the final result of the person detection which compared to figure 7 only contains 3d points that are segmented as part of the person. The visible part of the person is correctly segmented. The suitcase, the table, and the background is removed. On the outline of the shape of the person, a few border points remain as depth noise.
The chosen discrete depth layers to identify possible 3d points of a person is linked to a couple of assumptions: a person must be isolated from other persons. A person is in the foreground with respect to the scene, and a person is a big object. In his paper, a person is seen as a homogeneous bright, warm object.
Future work will focus on the segmentation of 3d geometric primitives taking into account the depth information as well as intensity information from the near infrared TOF camera and the thermal infrared camera. The 3d points could be grouped and fitted in geometric primitives.
Figure 11. 3d view of the segmented point cloud of the person with interpolated thermal infrared intensity values.
Person in general can be seen as cylinders. A combination of depth and intensity information will be used to detect body parts like extremities, torso, and head. Such a model has to deal with only partial visible persons as the backside of the person is not visible or a person can be partially occluded. A further step should be to distinguish several persons in the scene with partial overlap.
REFERENCES
Coiras, E.; Santamaria, J.; Miravet, C. (2000): A segment-based registration technique for visual-IR images. Optical Engineering 39, 282-289.
Förstner, W.; Gülch, E. (1987): A fast operator for detection and precise location of distinct points, corners and centres of circular features. Proceedings of the ISPRS Intercommission Conference on Fast Processing of Photogrammetric Data, 281-305.
Harris, C.; Stephens, M. (1988): A combined corner and edge detector. Proceedings of the 4th Alvey Vision Conference, 147-151.
Hartley, R. I.; Zisserman, A. (2004): Multiple view geometry in computer vision. University Press, Cambridge.
Hastedt, H.; Luhmann, T. (2012): Investigations on a combined RGB / Time-of-Flight approach for close range applications. In: Shortis, M.; Mills, J. (Eds.), XXII ISPRS Congress, Technical Commission V. The International Archives of the Photogrammetry, Remote Sensing and Spatial Information Sciences 39 (Part B5), 333-338.
Hoegner, L.; Kumke, H.; Meng, L.; Stilla, U. (2007): Automatic extraction of textures from infrared image sequences and database integration for 3D building models. PFG Photogrammetrie – Fernerkundung – Geoinformation 6 / 2007, 459-468.
Hoegner, L., Weinmann, M., Jutzi, B., Hinz, S., Stilla, U. (2013): Co-registration of Time-of-Flight (TOF) camera generated 3d point clouds and thermal infrared images (IR). In: Seyfert E (Ed) Geoinformatik und Erdbeobachtung: 33. Wissenschaftlich-Technische Jahrestagung der DGPF, 2013 (22): 481-488
Iwaszczuk, D.; Hoegner, L.; Stilla, U. (2011): Detection of windows in IR building textures using masked correlation. In: Stilla, U.; Rottensteiner, F.; Mayer, H.; Jutzi, B.; Butenuth, M. (Eds.), Photogrammetric Image Analysis, ISPRS Conference - Proceedings. Lecture Notes in Computer Science, 6952, Springer, 133-146.
Jutzi, B. (2009): Investigations on ambiguity unwrapping of range images. In: Bretar, F.; Pierrot-Deseilligny, M.; Vosselman, G. (Eds.), Laserscanning '09. The International Archives of the Photogrammetry, Remote Sensing and Spatial Information Sciences 38 (Part 3 / W8), 265-270.
Jutzi, B. (2012): Extending the range measurement capabilities of modulated range imaging devices by time-frequency multiplexing. AVN – Allgemeine Vermessungs-Nachrichten 2 / 2012.
Lowe, D. G. (2004): Distinctive image features from scale-invariant keypoints. International Journal of Computer Vision 60(2), 91-110.
Mayer, H. (2007): 3D reconstruction and visualization of urban scenes from uncalibrated wide-baseline image sequences. PFG - Photogrammetrie – Fernerkundung – Geoinformation (2007) 3, 167-176.
Park, C.; Bae, K.-H.; Choi, S.; Jung, J.-H. (2008): Image fusion in infrared image and visual image using normalized mutual information. Proceedings of SPIE, 6968, 69681Q-1-9.
Pollefeys, M.; Nistér, D.; Frahm, J. M.; Akbarzadeh, A.; Mordohai, P.; Clipp, B.; Engels, C.; Gallup, D.; Kim, S. J.; Merrell, P.; Salmi, C.; Sinha, S.; Talton, B.; Wang, L.; Yang, Q.; Stewénius, H.; Yang, R.; Welch, G.; Towles, H. (2008): Detailed real-time urban 3D reconstruction from video. International Journal of Computer Vision 78(2-3), 143-167.
Snavely, N.; Seitz, S.M.; Szeliski, R. (2008). Modeling the World from Internet Photo Collections. International Journal of Computer Vision 80 (2), 189-210.
Wang, L.; Gong, M.; Zhang, C.; Yang, R.; Zhang, C.; Yang, Y.H. 2012. Automatic Real-Time Video Matting Using Time-of-Flight Camera and Multichannel Poisson Equations. International Journal of Computer Vision 97(1), 104-121.
Weinmann, M.; Jutzi, B. (2012): A step towards dynamic scene analysis with active multi-view range imaging systems. In: Shortis, M.; Paparoditis, N.; Mallet, C. (Eds.), XXII ISPRS Congress, Technical Commission III. The International Archives of the Photogrammetry, Remote Sensing and Spatial Information Sciences 39 (Part B3), 433-438.
Weinmann, M.; Hoegner, L.; Leitloff, J.; Stilla, U.; Hinz, S.; Jutzi, B. (2012): Fusing passive and active sensed images to gain infrared-textured 3D models. In: Shortis, M.; El-Sheimy, N. (Eds.), XXII ISPRS Congress, Technical Commission I. The International Archives of the Photogrammetry, Remote Sensing and Spatial Information Sciences 39 (Part B1), 71-76.