REDUCTION OF LIVELIHOOD RISK FOR RIVER BANK EROSION AFFECTED
VILLAGERS
S. Sen Majumder a, *, D. M. Fox b, S. Chakrabarti c, G. Bhandari c
a
PhD Research Scholar, School of Oceanographic Studies, Jadavpur University, Kolkata, INDIA – susmita1527@gmailcom b
Professor, Department of Geography, University of Nice-Sophia Antipolis, Nice, France – [email protected] c Civil Engineering Faculty, Jadavpur University, Kolkata, INDIA – (schakraborty, gbhandari)@ civil.jdvu.ac.in
Commission VIII
KEY WORDS: Livelihood risk, Re-emerged plots, Cadastral maps, Spatial adjustment tool, Automatic digitization, Projective tranformation
ABSTRACT:
Bank erosion process of the Ganga River created a serious livelihood risk for the villagers situated on left bank of the river in Malda district of the State of West Bengal, India since last four decades. Due to the erosion of agriculture land by the river, most of the villagers having agriculture as their only means of livelihood became jobless suddenly. Presently they are living in a miserable condition. One of the main objectives of this paper is to find out an alternative means of livelihood for the victims to improve their miserable socio-economic condition.
It has been found from field survey that some erosion affected villagers have started to live and practice agriculture temporarily on the riverine islands (large and stable since thirteen years) as these islands have very fertile soil. If the re-emerged land plots can again be demarcated on the newly formed islands and distributed among the landless people to practice agriculture over there, then it will be a useful alternative livelihood strategy for the victims. The demarcation of re-emerged plots can be achieved by geo-referencing the cadastral maps and then overlaying the plots on the present river course. In the present study area geo-geo-referencing process of the cadastral maps became a serious issue as the study area has been very dynamic in terms of land cover and land use. Most of the villages were lost into the river course. Thus the common permanent features, required for geo-referencing, shown in the cadastral maps (surveyed during 1954-1962) were not found in the present satellite images. The second important objective of the present study is to develop a proper methodology for geo-referencing the cadastral maps of this area. The Spatial Adjustment Transformation and Automatic Digitization tools of Arc GIS were used to prepare geo-referenced plot maps. In Projective Transformation method the geometrically corrected block maps having village boundaries were used as source file. Then the geo-referenced plot maps were overlaid on the present river course and the plots covered by islands or lands were extracted. For e.g., Gopalpur village contains nearly 29% of its total area as riverine island and 36% of total plots are covered by this island area. These plots can be distributed to the land less people so that they can utilize it and reduce their livelihood risk in future.
* Corresponding author.
1. INTRODUCTION
The alluvial floodplain areas always facilitate habitation and in acquiring various livelihoods by the people. As the bank erodes and channel migrates, it causes loss of surrounding land and other properties of the individuals and society. This phenomenon impacts greatly on the socio-economic condition and livelihoods of the individuals and society as well. People living on river banks and islands in river course suffer from multiple vulnerabilities due to seasonal erosion and flooding (Lein, 2009). Popular assumption is that people live in such hazard-prone physical and social environments only because they have no other options; that increasing population pressure, unequal access to land, lack of employment opportunities. Poverty forces marginalized people to settle in such high-risk areas such as the active floodplains of India and Bangladesh (Chowdhury & Hossain, 1988; Burton et. al., 1993; Alam et. al., 2007; Lein, 2009; Sharma et. al., 2010). The slow and steady disaster of riverbank erosion has a permanent effect upon the socio-economic conditions and demographic dislocation of the erosion-affected people (Banerjee, 1999). Bank erosion process of the Ganga River created a serious livelihood risk for
the village people in the Malda district of the State of West Bengal, India since last four decades.
2. PROBLEMS OF THE STUDY AREA
In the study area the Ganga gradually engulfed the villages located on its left bank and eroded the lands having public and private properties (roads, school buildings, office buildings, health centers, agriculture fields, mango orchards, houses), which have impacts on socio-economic conditions of the victims. In most of these villages agriculture was the chief means of livelihood. Due to erosion of agriculture land by the river, the villagers having agriculture as their only means of livelihood became jobless suddenly. Their economic condition abruptly dropped, some changed their profession, men migrated to other parts of the country for work and gradually, different types of social problems arose. One of the main objectives of this paper is to find out an alternative means of livelihood for the victims to improve their miserable socio-economic condition.
The International Archives of the Photogrammetry, Remote Sensing and Spatial Information Sciences, Volume XL-8, 2014 ISPRS Technical Commission VIII Symposium, 09 – 12 December 2014, Hyderabad, India
This contribution has been peer-reviewed.
In the study area nearly 14335 hectares of fertile land was eroded on left bank of the river from 1931 to 1978 with an average rate 300 ha/year and total eroded land during the period of 1979 to 2004 was measured to be 4247 hectares with an average rate 146 ha/year (Mukherjee, 2011; Parua, 2006; Barman, 2010). More than 200 sq. km. of fertile land was swept away till 2004 and almost equal extent of island has emerged along opposite right bank (Mukherjee, 2011). Since last three decades the rate of bank erosion has decreased and the river course is covered by large and stable islands (Sen Majumder and Bhandari, 2010). From the field survey it has been found that some erosion affected villagers have started to live and practice agriculture temporarily in these islands as these islands have very fertile soil (shown in Figure 1).
Figure 1: Paddy field and huts on islands
Sometimes villagers stated that their eroded land plots have re-emerged on these islands. If these re-re-emerged plots can again be demarcated on the newly formed islands and distributed among the landless people to practice agriculture over there, then it will be a useful alternative livelihood strategy through which victims can increase their livelihood asset and also improve it and make it sustainable. This livelihood asset would give them additional strength to cope up with further disaster risk in future.
The second objective of this study is to identify and demarcate the plots on riverine islands which can be used for practicing agriculture.
3. MATERIALS AND METHODS
The cadastral maps, showing land plots, are needed to identify and demarcate the re-emerged plots on the islands. Cadastral maps of few selected villages, which were covered mostly by river course, were collected from the Land Record Office of the Government of West Bengal, India. The cadastral maps were drawn through triangulation survey during the period of 1954-1962 on a scale of 1 inch representing 16 miles. Each plot in this map has a unique number and all details about ownership, area and landuse types of these plots were recorded in the ‘Plot
Index Report’ made by Land Record Office of Government of
West Bengal, India. A single village had several sheets of cadastral maps. For e.g. Gopalpur village had 8 sheets in total.
Relocation of re-emerged plots was achieved by geo-referencing the cadastral maps and then overlaying the plots on present river course. In this case, geo-referencing of cadastral maps became a serious issue as the study area was very dynamic in terms of land cover and land use. Most of the
villages were lost into the river course. Thus the common permanent features, required for geo-referencing, shown in cadastral maps (surveyed during 1954-1962) were not found in present satellite images and in field as well. Moreover, the cadastral maps were surveyed such a long year ago that no satellite image (geo-referenced) of such high spatial resolution of that time are available which could be used to geo-reference the cadastral maps. So, it became very challenging for the present study, to develop a proper methodology for geo-referencing the cadastral maps of this area.
The whole job of geo-referencing was done using the softwares Erdas Imagine and Arc GIS. The following steps were performed for this –
• Step 1: The digital sheets of collected cadastral maps were in .tiff format. All sheets were imported into .img format which is compatible in ERDAS and Arc GIS.
• Step 2: Subsetting was done on all sheets to extract the drawing part only.
• Step 3: All the sheets of a single village were aligned and integrated properly by the ‘Spatial Adjustment
Transformation’ tool of ArcGIS software. The adjustments
were performed using affine transformation method based on displacement links. Links are graphic elements that represent the source and destination points for adjusting features. Links are represented as arrows where the arrow-head points toward the destination location. Figure 2 illustrates the earlier positions of two adjacent sheets (sheet 1 and sheet 2), application of displacement links to align
Figure 2: Spatial adjustments
the sheets properly and the final alignment of sheets after spatial adjustment. From the ‘Link Table’ both the source and destination coordinates for the links and root mean square (RMS) error for each link were found. If any link did not have an acceptable RMS value i.e. less than 0.5 in present study, it was modified or deleted.
• Step 4: Thereafter digitization was performed on the spatially adjusted cadastral maps to extract the plots in polygon vector file. As the maps have thousands of plots, manual digitization was very laborious and time consuming. So, the plots were converted into polygon layer by applying ‘Automatic Digitization’ tool of Arc GIS. Before performing automatic digitization all the sheets were passed through ‘Raster Cleanup’ session. This The International Archives of the Photogrammetry, Remote Sensing and Spatial Information Sciences, Volume XL-8, 2014
ISPRS Technical Commission VIII Symposium, 09 – 12 December 2014, Hyderabad, India
This contribution has been peer-reviewed.
tool basically removed raster cells in terms of noise. It also filled the gaps by adding new raster cells. The following Figure 3 shows the difference between before applying raster clean up tool and after applying the same.
Figure 3: Raster clean-up
• Step 5: As the cadastral maps were prepared, automatic digitization tool was performed using centerline digitization method, as found in Figure 4.
Figure 4: Automatic Digitization
• Step 6: Then topology building was performed to remove the dangling errors and pseudo polygons (Figure 5) and to make the polygon layer having accurate plot area.
Figure 5: Error correction
• Step 7: Now all the polygon sheets for a single village were joined and a single polygon layer containing all the plots of different sheets of respective village, as shown in Figure 6, was prepared.
• Step 8: This is the most important step of assigning geometric coordinates to the digitized polygon layers of plot maps. The features shown in the plot maps are of 1950s-1960s. Since then lot of changes occurred and the study area suffered from dynamic landscaping. Most of the parts or sometimes the whole parts of few villages were eroded by the Ganga. So it was almost impossible to find out same GCPs over the plot maps and on the present
ground or recent satellite images. That’s why image-to-image rectification technique could not be applied. Another attempt was made to register the plot maps geometrically by applying ‘Projective Transformation’ tool of spatial adjustment. The geometrically corrected Block map having village boundaries and geographic coordinates was taken as source map for the transformation. The source and destination coordinates were defined by displacement links. After the transformation the plot maps became geo-referenced.
Figure 6: Single polygon layer containing all plots of a village
Lastly the geometrically corrected plot maps were overlaid on the river course of 2014. The plots covering island area were identified and the total island area for each village was extracted.
4. RESULT AND DISCUSSION
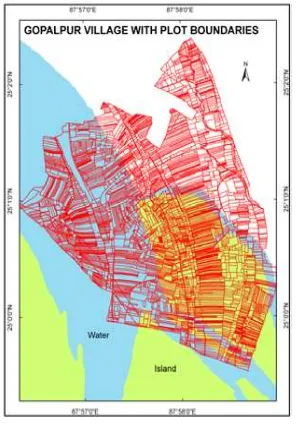
The superimposition of geo-referenced plot maps on the present (2014) river course helped to identify the plots occupying island area and water area. The following Figure 7 shows the same for Gopalpur village.
Figure 7: Plots covering island and water area of Gopalpur The International Archives of the Photogrammetry, Remote Sensing and Spatial Information Sciences, Volume XL-8, 2014
ISPRS Technical Commission VIII Symposium, 09 – 12 December 2014, Hyderabad, India
This contribution has been peer-reviewed.
The Gopalpur village has 6103 plots in total, out of which 2737 (45%) plots were covered by river water, 2204 (36%) plots were found on riverine islands and rests on land. In 2014, nearly 29% (3.64 sq. km.) of the total area of Gopalpur village (12.49 sq. km.) was on island which can be utilized for agriculture purpose following a proper manner. The details of the owner of these Island Covered Plots (ICPs) can be gathered from the ‘Plot Index Report’. Then the ICPs can be handed over to their original owner (if available) or the victims for practicing agriculture over there. There are also some plots which were in the river, as shown in original cadastral maps but presently these plots were on land or island. Government can also take initiatives to utilize these lands in a productive ways so that the victims can be benefitted. These plots can be distributed to the land less people so that they can utilize it and reduce their livelihood risk in future.
5. CONCLUSION
The methodology used to geo-reference the plot maps in the present study was subjected to 0.07% error in terms of total village area. The problem was that village boundaries of plot maps could not be properly matched with the village boundaries shown in the block map. It is because of both the maps were drawn at different scale and also by different methods. Though, the error is negligible.
The present paper is an attempt of finding an actual alternative means of livelihood for the river bank erosion affected victims. By availing the suggested means of livelihood the victims can improve their livelihoods, increase their livelihood assets and acquire the strength to cope up with further risk. In redistribution of re-emerged plots the Government should also take initiatives to avoid any misunderstanding and miscommunication among the victims.
ACKNOWLEDGEMENTS
The authors acknowledge with heartiest thanks and gratefulness to the facilities provided by the department of Civil Engineering, Jadavpur University and department of Geography, University of Nice Sophia-Antipolis to carry on the present research. This is also to acknowledge all the library personnel and other officials of Asiatic Society, NATMO, Census Office, Government of India; Land Record Office, Block Development Offices (Kaliachak-II and III, Manikchak), Panchayet Offices, District Magistrate Office, and Irrigation & Waterways Directorate, Government of West Bengal, and local people of the study area and local NGO workers. The first author is also funded by the scholarship of Jadavpur University and European Commission to carry on the research.
REFERENCES
Lein, H., 2009. The poorest and most vulnerable? on hazards, livelihoods and labelling of riverine communities in Bangladesh. Singapore Journal of Tropical Geography, 30, pp. 98-113.
Chowdhury, E. H., and Hossain, M. Z., 1988. Riverbank erosion in Bangladesh. Geographical Review, 78 (1), pp. 20-31.
Burton, I., Kates, R. W., and White, G. F., 1993. The
Environment as Hazard. Guilford Press, New York, pp.
187-212.
Alam, J. B., Uddin, M., Ahmed, J. U., Cacovean, H., Rahman, M. H., Banik, B. K., and Yesmin, N., 2007. Study of morphological change of river old Brahmaputra and its social imacts by remote sensing. Geographia Technica, 2, pp. 1-11.
Sharma, N., Johnson, F. A., Hutton, C. W., and Clark, M., 2010. Hazard, vulnerability and risk on the Brahmaputra basin: a case study of river bank erosion. The Open Hydrology
Journal, 4, pp. 211-226.
Banerjee, M., 1999. A report on the impact of Farakka barrage on the human fabric. South Asian Network on Dams, Rivers and People, New Delhi. http://sandrp.in/dams/impct_frka
_wcd.pdf (May 17. 2010)
Mukherjee, J., 2011. No Voice, No Choice: Riverine Changes and Human Vulnerability in the Chars of Malda and
Murshidabad. Institute of Development Studies, Kolkata,
Occasional Paper 28, pp. 1-30.
Parua, P. K., 2006. Some Facts about Farakka Barrage Project. Vol-I, Shilpanagari Prakasani, Berhampore, Murshidabad, India.
Sen Majumder, S., and Bhandari, G., 2010. Morphometric changes of river Ganga in post-farakka period. Journal of River
Behaviour & Control, River Research Institute, West Bengal,
INDIA, 30, pp. 41-54.
Barman, B. C., 2010. A Model Study on the Effect of Pond Level on Barrage Gate Operation Maintaining Incipient Motion
Criteria. Thesis in fulfillment for the degree of Doctor of
Philosophy submitted to Jadavpur University, Kolkata, India. The International Archives of the Photogrammetry, Remote Sensing and Spatial Information Sciences, Volume XL-8, 2014
ISPRS Technical Commission VIII Symposium, 09 – 12 December 2014, Hyderabad, India
This contribution has been peer-reviewed.