www.elsevier.nlrlocateraqua-online
Optimal dietary protein and lipid levels for juvenile
ž
/
cobia Rachycentron canadum
Ruey-Liang Chou
a, Mao-Sen Su
a, Houng-Yung Chen
b,)a
Tungkang Marine Laboratory, Taiwan Fisheries Research Institute, Tungkang, Pingtung, 928 Taiwan
b
Institute of Marine Biology, National Sun Yat-sen UniÕersity, Kaohsiung, 804 Taiwan
Received 24 April 2000; received in revised form 5 July 2000; accepted 5 July 2000
Abstract
Two growth trials were conducted to investigate the optimal concentrations of dietary protein and lipid for cobia , a pelagic fish showing great potential for offshore cage culture in tropical and subtropical waters. In the first trial, casein was added to a fish meal-based basal diet to replace starch to render protein concentration gradation ranging between 36% to 60%. All seven diets
Ž
were estimated to be isoenergetic. After an 8-week growth trial, juvenile cobia initial weight 33
.
g fed the diets containing protein concentrations of 44%, 48% and 52% generally attained higher weight gain and feed conversion than the other groups. Polynomial regression analysis revealed a weight gain peak at a dietary protein concentration of 44.5%, which is regarded as the most suitable level for maximum fish growth. In the second trial, the cobia were fed seven isonitroge-nous and isoenergetic test diets containing lipid concentrations ranging from% 3 to 18%. Growth
Ž .
of the fish initial weight 41 g was lowest when the dietary lipid concentration was 3%. Weigh gain increased with increasing lipid inclusion and then leveled off. The broken-line analysis that best expressed the response pattern shows a breakpoint when dietary lipid concentration was 5.76%. No significant growth enhancement was observed when the lipid levels were increased
Ž .
beyond the breakpoint to the highest lipid concentration tested 18% .q2001 Elsevier Science
B.V. All rights reserved.
Keywords: Cobia; Protein; Lipid; Optimal concentration; Nutrient requirement
)Corresponding author. Tel.:q886-7-525-5105; fax:q886-7-525-5115.
Ž .
E-mail address: [email protected] H.-Y. Chen .
0044-8486r01r$ - see front matterq2001 Elsevier Science B.V. All rights reserved. Ž .
1. Introduction
Cobia is an important and popular sport fish in many parts of the world. Its aquaculture has become popular only recently with the success of artificial propagation and larval production. The cobia is regarded as having the greatest potential among all candidate species for offshore cage culture in Taiwan and other tropical waters. Under the present cultivating practice, the cobia can attain 4–6 kg in 1 year and survival is
Ž .
usually high 90% . About 500 tons of whole fish, averaging 6 kgrfish, were exported from Taiwan to Japan during 1999 at a wholesale price of around US$4.8 to 5.7 per kg
ŽFish Farming International, January 2000 . The mostly white meat of the fish is served.
in restaurants as raw fish, sashimi. The belly portion with high lipid content is highly valued.
The cobia is widely distributed in tropical, subtropical and warm temperate seas. A survey of a natural population in the northeastern Gulf of Mexico revealed that the cobia ranged from age 0 to 9–11 and growth is fast through age 2, after which growth slows
Ž . Ž .
gradually Franks et al., 1999 . Cobia adults and juveniles mean 340 g were found to
Ž
be carnivorous and feed exclusively on small fish, crustaceans and squid Franks et al.,
.
1996 . They are strong swimmers and aggressive feeders and quite capable of catching mobile prey. They often feed in the water column and possibly near the surface. Under net cage culture conditions in Taiwan, the cobia are fed either trash fish, or sinking pellets that are modified from feed originally formulated for groupers or seabass. Feed
Ž .
conversion ratios FCRs range from 1.6 to1.8. Proximate analysis of a commercial cobia feed revealed a crude protein concentration of 45.3%, crude lipid concentration of 16.0% and ash concentration of 11.0%.
Despite the rapid development of cage culture of cobia and a steady improvement in feed formulation, little information has been published concerning the nutrient require-ments of this species. Although the preliminary success of commercial compounded feeds points to a rough estimation of the nutrient requirements of this fish, basic nutritional research is still needed to lay the foundation for further feed development. The present study investigated the most suitable concentrations of both protein and lipid for optimal growth of juvenile cobia raised in indoor tanks. Proteins and lipids are the most important chemical ingredients in the diets of most carnivorous fish. The results offer us basic background knowledge on the nutrient requirements of this fish.
2. Materials and methods
2.1. Experiment 1
Seven experimental diets were formulated based on a basal diet in which fish meal
Žcrude protein concentrations67.8 gr100 g and casein crude protein concentration. Ž s
.
84.0 gr100 g were the protein sources. Alpha-starch was used to replace casein to
Ž
render protein concentration gradation ranging between 36 and 60 g per 100 g diet 36%
.
approxi-Ž . Ž .
mate metabolizable energy ME content of 355 kcalr100 g Table 1 . Crude protein content was determined as Kjeldahl N=6.25, whereas ME contents were estimated
Ž
from published values for the dietary ingredients and reported ME Shiau and Huang,
. Ž . Ž . Ž .
1989 for protein 4.5 kcalrg , carbohydrate 3.49 kcalrg and lipid 8.51 kcalrg . All ingredients were thoroughly mixed and wet-extruded as pellets, and dried at 458C. The diets were refrigerated at 48C until fed.
Ž .
Cobia Rachycentron canadum juveniles from a single egg mass were obtained from the hatchery of the Tungkang Marine Laboratory and fed a commercial seabass feed until they were 30–35 g. Eight fish were weighed and stocked into each of 21 fiberglass
Ž . Ž
tanks 1 m in diameter, water depth 30 cm supplied with continuous flow flow
.
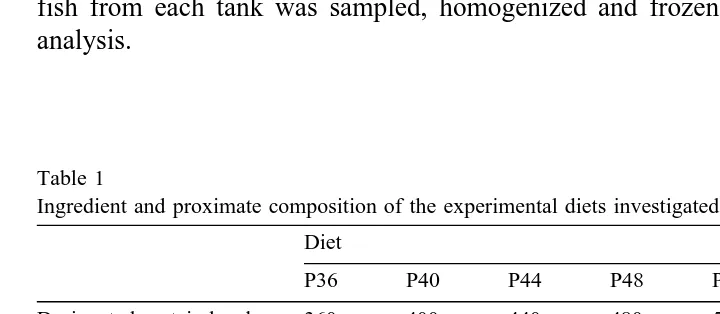
rates2–2.5 lrmin of sand-filtered seawater. Water temperature was maintained at 28"0.58C; and salinity was 32"1‰. Each dietary treatment was randomly assigned to three tanks. The fish were fed twice daily by hand as much as they would consume in 30 min at 0900 and 1600 h. The feeding trials lasted for 8 weeks. Fish were individually weighed biweekly and at the end of the experiment. A portion of lateral muscle of one fish from each tank was sampled, homogenized and frozen for subsequent proximate analysis.
Table 1
Ingredient and proximate composition of the experimental diets investigated in Experiment 1 Diet
P36 P40 P44 P48 P52 P56 P60
Designated protein level 360 400 440 480 520 560 600
wgrkg dry dietx
[ ]
Ingredient composition grkg dry diet
Casein 191 238 286 333 380 429 476
a-Starch 309 258 206 155 103 52 00
Cellulose 0 4 8 12 16 20 24
1
Others 500 500 500 500 501 500 500
2( ) [ ]
Proximate composition ns3 gr100 g dry diet
Crude protein 37.0 43.1 45.1 51.7 54.9 58.0 63.9
Crude lipid 5.8 6.6 7.1 7.5 7.5 7.9 8.8
Vitamin premix supplied the diet with mgrkg dry diet : retinyl acetate 0.1; all-rac-a-tocopherol, 400; menadione, 40; thiamin hydrochloride, 60; riboflavin, 200; pyridoxine hydrochloride, 40; nicotinic acid, 800; D-Ca pantothenate, 280; inositol, 400; biotin, 6.0; folic acid, 15; PABA, 400; choline chloride, 8000; cyanocobalamin, 0.1; ascorbic acid, 2000;b-carotene, 12.
1 Ž .
Other ingredients grkg dry diet : fish meal, 301; squid oil, 30; fish oil, 46; mineral premix, 70; vitamin premix, 30 and carboxymethylcellulose, 23.
2 y1 Ž y1
Metabolizable energy: 355 kcal 100 g diet based on proteins4.5 kcal g ; carbohydrates3.49 kcal
y1 y1 .
2.2. Experiment 2
Ž
Seven dietary treatments with various concentrations of lipid 2.3–18.9 per 100 g
. Ž
diet were examined. The composition of the diets is shown in Table 2. Fish meal crude
.
protein concentrations67.8 gr100 g; crude lipid concentrations14.7 gr100 g , casein
Žcrude protein concentrations84.0 gr100 g and soy protein crude protein concentra-. Ž .
tions62.6 gr100 g; crude lipid concentrations0.9 gr100 g supplied the proteins.
Ž .
Combinations of an oil mixture cod liver oil: soybean oils2: 1 ,a-starch and cellulose rendered all experimental diets isoenergetic. The crude protein concentration was approximately 39%. The procedures for diet preparation and storage were the same as the first experiment.
Ž .
Juvenile cobia 41 g average size were obtained and stocked in indoor fiberglass tanks and fed a commercial seabass feed prior to the start of the experiment. Eight fish were individually weighed and placed into each of the 21 fiberglass tanks. The tanks
Ž .
were supplied with flowing seawater 28"0.58C and 33"1 ppt . Each diet was randomly assigned to three tanks. The feeding scheme was the same as the first experiment. The fish were fed the experimental diets for 8 weeks. At the end of the experiment, fish from each tank were counted and weighed.
Table 2
Ingredient and proximate composition of the experimental diet investigated in Experiment 2 Diet
L3 L6 L9 L12 L15 L18
Designated lipid level 30 60 90 120 150 180
wgrkg dry dietx
[ ]
Ingredient composition grkg dry diet
1
Oil mixture 25 55 85 115 145 175
a-Starch 365 292 219 146 73 0
Cellulose 0 43 86 129 172 215
2
Other 610 610 610 610 610 610
( ) [ ]
Proximate composition ns3 gr100 g dry diet
Crude protein 40.0 39.0 39.4 39.1 38.7 39.7
Crude lipid 2.3 5.4 8.4 12.3 16.6 18.9
Ash 7.8 7.6 7.6 7.6 7.5 7.4
Ž . Ž .
Mineral premix consisted of grkg premix : MgSO .7H 0, 133; Ca H PO4 2 2 4 2, 1; AlCl3P6H O, 7; ZnSO2 4P 7H O, 20; KI, 0.05; K HPO , 0.2; FeSO2 2 4 4P7H O, 35; CuSO2 4P5H O, 10 and NaCl, 50.2
Ž .
Vitamin premix supplied the diet with mgrkg dry diet : retinyl acetate 0.1; all-rac-a-tocopherol, 400; menadione, 40; thiamin hydrochloride, 60; riboflavin, 200; pyridoxine hydrochloride, 40; nicotinic acid, 800; D-Ca pantothenate, 280; inositol, 400; biotin, 6.0; folic acid, 15; PABA, 400; choline chloride, 8000; cyanocobalamin, 0.1; ascorbic acid, 2000;b-carotene, 12.
1 Ž .
Oil mixture was cod liver oil : soybean oils 2:1 vrv .
2 Ž . Ž .
2.3. Satistical analyses
Ž .
Final weight, percent weight gain, feed conversion ratio FCR , protein efficiency
Ž . Ž .
ratio PER , net protein utilization NPU and body composition data were analyzed for
Ž .
statistical significance P-0.05 by analysis of variance, and individual differences between dietary treatments were determined by Duncan’s new multiple range test.
Ž .
Growth responses in terms of average weight gain in gram to dietary protein concentrations in Experiment 1 were estimated by the polynomial regression method
ŽZeitoun et al., 1976 . The broken-line analysis technique Robbins, 1986 was used to. Ž .
Ž .
examine growth response mean weight gain in gram to lipid supplementation in Experiment 2. The breakpoints of the regression equations are regarded as the most suitable levels for optimal growth.
3. Results
3.1. Experiment 1
No fish died during the growth trial. Dietary protein concentrations significantly
ŽP-0.05 affected growth of the fish Table 3 . Final fish weight, weight gain and FCR. Ž .
were highest or best when the protein concentrations were 44%, 48% or 52%. The fish
Ž . Ž .
fed the diets with the highest 60% or lowest 36% protein concentrations showed the poorest growth and FCR among all treatments. The results of PER and NPU tended to show a decreasing trend of efficiency with increasing dietary protein inclusion. Fish fed diets with protein concentrations 56% or higher utilized dietary protein less efficiently
ŽP-0.05. than the other dietary groups. Polynomial regression analysis between
Table 3
Ž . Ž . Ž .
Weight gain, feed conversion ratio FCR , protein efficiency ratio PER and net protein utilization NPU of the cobia fed diets containing graded levels of protein1
2 3 4
Dietary protein, Weight gain, FCR g dry PER g gainrg NPU g body
gr100 g gr100 g feedrg gain protein proteinrg
Initial average body weight was approximately 33.0 g. Values are means"S.E.M. Means within a given
Ž .
column with different superscripts are significantly different P-0.05 . No fish died during the 8-week trial.
2 Ž . Ž .
FCRsfeed supplied grbody weight gain g .
3 Ž . Ž .
PERsbody weight gain grprotein fed g .
4 Ž . Ž .
Table 4
Ž . 1
Muscle proximate composition dry weight basis of the cobia fed diets containing various levels of protein Dietary protein, Protein, gr100 g Lipid, gr100 g Ash, gr100 g
Means "S.E., ns3 with different superscript letters are significantly different P-0.05 .
protein concentration and weight gain of the fish indicated a weight gain peak at dietary protein concentration of 44.5%. Crude protein concentrations of lateral muscle from the cobia fed the diets containing 52% or 60% were significantly higher than those fed 44%
Ž .
or 48% Table 4 . There was no difference in muscle ash concentration among dietary groups.
3.2. Experiment 2
There was no mortality during the 8-week growth trial. Dietary lipid concentration
Ž . Ž .
significantly P-0.05 affected growth and feed conversion of the cobia Table 5 . Among the seven lipid concentrations tested, 3% and 12% groups in general showed inferior growth and feed conversion. The differences among treatments became apparent 6 weeks after the feeding trial began. If data of the 12% group were excluded, there was
Table 5
Ž . Ž .
Weight gain, feed conversion ratio FCR and protein efficiency ratio PER of the cobia fed test diets containing graded levels of lipid in an 8-week period1
2 3
Dietary lipid, Weight gain, FCR g dry PER g gainrg
gr100 g gr100 g feedrg gain protein
Initial average body weight was approximately 41.0 g. Values are means"S.E.M. Means within a given
Ž .
column with different superscripts are significantly different P-0.05 . There was no mortality during the growth trial.
2 Ž . Ž .
FCRsfeed supplied grbody weight gain g .
3 Ž . Ž .
no difference in weight gain when the dietary lipid level was higher than 6%. This relationship of weight gain and dietary lipid level is best expressed by a broken-line analysis. The breakpoint at 5.76% gave the lowest mean square error and thus was the minimum lipid level for optimal fish growth. No significant growth enhancement was observed when the lipid levels were increased beyond the breakpoint to the highest lipid
Ž .
level tested 18% .
4. Discussion
Ž .
The concentration of crude protein 44.5% that produced maximum growth of juvenile cobia in this study is in the lower range of concentrations reported to maximize
Ž
growth of other young fish. Typically, carnivores, such as Asian seabass
Boonyaratpa-. Ž . Ž
lin, 1997 , grouper Chen and Tsai, 1994 , red sea bream, yellowtail, and plaice Wilson,
.
1989 , require 40–55% dietary protein. Like yellowtail, the cobia is a migratory pelagic fish. In natural habitats, juvenile cobia feed predominantly on anchovies, shrimp and
Ž .
Loligo squid Franks et al., 1996 . These carnivorous feeding habits are reflected in its
dietary need for protein. Commercial cobia feeds used presently in Taiwan contain 45% crude protein. This concentration is similar to the optimal concentration obtained in the present study.
The optimal dietary protein concentration for fish is influenced by dietary protein to energy balance, the amino acid composition and digestibility of the test proteins, and the
Ž .
amount of nonprotein energy in the diet Wilson, 1989 . In the present study, high quality fish meal and casein were the protein sources. Although the amino acid or protein digestibility of these protein ingredients are not known, the relatively good FCR, PER and NPU values indicate that assimilation of amino acids was not a problem in this study. The influence of changes in dietary protein to energy ratios on growth and protein
Ž .
utilization has been demonstrated in several species of fish Wilson, 1989 . Nonprotein energy sources, such as lipids or carbohydrates, can spare the need for dietary protein. Lipids serve as an important source of dietary energy for marine fish, which generally
Ž .
have a limited ability to use carbohydrates for energy. Takeuchi et al. 1978 found that the protein content of rainbow trout diets could be reduced from 48% to 35% without reducing weight gain if the lipid concentration was increased from 15% to 20%. Shiau
Ž .
and Lan 1996 reported that dietary protein level for optimal growth of juvenile grouper
Epinephelus malabaricus could be reduced from 50% to 44% when dietary energy level
was increased from 305 to either 340 or 375 kcalr100 g. In experiment 1, the lipid concentration of the test diets ranged from 5.8% to 8.8%, which is relatively low. It is unclear whether increasing dietary energy level can further reduce the optimal protein level obtained in the present study. Increased dietary lipid level in experiment 2 did not result in enhanced growth when the lipid level was beyond 5.8%. This may have been caused by the isoenergetic nature of the test diets, or high-level inclusion of cellulose, or both.
Ž . Ž .
acid EPA and docosahexaenoic acid DHA are supplied at a combined rate of
Ž .
between 0.8 to 2% National Research Council, 1993 . The lipids of the test diets used in Experiment 1 were from fish meal, squid oil and fish oil. These marine oils usually contain up to 20% EPA and DHA. Inclusion of the lipid mixture at the lowest
Ž .
concentration 5.8%, Diet P36 in Experiment 1 would supply 1.2% EPA and DHA to meet probable essential fatty acid requirements. In Experiment 2, dietary lipids were
Ž
derived mainly from an oil mixture 2 portions of cod liver oil : 1 portion of soybean
.
oil and fish meal. The lipids offered by a diet with the estimated optimal dietary lipid
Ž .
concentration 5.76% would supply 0.8–1.2% EPA and DHA after consideration of the contributions from the residual lipids in fish meal. Since there was no difference in growth when lipid concentration was higher than 5.76%, it is likely that the essential fatty acid requirement of cobia is within the range of 0.8–1.2% EPA and DHA in combination.
Dietary lipid concentrations of up to 20% give optimal results with some marine fish,
Ž . Ž .
such as red sea bream Yone et al., 1971 and turbot Adron et al., 1976 . However, too much dietary lipid may result in an imbalance of digestible energyrcrude protein ratio and in excessive fat deposition in the visceral cavity and tissues. Because a majority of aquacultured cobia is consumed as sashimi, it is desirable to increase the lipid concentra-tion in muscle through feeding high-fat diets, as in the case of salmon. In the present study, fish growth in general showed no difference when dietary lipid level was higher than 6% and less than 18%. In practice, commercial cobia feeds contain about 16% crude lipid. Field trials by farmers using high-fat diets resulted an increment of body lipids, including muscle lipids. How much more lipid can be effectively included in the diet of cobia remains unclear. Further studies are needed to investigate the upper limit of lipid inclusion in diets and its effects on carcass composition to optimize both feed conversion and postharvest quality.
Acknowledgements
We thank Hsia Wu for her assistance in chemical analysis and data processing.
References
Adron, J.W., Blair, A., Cowey, C.B., Shanks, A.M., 1976. Effects of dietary energy level and dietary energy
Ž .
source on growth, feed conversion and body composition of turbot Scophthalmus maximus L. . Aquacul-ture 7, 125–132.
Boonyaratpalin, M., 1997. Nutrient requirements of marine food fish cultured in Southeast Asia. Aquaculture 151, 283–313.
Chen, H.Y., Tsai, J.C., 1994. Optimal dietary protein level for the growth of juvenile grouper, Epinphelus malabaricus, fed semipurified diets. Aquaculture 119, 265–271.
Franks, J.S., Garber, N.M., Warren, J.R., 1996. Stomach contents of juvenile cobia, Rachycentron canadum, from the Northern Gulf of Mexico. Fish. Bull. 94, 374–380.
Franks, J.S., Warren, J.R., Buchanan, M.V., 1999. Age and growth of cobia, Rachycentron canadum, from the Northeastern Gulf of Mexico. Fish. Bull. 97, 459–471.
Robbins, K., 1986. A Method, SAS program, and Example of Fitting the Broken Line to Growth Data. Univ. Tenn. Agric. Exp. Stn. Res. Rep. University of Tennessee, Knoxville, TN.
Ž
Shiau, S.Y., Huang, S.L., 1989. Optimal dietary protein level for hybrid tilapia Oreochromis niloticus=O.
.
aureus reared in seawater. Aquaculture 81, 119–127.
Ž
Shiau, S.Y., Lan, C.W., 1996. Optimal dietary protein to energy ratio for growth of grouper Epinephelus
.
malabaricus . Aquaculture 145, 259–266.
Takeuchi, T., Watanabe, T., Ogino, C., 1978. Optimal ration of protein to lipid in diets of rainbow trout. Bull. Jpn. Soc. Sci. Fish. 44, 683–688.
Ž .
Wilson, R., 1989. Amino acids and proteins. In: Halver, J.E. Ed. , Fish Nutrition. Academic Press, San Diego, CA, pp. 112–153.
Yone, Y.M., Furuchi, M., Sakamoto, S., 1971. Study on nutrition of red sea bream: 3. Nutritive value and optimum content of lipids in diet. Rep. Fish. Res. Lab., Kyushu Univ. 1, 49–60.