The impact of climate variability and
change on crop yield in Bulgaria
V.A. Alexandrov
a,∗, G. Hoogenboom
b aNational Institute of Meteorology and Hydrology, BG-1784 Sofia, BulgariabDepartment of Biological and Agricultural Engineering, The University of Georgia, Griffin, GA 30223, USA Received 2 August 1999; accepted 22 May 2000
Abstract
During the recent decade, the problem of climate variability and change, due to natural processes as well as factors of anthropogenetic origin, has come to the forefront of scientific problems. The objective of this study was to investigate climate variability in Bulgaria during the 20th century and to determine the overall impact on agriculture. There was no significant change in the mean annual air temperature. In general, there was a decrease in total precipitation amount during the warm-half of the year, starting at the end of the 1970s. Statistical multiple regression models, describing the relationship between crop yield, precipitation, and air temperature were also developed. Several transient climate change scenarios, using global climate model (GCM) outputs, were created. The Decision Support System for Agrotechnology Transfer (DSSAT) Version 3.5 was used to assess the influence of projected climate change on grain yield of maize and winter wheat in Bulgaria. Under a current level of CO2(330 ppm), the GCM scenarios projected a decrease in yield of winter wheat and especially maize, caused by
a shorter crop growing season due to higher temperatures and a precipitation deficit. When the direct effects of CO2were
included in the study, all GCM scenarios resulted in an increase in winter wheat yield. Adaptation measures to mitigate the potential impact of climate change on maize crop production in Bulgaria included possible changes in sowing date and hybrid selection. © 2000 Elsevier Science B.V. All rights reserved.
Keywords: Climate; Maize; Wheat; DSSAT; Vulnerability; Adaptation
1. Introduction
During the recent decade, the issues of climate vari-ability and climate change have been at the center of many scientific studies (Hulme et al., 1999). Global climate variability and change caused by natural pro-cesses as well as anthropogenetic factors, are major and important environmental issues that will affect the world at the beginning of the 21st century. The earth’s
∗Corresponding author. Tel.:+359-2-9753986;
fax:+395-2-9884494.
E-mail address: [email protected] (V.A. Alexandrov).
climate has exhibited marked ‘natural’ variations and changes, with time scales varying from many millions of years down to a few years. Over periods of 1 or 2 years, fluctuations in global surface temperatures of a few tenths of a degree have been recorded. Some of these are related to the El Niño-Southern Oscillation (ENSO) phenomenon; major volcanic eruptions have also had some impacts. The concentration of green-house gases in the atmosphere continues to increase. This is largely due to human activities, mostly fossil fuel use, land use change, and agriculture. In some re-gions, there is also an increase in the concentration of aerosols, which has an opposite effect on the
tive balances and tend to cool the atmosphere. About 64% of the warming effect due to greenhouse gas in-crease during the last 200 years, is caused by carbon dioxide. These changes in concentration of greenhouse gases and aerosols are projected to lead to regional and global changes in temperature, precipitation and other climate variables. This can ultimately result in global changes in soil moisture, an increase in global mean sea level, and prospects for more severe extreme high-temperature events, floods and droughts in many locations (Houghton et al., 1996).
Global climate change will affect all economic sectors to some degree, but the agricultural sector is perhaps the most sensitive and vulnerable. World agri-culture, whether in developing or developed countries, remains very dependent on climate resources (Down-ing, 1996; Watson et al., 1996). The impact of climate variability on agricultural production is important at local, regional, national, as well as global scales (Kauf-mann and Snell, 1997; Freckleton et al., 1999; Gadgil et al., 1999). Crop yields are affected by variations in climatic factors such as air temperature and pre-cipitation, and the frequency and severity of extreme events like droughts, floods, hurricanes, windstorms, and hail.
Recent research has focused on assessments of the potential impacts of climate change on agriculture at different scales. For example, regional and global estimates of potential climate change on agricultural production were conducted by Harrison et al. (1995), Wolf and Van Diepen (1995), Easterling et al. (1996), Watson et al. (1996) and Adams et al. (1998). The ef-fects of global climate change and possible adaptation measures have been described by Easterling (1996), Smith (1997), and Adams et al. (1999). Also several national assessments have been conducted by Rosen-zweig et al. (1995), Peiris et al. (1996), Elmaayar et al. (1997), Davies et al. (1998), and Lal et al. (1999). Some of the climate change impact studies in eastern Europe were supported through the US Country Stud-ies Program (Smith et al., 1996). StudStud-ies on the impact of expected changes in climate on agricultural produc-tion in Bulgaria have also been initiated by Alexandrov (1997).
The main goal of this project was to study climate variability during the 20th century and the impact on agriculture, and to determine the potential impact of climate change on agriculture in the 21st century
in Bulgaria. Specific objectives included: to create new climate change scenarios for the 21st century in Bulgaria, to simulate the impact of climate variabil-ity and change for the major crops, including maize and winter wheat, and to assess possible adaptation measures for Bulgarian agriculture under an expected climate change.
2. Materials and methods
2.1. Geographic location
Bulgaria is located on the Balkan Peninsula in southeastern Europe. The country includes 31% low-lands (0–200 m), 41% hills (200–600 m), 25% high-lands (600–1600 m), and 3% mountains (>1600 m). The Balkan Mountains split the country into northern and southern Bulgaria, and they have a strong ef-fect on the temperature regime. The annual mean air temperatures in Bulgaria vary from−3.0 to 14.0◦C, depending on the location and elevation. Air temper-ature normally reaches a minimum in January, and a maximum in July. The monthly mean temperature varies from −10.9 to 3.2◦C in January and from 5.0 to 25.0◦C in July. Total precipitation depends on
the circulation patterns, site elevation, and the speci-ficity of local orographic features. Annual mean total precipitation is approximately 500–650 mm, with an annual variation ranging from 440 to 1020 mm. The highest monthly values are measured in June, and at some places in May, with the mean total varying be-tween 55 and 85 mm. February, and sometimes March and September, are the driest months, with mean totals varying between 30 and 45 mm. Mean precip-itation during the warm months, e.g. April through September, is 333 mm, with a standard deviation of 72 mm. Mean precipitation varies from a maximum of 573 mm in the Balkan Mountains to a minimum of 211 mm in southeastern Bulgaria.
2.2. Experimental data
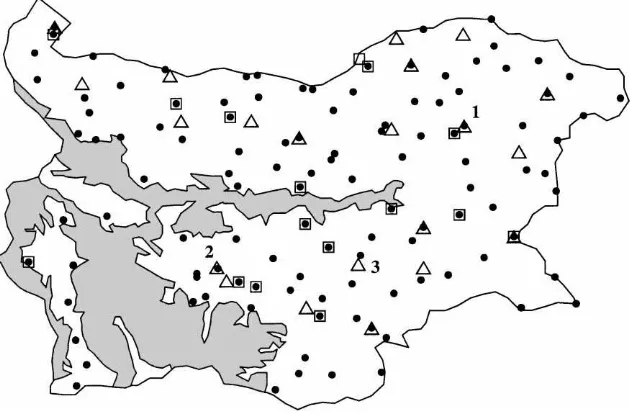
Fig. 1. Spatial distribution of weather and experimental stations in Bulgaria, used in the study: (d) weather stations with available data during 1961–1990; (h) weather stations with available data during 1901–1997; (△) experimental stations (1 — Carev brod, 2 — Ognjanovo, 3 — Radnevo).
the period 1961–1990 (Fig. 1). Weather data had been previously evaluated for erroneous and missing val-ues. All observed meteorological data that were used in this study were provided by the weather network of the Bulgarian National Institute of Meteorology and Hydrology.
The Data Distribution Center (DDC) of the Inter-governmental Panel on Climate Change (IPCC) pro-vided the 30-year averaged transient GCM monthly meteorological outputs for the periods: 1961–1990, 2010–2039, 2040–2069, and 2070–2099 (the latter three periods are referred to as 2020s, 2050s, and 2080s) of the next century. The GCMs used in this study, include the models from the Max-Planck Insti-tute for Meteorology (ECHAM4), UK Hadley Center for Climate Prediction and Research (HadCM2), Canadian Center for Climate Modeling and Analysis (CGCM1), Australian Commonwealth Scientific and Industrial Research Organization (CSIRO-Mk2b), and Geophysical Fluid Dynamics Laboratory (GFDL-R15) (IPCC DDC, 1999). The simulated results from the ‘business as usual’ scenario (IS92a), greenhouse gas and sulfate aerosol forced GCM experiments were used. The outputs for air temperature, precipitation,
and solar radiation of the GFDL-R15 model for the 2080s, were not available.
In general, the GCMs do not simulate the present climate perfectly. It is normally assumed that the model changes predicted from the present to the fu-ture climate are more reliable than the present or the future climate predicted alone (Carter et al., 1994). Regional scenarios can be created by combining average monthly output, obtained by taking the dif-ference between transient GCM runs with observed climate data from the 30-year baseline climate period — adding the change in temperature to the observed temperatures, and multiplying ratio changes in pre-cipitation and solar radiation by their observed daily values during the period 1961–1990 (ANL, 1994).
2.3. Method of investigation
The generic grain cereal model CERES v.3.5 (Ritchie et al., 1998), included in the computerized Decision Support System for Agrotechnology Trans-fer DSSAT v.3.5 (Tsuji et al., 1994) was used to determine the vulnerability of current agricultural management scenarios in Bulgaria. The DSSAT crop models are designed to use a minimum set of soil, weather, genetic, and management information. The models integrate at daily time steps, and therefore, require daily weather data, consisting of maximum and minimum temperature, solar radiation and pre-cipitation, as input. The models calculate crop phase and morphological development as a function of tem-perature, day length, and genetic characteristics. Leaf development, growth, and expansion determine the amount of light intercepted, which is assumed to be proportional to biomass production. The biomass is partitioned to various growing organs in the plant, using a priority system. Water and nitrogen submod-els provide feedback that influences the development and growth processes. All crop models are sensitive to carbon dioxide concentrations (Tsuji et al., 1998). The DSSAT seasonal analysis program (Thornton and Hoogenboom, 1994) was used to simulate pos-sible adaptation measures, and to determine those management scenarios that can decrease the potential agricultural crop vulnerability under expected climate change conditions.
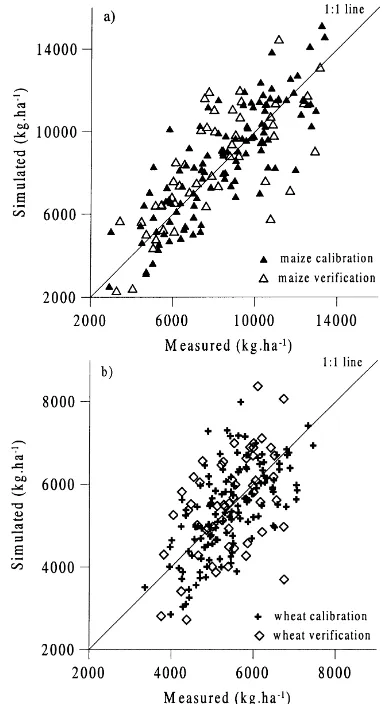
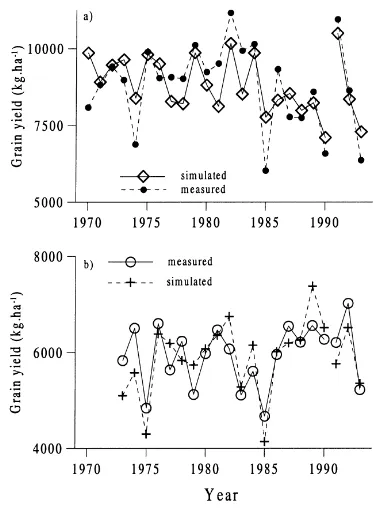
The CERES v.3.5 models of maize and wheat were previously calibrated and verified at 21 experimental variety stations across the country during the period 1980–1993 (Alexandrov and Hoogenboom, 1999). In this study, we used the Bulgarian maize hybrid ‘Knezha 611’ and winter wheat bread variety ‘Sadovo 1’. The phenological and yield data were obtained from the Bulgarian National Variety Commission of the Ministry of Agriculture. Daily weather data, including precipitation, maximum and minimum tem-perature, and simulated solar radiation (Slavov and Georgiev, 1985), were obtained for the same period for the nearest weather station. Simulated phenological stages and grain yields of maize and winter wheat were generally very similar to the measured data (Fig. 2).
The modified temperature, precipitation, and solar radiation databases, corresponding to each of the cli-mate change scenarios, were used to run the CERES
Fig. 2. Comparison between simulated and measured grain yield of maize (a) and winter wheat (b).
v.3.5 simulation models for maize and winter wheat. Crop management and land use were assumed to be constant. The automatic irrigation option of the crop maize model was selected for irrigation applications. Planting dates were selected based on the latitude and information provided by Hershkovich and Stefanov (1982). At planting, 50 kg ha−1 of nitrogen fertilizer
was applied for maize and winter wheat. Simulations were run with and without the direct effects of in-creased atmospheric CO2 levels. In these cases, the
CO2 atmospheric concentrations were assumed to be
3. Results and discussion
3.1. Climate variability and its effect on maize and winter wheat yield
3.1.1. Climate variability
In the initial analysis, long-term variations of air temperature in Bulgaria were investigated. In Fig. 3, anomalies of mean annual air temperature in Bulgaria, relative to the current climatic conditions are presented. Generally, there did not seem to be a significant change in mean annual air temperature in Bulgaria during the 20th century.
The period from the 1920s to 1950s was character-ized as a warmer period during the warm-half of the year, i.e. April–September. There has been an obvious increase in air temperature during April–September since the end of the 1970s, despite lower air tem-peratures in 1991 and 1997. A slight increase in air temperature during the cold-half of the year, i.e. October–March was observed. This trend is most ob-vious during the winter, i.e. January–March, due to a significant warming in January and February. Spring, i.e. April–June, also tends to be warmer at the end of the 20th century. However, summer air tempera-tures, i.e. July–August, tended to be a little bit lower. The average air temperature for June showed a slight increase, while air temperatures in July and August showed an overall decrease, mainly due to a signifi-cant cool spell during the 1970s. Air temperature in
Fig. 3. Anomalies of annual mean air temperature in Bulgaria, relative to the period 1961–1990.
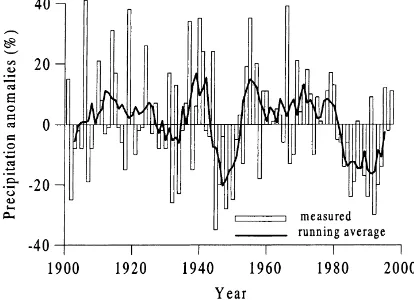
Fig. 4. Anomalies of annual precipitation in Bulgaria, relative to the period 1961–1990.
autumn, i.e. October–December, varied around the current climatic values without any definite changes.
Annual precipitation in Bulgaria varied consider-ably from year to year during the study period. In some years, very low annual precipitation ushered in droughts of different intensities. Bulgaria experienced several drought episodes during the 20th century, most notably in the 1940s and 1980s (Fig. 4), which were observed everywhere across the country. Generally, mean annual precipitation in Bulgaria showed an over-all decrease for the period from 1901 to present.
There was a decrease in precipitation for the pe-riod from April to September, starting at the end of 1970s. Precipitation has been below normal or the 1961–1990 average for the 13 of the last 17 years in this study. The years 1985, 1988, and 1993 were among the driest warm-half years. There was no significant overall trend in precipitation during the cold-half of the year, despite the decreasing trend that has been observed since the end of 1960s. A deficit in winter precipitation was observed during the last decade. Both spring and summer, as well as autumn precipitation have shown a tendency to de-crease during the 20th century. However, February, April, August, and December have shown an increas-ing trend in precipitation, while all other months have had precipitation reductions during the study period.
of 5 and 10◦C; and accumulated temperatures during these periods as agroclimatic indexes. The beginning of the periods above 5 and 10◦C usually occurred in March and April, while the end of these periods can be observed in November and October, respectively. Potential crop growing seasons above the two thresh-olds started earlier in the 1910s, and 1920s, 1940s, and during the last decade, except for 1996 and 1997. The beginning of these periods occurred later in the 1900s, 1950s, and 1970s. As a result of these varia-tions, a slight delay of the beginning for the growing conditions above a base of 5◦C was found. The
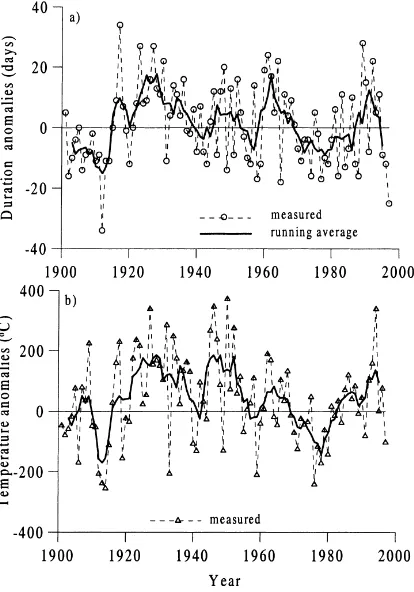
vari-ations for the end of the period above bases of 5 and 10◦C occurred 2–3 days earlier. Overall, this caused a decrease in the duration of potential crop growing season above 5 or 10◦C (Fig. 5a). From the middle of the 1920s until the end of 1970s, there is significant decrease in total accumulated degree days for growing
Fig. 5. Anomalies of duration of the period (a) and accumulated air temperatures (b) above a base of 10◦C, relative to the period
1961–1990.
season above either 5 or 10◦C. Since the early 1980s, an increase in total accumulated degree days has been observed (Fig. 5b).
3.1.2. Crop-weather relations
Soil and climatic conditions in Bulgaria are suit-able for cultivation of maize. However, sometimes a precipitation deficit and high air temperature oc-cur during the critical period of maize development. Both factors are the ones that most limit growth, development, and final yield of maize in Bulgaria. In Fig. 6a and b, the long-term fluctuations for the period 1970–1993 and trends of mean air tempera-ture and precipitation from April to September across the Bulgarian territory for elevations below 800 m are presented. During the period 1970–1993, the trends of these meteorological variables are opposite. The variation in air temperature, and especially in precipitation, affected the national levels of maize production.
Statistical models were developed for regional as-sessment of maize and winter wheat productivity in Bulgaria. For the northern part of the country (NB), the following equations were obtained:
YmzNB=18.4RMARNB +20.8(RJULNB +RAUGNB )+5908.8,
r=0.77 (1)
YwhNB= −639.4T¯MAYNB −17.9RMAYNB +17503.2,
r=0.78 (2)
where YmzNB, YwhNB are the average maize and win-ter wheat grain yield in north Bulgaria (kg ha−1), RMARNB , RMAYNB , RJULNB, RNBAUG the average precip-itation in north Bulgaria in March, May, July and August, respectively (mm);T¯MAYNB the mean air tem-perature in north Bulgaria in May (◦C) and r is the correlation coefficient.
Fig. 6. Long-term fluctuations of mean air temperature (a) and pre-cipitation (b) during the warm-half of the year (April–September) and average grain yield of maize (c) at the experimental stations.
calculated grain wheat yield during the study period did not exceed 11%, except for 1974.
3.2. Climate change scenarios
The current (1961–1990) climatic outputs from the GCMs should first be compared with averaged ob-served climatic data for a region, not with site-specific climate data. To expect that a large GCM grid box can represent climate for any particular point is
unreason-Fig. 7. Comparison between simulated and measured mean grain yield of maize (a) and winter wheat (b) at the experimental crop stations in north Bulgaria during the periods 1970–1990 for cali-bration and 1991–1993 for verification.
able (ANL, 1994). Therefore, averages of observed and simulated monthly air temperature and precipita-tion normals from 114 locaprecipita-tions were used.
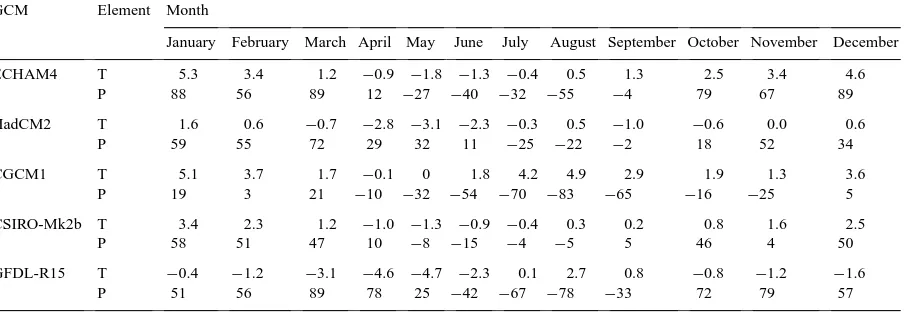
Based on the comparisons shown in Table 1, the HadCM2 model was considered to be the most appro-priate transient GCM to simulate monthly air temper-ature in Bulgaria. The difference between simulated and observed monthly air temperature exceeded 2◦C for only 3 months, i.e. April, May, and June. The GFDL-R15 model also simulated monthly air tem-perature well during the period from September to February (Table 1).
Table 1
Deviations of global climate model (GCM) monthly outputs for the period of current climate, air temperature T (◦C) and precipitation P
(%), relative to the observed (1961–1990) climate in Bulgaria GCM Element Month
January February March April May June July August September October November December
ECHAM4 T 5.3 3.4 1.2 −0.9 −1.8 −1.3 −0.4 0.5 1.3 2.5 3.4 4.6
P 88 56 89 12 −27 −40 −32 −55 −4 79 67 89
HadCM2 T 1.6 0.6 −0.7 −2.8 −3.1 −2.3 −0.3 0.5 −1.0 −0.6 0.0 0.6
P 59 55 72 29 32 11 −25 −22 −2 18 52 34
CGCM1 T 5.1 3.7 1.7 −0.1 0 1.8 4.2 4.9 2.9 1.9 1.3 3.6
P 19 3 21 −10 −32 −54 −70 −83 −65 −16 −25 5
CSIRO-Mk2b T 3.4 2.3 1.2 −1.0 −1.3 −0.9 −0.4 0.3 0.2 0.8 1.6 2.5
P 58 51 47 10 −8 −15 −4 −5 5 46 4 50
GFDL-R15 T −0.4 −1.2 −3.1 −4.6 −4.7 −2.3 0.1 2.7 0.8 −0.8 −1.2 −1.6
P 51 56 89 78 25 −42 −67 −78 −33 72 79 57
either considerably overestimated or underestimated precipitation for most months.
The transient GCMs predicted that annual temper-atures in Bulgaria are to rise between 0.7 (HadCM2) and 1.8◦C (GFDL-R15) in the 2020s. However, the
HadCM2 model simulated a slight decrease in air tem-perature for November in the 2020s. A warmer climate is also predicted for the 2050s and 2080s, with an an-nual temperature increase ranging from 1.6 (HadCM2) to 3.1◦C (GFDL-R15) in the 2050s, and 2.9 (HadCM2 and CGCM1 models) to 4.1◦C (ECHAM4) in the 2080s. Warming is projected to be higher during the summer in the 2080s.
The CGCM1 model predicted an increase in annual precipitation in the 2020s and 2050s. The GFDL-R15 model projected a decrease in precipitation in May, June and July in the 2020s and 2050s. The ECHAM4, HadCM2, and CSIRO-Mk2b models simulated a de-crease in monthly, seasonal and annual precipitation in the 2080s. The changes in monthly solar radiation are expected to vary between −10 and 10% during the next century. An increase of solar radiation is ex-pected during the cold-half of the year, based on the ECHAM4 model runs.
3.3. Vulnerability assessments of maize and winter wheat
All transient GCM climate change scenarios used in the CERES simulation model projected a shorter
vegetative and reproductive growing season for maize and winter wheat during the 21st century. These changes were caused by the predicted temperature increase of the GCM scenarios. The duration of the regular crop-growing season for maize was between 5 (HadCM2) and 20 (GFDL-R15) days shorter in the 2020 s. Maturity dates for maize were expected to occur between 11 and 30 days earlier in the 2050s. The predicted changes in the crop-growing duration for maize in the 2050s were less for the HadCM2, CGCM1, and CSIRO-Mk2b climate change scenar-ios than the changes predicted by the ECHAM4 and GFDL-R15 models. These last two models simu-lated a higher increase of air temperature in Bulgaria, especially the GFDL-R15 model, during the sum-mer months July and August. The GCM climate change scenarios for the 2080s projected a decrease in maize growing season by 17 (CSIRO-MK2b) to 39 (ECHAM4 and CGCM1) days. This will cause a shift in harvest maturity dates for maize from September to August at the end of the next century.
transient GCM climate change scenarios predicted that harvest maturity for winter wheat would be ap-proximately 1–2 weeks earlier in the 2050s, and between 2–3 weeks earlier in the 2080s.
The decrease in simulated maize yield for the next century was primarily caused by a shorter growing season duration and reductions in precipitation. All GCMs simulated a decrease in precipitation from March to June for the 2080s, which affected soil moisture recharge during the spring and the early de-velopmental stages of maize. The simulated increase in maize grain yield for the HadCM2 climate change scenario for the 2020s was due to a relatively low projected increase in air temperature, as well as a pre-dicted increase in precipitation in July. Because maize is a C4crop, an increased level of CO2alone had no
significant impact on either maize crop growth, and development or final yield (Tables 2–4). Maize yield decreased by 3–8% in the 2020s for the ECHAM4, CGCM1, and CSIRO-Mk2b model scenarios. The projected decrease was highest for the GFDL-R15 model, e.g. between 8 and 14%, while the HadCM2
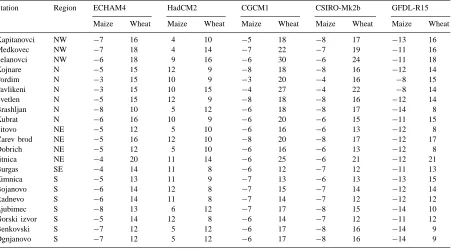
Table 2
Departures of grain yield (%) for maize and winter wheat under transient global climate model scenarios for the 2020s (CO2=447 ppm), relative to the current climate
Station Region ECHAM4 HadCM2 CGCM1 CSIRO-Mk2b GFDL-R15
Maize Wheat Maize Wheat Maize Wheat Maize Wheat Maize Wheat
Kapitanovci NW −7 16 4 10 −5 18 −8 17 −13 16
Medkovec NW −7 18 4 14 −7 22 −7 19 −11 16
Selanovci NW −6 18 9 16 −6 30 −6 24 −11 18
Kojnare N −5 15 12 9 −8 18 −8 16 −12 14
Pordim N −3 15 10 9 −3 20 −4 16 −8 15
Pavlikeni N −3 15 10 15 −4 27 −4 22 −8 14
Svetlen N −5 15 12 9 −8 18 −8 16 −12 14
Brashljan N −8 10 5 12 −6 18 −8 17 −14 8
Kubrat N −6 16 10 9 −6 20 −6 15 −11 15
Sitovo NE −5 12 5 10 −6 16 −6 13 −12 8
Carev brod NE −5 16 12 10 −8 20 −8 17 −12 17
Dobrich NE −5 12 5 10 −6 16 −6 13 −12 8
Jitnica NE −4 20 11 14 −6 25 −6 21 −12 21
Burgas SE −4 14 11 8 −6 12 −7 12 −11 13
Zimnica S −5 13 11 9 −7 13 −6 13 −13 15
Bojanovo S −6 14 12 8 −7 15 −7 14 −12 14
Radnevo S −6 14 11 8 −7 14 −7 12 −12 12
Ljubimec S −8 13 6 12 −7 17 −8 15 −14 10
Gorski izvor S −5 14 12 8 −6 14 −7 12 −11 12
Benkovski S −7 12 5 12 −6 17 −8 16 −14 9
Ognjanovo S −7 12 5 12 −6 17 −8 16 −14 9
scenario projected an increase from 4 to 12% for the next decades. A slight increase at the most ex-perimental stations in northeast and south Bulgaria is even projected under the HadCM2 climate change scenario for the 2050s (Table 3). The decrease in simulated maize yield for the 2050s ranged for most stations from 10 to 20% for the ECHAM4, CGCM1, CSIRO-Mk2b, and GFDL-R15 GCM scenarios. The largest decrease in maize yield is expected to occur at the end of the century.
All transient GCM climate change scenarios for the 21st century, including the adjustment for only air tem-perature, precipitation and solar radiation, projected a reduction in winter wheat yield across Bulgaria. Projected yield reductions at the experimental station Radnevo (south Bulgaria) varied between 0 and 7% during the 2020s and 2050s, and between 4 and 20% in the 2080s. When the direct effect of higher CO2levels
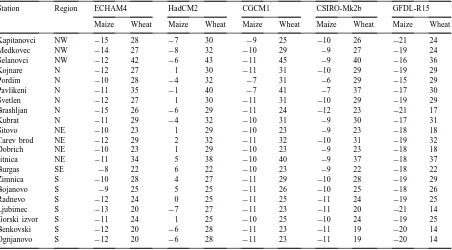
Table 3
Departures of grain yield (%) for maize and winter wheat under transient global climate model scenarios for the 2050s (CO2=554 ppm), relative to the current climate
Station Region ECHAM4 HadCM2 CGCM1 CSIRO-Mk2b GFDL-R15
Maize Wheat Maize Wheat Maize Wheat Maize Wheat Maize Wheat
Kapitanovci NW −15 28 −7 30 −9 25 −10 26 −21 24
Medkovec NW −14 27 −8 32 −10 29 −9 27 −19 24
Selanovci NW −12 42 −6 43 −11 45 −9 40 −16 36
Kojnare N −12 27 1 30 −11 31 −10 29 −19 29
Pordim N −10 28 −4 32 −7 31 −6 29 −15 29
Pavlikeni N −11 35 −1 40 −7 41 −7 37 −17 30
Svetlen N −12 27 1 30 −11 31 −10 29 −19 29
Brashljan N −15 26 −6 29 −11 24 −12 23 −21 17
Kubrat N −11 29 −4 32 −10 31 −9 30 −17 31
Sitovo NE −10 23 1 29 −10 23 −9 23 −18 18
Carev brod NE −12 29 2 32 −11 32 −10 31 −19 32
Dobrich NE −10 23 1 29 −10 23 −9 23 −18 18
Jitnica NE −11 34 5 38 −10 40 −9 37 −18 37
Burgas SE −8 22 6 22 −10 23 −9 22 −18 22
Zimnica S −10 28 4 27 −11 29 −10 28 −19 29
Bojanovo S −9 25 5 25 −11 26 −10 25 −18 26
Radnevo S −12 24 0 25 −11 25 −11 24 −19 25
Ljubimec S −13 20 −7 27 −11 23 −11 20 −21 14
Gorski izvor S −11 24 1 25 −10 25 −10 24 −19 25
Benkovski S −12 20 −6 28 −11 23 −11 19 −20 14
Ognjanovo S −12 20 −6 28 −11 23 −11 19 −20 14
of C3 crops, which are more sensitive to changes in
CO2 concentration than the group of C4 crop, such
as maize. The CO2effect alone caused an increase in
wheat yield 10–20% above the baseline (1961–1990) for the 2020s. The simulated deviations of wheat yield increased in the 2050 by more than 20–25% for the ECHAM4, HadCM2, CGCM1, and CSIRO-Mk2b climate change scenarios. The increase in wheat yield varied from 14 to 37% for the GFDL-R15 scenario, depending on the location. Despite expected high air temperatures and precipitation reductions during the spring in the 2080s, projected increases in wheat yield varied between 12 and 49% due to the fertilization impact of the increased CO2level.
3.4. Adaptation options
The sowing dates of spring crops in Bulgaria could shift under the GCM climate change scenarios in or-der to reduce the yield loss caused by an increase in temperature. The selection of an earlier sowing date for maize will probably be the appropriate response
to offset the negative effect of a potential increase in temperature (Fig. 8). This change in planting date will allow for the crop to develop during a period of the year with lower temperatures, thereby decreasing developmental rates and increasing the growth dura-tion, especially the grain filling period. The results depicted in Fig. 8 show that the sowing date of maize for the experimental station Carev brod (northeast Bulgaria) should occur at least 2 weeks earlier in the 2080s under the ECHAM4 scenario, relative to the current climate conditions. It should be noted, however, that although changes in sowing date are a no-cost decision that can be taken at the farm-level, a large shift in sowing dates probably would inter-fere with the agrotechnological management of other crops, grown during the remainder of the year.
Table 4
Departures of grain yield (%) for maize and winter wheat under transient global climate model scenarios for the 2080s (CO2=697 ppm), relative to the current climate
Station Region ECHAM4 HadCM2 CGCM1 CSIRO-Mk2b GFDL-R15
Maize Wheat Maize Wheat Maize Wheat Maize Wheat Maize Wheat
Kapitanovci NW −19 24 −24 24 −22 27 −13 31 NA NA
Medkovec NW −17 27 −28 29 −20 28 −10 34 NA NA
Selanovci NW −14 39 −27 41 −18 48 −9 57 NA NA
Kojnare N −19 40 −14 24 −22 40 −12 41 NA NA
Pordim N −12 36 −22 27 −18 40 −7 42 NA NA
Pavlikeni N −15 30 −20 39 −18 38 −8 49 NA NA
Svetlen N −19 40 −14 24 −22 40 −12 41 NA NA
Brashljan N −19 17 −21 29 −21 20 −14 30 NA NA
Kubrat N −14 44 −23 25 −18 44 −10 46 NA NA
Sitovo NE −16 23 −10 32 −18 28 −11 36 NA NA
Carev brod NE −18 42 −14 24 −22 42 −12 43 NA NA
Dobrich NE −16 23 −10 32 −18 28 −11 36 NA NA
Jitnica NE −16 47 −12 33 −20 46 −12 49 NA NA
Burgas SE −10 31 −9 16 −14 28 −10 30 NA NA
Zimnica S −19 40 −14 24 −22 40 −12 41 NA NA
Bojanovo S −10 35 −11 19 −15 32 −11 34 NA NA
Radnevo S −13 33 −20 18 −19 32 −13 34 NA NA
Ljubimec S −18 11 −21 23 −21 14 −13 21 NA NA
Gorski izvor S −15 33 −15 18 −20 32 −13 34 NA NA
Benkovski S −19 12 −20 23 −20 14 −14 20 NA NA
Ognjanovo S −19 12 −20 23 −20 14 −14 20 NA NA
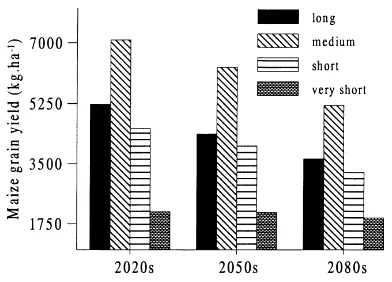
decrease of final yield under a potential warming in Bulgaria. However, using hybrids with a medium growing season, would be beneficial for maize pro-ductivity (Fig. 9). Technological innovations,
includ-Fig. 8. Cumulative probability function of maize yield at Carev brod under the ECHAM4 climate change scenarios for the 2080s and different sowing dates (CO2=697 ppm).
ing the development of new crop hybrids and cultivars that may be bred to better match the changing climate, are considered as a promising adaptation strategy. However, the cost of these innovations is still unclear.
4. Limitations
Using the observed, e.g. 1961–1990 climate data for creating climate change scenarios, provides spatial and temporal variability. However, it assumes that there is no change in climate variability in the future, com-pared to current conditions. The created GCM climate change scenarios do not include changes in climate variability, which might represent a very important factor for crop production. An additional limitation of using GCMs is that, although they accurately repre-sent global climate, their estimates of current regional climate are often inaccurate. In many regions, GCMs significantly underestimate or overestimate current temperatures and precipitation (Grotch and MacCracken, 1991). Also, the spatial scale of most GCMs is too large. A single GCM, or even several GCMs, may not represent the range of potential climate change in a region. In this study, it was con-sidered that the selected GCMs that gave a better estimate of current (observed) climate conditions, would also give better estimates of changed climate conditions. There is no guarantee, however, that this assumption is correct.
The crop model CERES v.3.5 embodies a number of simplifications. For example, the impacts of weeds, diseases, and insect pests on crop growth, develop-ment, and final yield formation were assumed to be controlled. There was also no problem with soil con-ditions, e.g. salinity or acidity, and there were no ex-treme weather events, such as hurricanes, heavy rains, hailstorms, and dry winds, or changes in the frequency of drought occurrence. Technology and land use were assumed to be constant under the vulnerability assess-ments, even though it is certain that they will change in the future. Thus, the impact of climatic change on yield in farmers’ fields may be different from those simulated by the crop models.
5. Concluding remarks
In this study, we did not find a significant change in the mean annual air temperature in Bulgaria during the 20th century. This is in contrast to the global mean near-surface air temperature, which has increased. Bulgaria has experienced several drought episodes
during the 20th century, most notably in the 1940s and 1980s. The mean annual precipitation of Bulgaria has decreased during the 20th century. From the end of the 1970s, we also found a decrease in precipitation during the summer months from April to September.
A potential change in climate will impact agri-cultural production, either positively or negatively. Under the current level of CO2, the transient GCM
scenarios projected a decrease in both winter wheat and especially maize yield for the 2020s, 2050s, and 2080s. These yield reductions were mainly caused by a shortened vernalization period for winter wheat, and a shorter crop growing season duration for both crops. The simulated increase in maize grain yield for the HadCM2 climate change scenario for the 2020s was due to the relatively low projected increase in air temperature, and a predicted increase in precipitation in July. When the direct effect of CO2was included,
all GCM scenarios resulted in an increase in winter wheat yield. As maize is a C4crop, an increased level
of CO2 alone had no significant impact on growth
and final yield.
Results from the adaptation assessments suggest that possible changes in sowing date and hybrid selec-tion can reduce the negative impact of potential warm-ing on maize yield durwarm-ing the next century. Changes in cropping mixtures, irrigation, and agricultural land use can be additional alternative options for adaptation in agriculture. Some economic adaptation measures, such as substitution possibilities for other crops, avail-ability, and costs of alternative production techniques, are recommended for evaluation in the future.
Acknowledgements
This work was partially supported by a grant from the National Science Foundation/North Atlantic Treaty Organization, State and Federal Funds allo-cated to Georgia Agricultural Experiment Stations Hatch Project GEO01513, and INCO-Copernicus Project ERBIC 15CT 98 0105.
References
Adams, R.M., Hurd, B.H., Reilly, J., 1999. Agriculture and global climate change — a review of impacts to US agricultural resources. Pew Center on Global Climate Change, Arlington, VA, USA.
Alexandrov, V., 1997. Vulnerability of agronomic systems in Bulgaria. Climatic Change 36, 135–149.
Alexandrov, V., Hoogenboom, G., 1999. Evaluation of the CERES model for maize and winter wheat in southeastern Europe. In: Proceedings of the International Symposium on Modeling Cropping Systems. European Society for Agronomy, University of Lleida, Catalonia, Spain, pp. 131–132.
Argonne National Laboratory (ANL), 1994. Guidance for vulnerability and adaptation assessments. US Country Studies Program, Washington DC, USA, 205 pp.
Carter, T.R., Parry, M.L., Harasawa, H., Nishioka, S., 1994. IPCC technical guidelines for assessing climate change impacts and adaptations. University College London and Center for Global Environmental Research, United Kingdom and Tsukuba, Japan, pp. 52–53.
Davies, A., Jenkins, T., Pike, A., Shao, J., Carson, I., Pollock, C., Pary, M.L., 1998. Modeling the predicted geographic and economic response of UK cropping systems to climate change scenarios: the case study of sugar beet. Ann. Appl. Biol. 133 (1), 135–148.
Downing, T.E. (Ed.), 1996. Climate change and world food security. NATO ASI Series. Series I: Global Environmental Change 37, Springer, Berlin, 662 pp.
Easterling, W.E., 1996. Adapting North-American agriculture to climate change in review. Agric. For. Meteorol. 80 (1), 1–53. Easterling, W.E., Chen, X., Hays, C., Brandle, J.R., Zhang, H.,
1996. Improving the validation of model-simulated crop yield response to climatic change: an application to the EPIC model. Climate Res. 6, 263–273.
Elmaayar, M., Singh, B., Andre, P., Bryant, C.R., Thouez, J.P., 1997. The effect of climatic change and CO2 fertilization on agriculture in Quebec. Agric. For. Meteorol. 85 (3/4), 193–208. Freckleton, R.P., Watkinson, A.R., Webb, D.J., Thomas, T.H., 1999. Yield of sugar beet in relation to weather and nutrients. Agric. For. Meteorol. 93 (1), 39–51.
Gadgil, S., Rao, P.R.S., Sridhar, S., 1999. Modeling impact of climate variability on rainfed groundnut. Curr. Sci. 76 (4), 557– 569.
Grotch, S., MacCracken, M., 1991. The use of general circulation models to predict regional climatic change. J. Climate 4, 286– 303.
Harrison, P., Butterfield, R., Downing, T. (Eds.), 1995. Climate change and agriculture in Europe — assessment of impacts and adaptation. University of Oxford, UK, 411 pp.
Hershkovich, E., Stefanov, I., 1982. Agroclimatic Atlas of Bulgaria. GU Hydrology and Meteorology, Sofia, 117 pp.
Houghton, J., Meira Filho, L., Callander, B., Harris, N., Kattenberg, A., Maskell, K. (Eds.), 1996. Climate Change 1995 — The Science of Climate Change. Contribution of WG I to the Second Assessment Report of the IPCC, 570 pp.
Hulme, M., Barrow, E.M., Arnell, N.W., Harrisson, P.A., Johns, T.C., Downing, T.E., 1999. Relative impacts of human-induced climate change and natural climate variability. Nature 397, 688– 691.
Intergovernmental Panel on Climate Change Data Distribution Centre (IPCC DDC), 1999. Data/information supplied by the IPCC Data Distribution Centre for climate change and related scenarios for impact assessments, Version 1.0. April 1999, Norwich, UK.
Kaufmann, R.K., Snell, S.E., 1997. A biophysical model of corn yield: integrating climatic and social determinants. Am. J. Agron. Econ. 79, 178–190.
Lal, M., Singh, K.K., Srinivasan, G., Rathore, L.S., Naidu, D., Tripathi, C.N., 1999. Growth and yield responses of soybean in Madhya Pradesh, India to climate variability and change. Agric. For. Meteorol. 93 (1), 53–70.
Peiris, D.R., Crawford, J.W., Grashoff, C., Jefferies, R.A., Porter, J.R., Marshall, B., 1996. A simulation study of crop growth and development under climate change. Agric. For. Meteorol. 79, 271–287.
Ritchie, J., Singh, U., Godwin, D., Bowen, W., 1998. Cereal growth, development and yield. In: Tsuji, G., Hoogenboom, G., Thornton, P. (Eds.), Understanding Options for Agricul-tural Production. Kluwer Academic Publishers, Dordrecht, pp. 79–98.
Rosenzweig, C., Allen, L., Harper, L., Hollinger, S., Jones, J. (Eds.), 1995. Climate Change and Agriculture: Analysis of Potential International Impacts. American Society of Agronomy, Vol. 59, 382 pp.
Slavov, N., Georgiev, G., 1985. Estimating photosynthetic active radiation (PhAR) by sunshine duration. Crop Physiol. 11 (4) 65–71 (in Bulgarian).
Smith, J.B., 1997. Setting priorities for adapting to climate change. Global Environ. Change — Hum. Policy Dimensions 7 (3), 251–264.
Smith, J., Bhatti, N., Menzhulin, G., Benioff, R., Budyko, M., Campos, M., Jallow, B., Rijsberman, F. (Eds.), 1996. Adapting to Climate Change. Springer, Berlin, 475 pp.
Thornton, P., Hoogenboom, G., 1994. A computer program to analyze single-season crop model outputs. Agron. J. 86, 860– 868.
Tsuji, G., Uehara, G., Balas, S. (Eds.), 1994. DSSAT version 3, Vol. 1–3. IBSNAT, University of Hawaii, Honolulu.
Tsuji, G., Hoogenboom, G., Thornton, P., 1998. Understanding Options for Agricultural Production. Kluwer Academic Publishers, Dordrecht, 399 pp.
Watson, R., Zinyowera, M., Moss, R. (Eds.), 1996. Climate Change 1995 — Impacts, Adaptation and Mitigation of Climate Change. Contribution of WG II to the Second Assessment Report of the IPCC, Cambridge University Press, Cambridge.