Xiaodan Shi
a,*
,
Guorui Ma
a,
Fenge Chen
b,
Yanli Ma
a aState Laboratory for Information Engineering in Surveying, Mapping and Remote Sensing, Wuhan University, 129
Luoyu Road, Wuhan, Hubei, 430079, China-(sxdrs,mgr,mayanli)@whu.edu.cn
b
Department of Statistics, Wuhan University of Technology, 129 Luoshi Road, Wuhan, Hubei, 430079, China-
[email protected]
Commission VII,WG VII/5
KEYWORDS:
change detection, kernel function, similarity measure, probability density
ABSTRACT
x
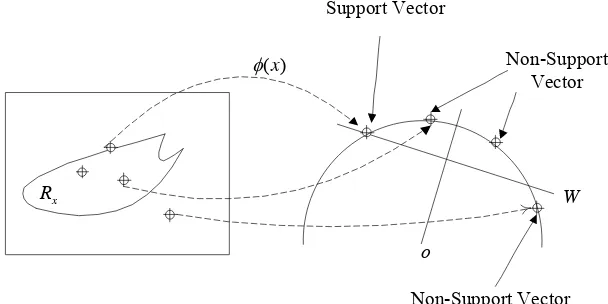
Figure 1 The one-class SVM Mapping
Any hyper plane in high dimension feature space can be hyperplane corresponds to decision function, namely, PD estimation (figure 1).
Figure1 illustrates the map of spatial data points in the original space non-linearly into the high-dimensional feature space. The PD estimation in the original space is converted into the process of seeking optimal separating hyper plane in the feature space. A data point on the hyper plane is non-support vector, while the points mapped on the hyper plane are support vector. The hyper plane can be defined as a combination of these points. The points that are mapped below the hyper plane are interval mistake samples. Of all the possible hyper planes, the one that matches optimal PD estimation satisfy the following optimization criterion:
2
The final decision function is
(4)
Lagrange multiplier is used to solve the problem of optimization, where coefficient , and the corresponding Lagrange function are given as following
2
Set the derivatives with respect to the primal variables , yielding
Substitute them in the decision function, then
}
function, then obtain the dual problem:1 samples of which are non-zero are called Support Vectors (SV). In accordance with any SV, see the following function:
¦
.
3 CHANGE DETECTION BASED ON KERNEL SIMILARITY MEASURE
Assume that the local pixels of bi- temporal images to be compared are vector sets and respectively. Use two one-class SVMs to train the samples and independently and get their PD functions respectively, yielding two regions and , equivalently, and two hyper planes and in feature space H. These two hyper planes are parameterized by
) ,
(wp
U
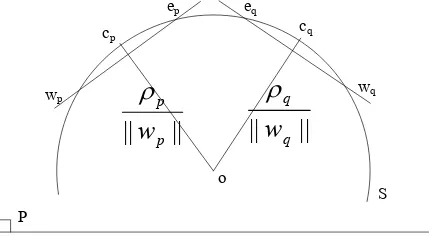
p and(wq,Uq)respectively. The vectors anddefine a two dimensional plane, denoted by ,which intersects the hyper sphere along a circle with center O and radius 1, as depicted in Figure 2. If there is no change in the physic local
area, the vectors and are collinear, in other words, the two hyper planes are overlapped. The more change, the bigger the angle between the two hyper planes. Arc is the angle between the two hyper planes. However, the difference between the two hyper planes can’t be completely defined by the angle, because translation exists between them. A better dissimilarity measure is shown as follows
wp wq
Figure 2 Sketch map of the high-dimensional feature space
Dissimilarity measure for the feature space
)
d denotes the intra-region distance of bi-temporal images, and , denote the inter-region distance of each image respectively, DS(p,q) is the ratio
between the intra-region distance and inter-region distance of bi-temporal images, which is similar to the Fisher criterion function. Big intra-region distance and small inter-region distance is corresponding to the significant change region. The above equations are defined in feature space. A key point of kernel method is that DS(p,q) must be computed in the input space.
Because the radius of the hyper sphere in feature space is 1(implemented by kernel function), the arc distance is
)
The intra-region distance of bi- temporal images is
)
area can be detected by threshold.In the least probable cases: if darc(cp,cq) tends to be zero, Find improper regions in accordance with PD, for example, the smooth region, where all the vectors are almost the same, so it is impossible to get the support vector and accurate PD estimation. This can be accomplished by introducing an absolute term behind or .
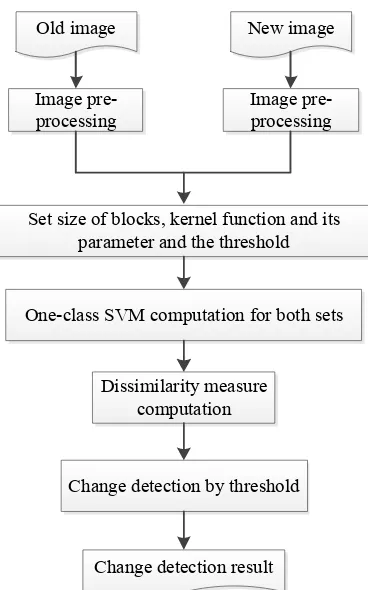
An overall functional diagram of the proposed system is as Figure 3. The steps of change detection method of kernel-based similarity measure are as follows:
1) Image pre-processing: such as radiometric corrections and image registration are important and indispensable steps; 2) Initialization: select size of the training sets, namely size of blocks, kernel function and its parameter and the
vectors of the bi-temporal images;
6) Compute the similarity measureDS(p,q)defined by kernel
function;
7) Detect change based on the similarity measureDS(p,q)and
threshold K;
8) Repeat step3)-7) until all regions are detected.
Old image New image
Image pre-processing
Image pre-processing
Set size of blocks, kernel function and its parameter and the threshold
One-class SVM computation for both sets
Dissimilarity measure computation
Change detection by threshold
Change detection result
Figure 3 Overall functional diagram of the proposed system
Change is complex and universal, no existing approach is optimal and applicable to all cases. The conventional method of simple difference and threshold is linear method, our method is free of model and no-linear method, which can deal with more complex situation. Conventional class method depends on the samples and the samples selection is very difficult in multispectral image, the change detection method proposed by this paper is a unsupervised method, the samples in our method are not needed, which is similar to the Fisher Analysis. Both methods make use of the intra-region ratio and inter-region ration of bi-temporal images based on the Rayleigh Principle, which is similar to the Fisher criterion. However, the classification is different from Fisher Analysis. The direction of classification plane in this paper is defined by commutating two independent one-class support vectors, while kernel Fisher obtains the biggest variance of the projection vector by optimizing the algorithm. Kernel Fisher is fit for two-type classification. While in practice change conditions is much more complex. They may have different types, more training samples, high dimension and unknown PD and complex shape etc. Kernel Fisher is not applicable, and the method proposed in this paper is more feasible.
4 ALGORITHM FLOW AND EXPERIMENTS
The 2.83 version of LibSvm, developed by Professor Lin Zhiren, has been used in the training of two one-class support vectors. The kernel functions are normalized. Overall accuracy is adopted as evaluation criterion for the performance comparison, which is the ratio of the number of correct samples and all the testing samples. In addition, the accuracy is comprehensively evaluated by integrating Kappa coefficient.
4.1 A Survey on the Research Area and Basic Processing
Two bi-temporal TM images of 1998 and 2000 are adopted. They are constituted by the other six bands except for the sixth infrared band. The bi-temporal images are pre-processed, i.e., precise geometrical correction (precise small-bin differential rectification, rectification accuracy is within 0.2 pixels), normalized radiometric correction and image segment. The images are 496×496 pixels and image resolution is 30 meter/pixel. The colorized images of 432 bands are as shown in Figure 3. Typical objects such as water bodies, buildings, roads, mountains and vegetation and so on are included in the testing images. Accuracy test is conducted by selecting 1334 change pixels on the bi-temporal images by hand as positive samples and selecting 1826 no-change pixels as negative samples.
(a)Image in 1998
(b)Image in 2000 Figure 4 bi- temporal images
The experiment presents the change detection results from change vector analysis and post-classification comparison respectively first and evaluates the accuracy. Then select RBF kernel functions, and select different kernel parameters and different block sizes respectively to test the performance of the algorithm in this paper. The results of change vector analysis and classification comparison are compared to each other to check the performance of this algorithm. Some of the results given by the experiment are difference images of change, and separation threshold needs to be selected in accordance with experience.
shown in Figure 5 (a). Take the intensity value of the change vector as a standard to detect change; and the change detection result acquired after bi-value processing is as shown in Figure 5 (b).
(a)Pseudo-color image of change vector
(b)Detection result of change vector Figure 5 The result of CVA
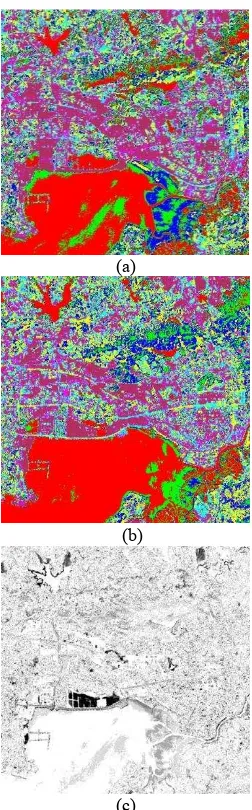
(2) Classification comparison: least-distance classification and non-supervised classification are applied to the bi-temporal images respectively (IsoData in Envi4.8), and the results are as shown in Figure 6(a) and (b). Compare the bi-temporal images after classification, and the difference is as shown in Figure 6(c).
(a)
(b)
(c)
Figure 6 Results of classification and change detection
Table 1 Change detection results Change Vector
Analysis
Classification Comparison Our method Accuracy(%)
Kappa Coefficient
96.7 0.945
95.9 0.911
98.9 0.97
From Figure 5 and Figure 6, it is obvious that both change vector analysis and classification comparison have detected change of the buildings and lake surface, but they got a little difference in such trivial changes as change of residential area and so on. The overall accuracy and Kappa Coefficient of the two methods are as shown in Table 1. Change vector analysis has better performance than non-supervised classification comparison. The reason is that it is difficult to define number of classification in classification comparison and classification and comparison are separate, which results in error accumulation; while change vector analysis has made full use of data of all bands equally well, and no other procedure produces error, so it has high accuracy.
4.2 Change Detection Results with Different Parameters
3*3 window size is processed every time. Namely, 9 samples are selected for one-class support vector training every time. With typical kernel parameters, the results of change difference are as shown in Figure 7. Overall accuracy and Kappa
coefficient of the change detections with different kernel parameters are as shown in Table 2.
Figure 7 some results with different parameters
Table 2 Change detection results with different parameters Overall
Accuracy:
%(kappa)
J= 1 J= 0.1 J= 0.01 J= 0.001 J= 0.0001
v
= 0.1 0.2 0.3 0.4 0.5 0.6 0.7 0.8 0.977.3(0.543) 79.3(0.579) 84.2(0.678) 81.9(0.638) 83.3(0.664) 87.9(0.752) 91.5(0.823) 94.3(0.879) 96.9(0.931)
91.5(0.822) 95.8(0.907) 97.2(0.936) 97.8(0.949) 98.5(0.962) 98.4(0.962) 98.8(0.969) 98.9(0.97) 98.9(0.97)
97.0(0.932) 97.8(0.949) 98.1(0.955) 98.1(0.955) 98.5(0.963) 98.8(0.969) 98.8(0.97) 98.9(0.972) 98.9(0.971)
96.8(0.929) 97.9(0.951) 98.5(0.964) 98.9(0.972) 98.9(0.971) 98.6(0.965) 98.4(0.96) 98.7(0.967) 98.7(0.967)
96.7(0.927) 95.5(0.902) 98.5(0.962) 97.6(0.945) 98.8(0.969) 97.6(0.946) 98.8(0.97) 98.7(0.967) 98.6(0.965)
It can be seen from the results of quantitative analysis (Table 2) and qualitative analysis (Figure 7) that this algorithm is not sensitive tov, because different values of it all can lead to good change detection results. In general, when J keeps the same value, the larger v is, a better result it is, because larger
vcan result in more support vectors, so the defined hyper plane is more accurate. However, larger vcan also result in longer operation time, because more SVs are taking part in operation. Taking both detection time and effect into account, v from 0.3 to 0.7 is comparatively better. The table also has shown thatJ also has wide numeric area. In experiments, J has little influence on the number of the SV, so the corresponding operation times are almost the same. However, large J mainly reflects the overall and typical changes, while small J can detect more trivial changes, because J is the width
of the basis function of radial direction, and the smaller it is, more precise PD estimation can be got and more detailed detection results can be achieved. Taking noises into consideration, detection accuracy falls slightly. In accordance with results of quantitative analysis, the best results can be achieved, when Jis between 0.01 and 0.1
4.3 Change Detection Results with Blocks of Different Sizes
Figure 8 results with some blocks of different sizes
Table 3 Change detection results with blocks of different sizes Overall Accuracy
(Kappa Coefficient)
3*3 5*5 7*7
v
= 0.2,J
= 0.1v
= 0.4,J
= 0.01v
= 0.6,J
= 0.001v
= 0.8,J
= 0.000195.8(0.907) 98.1(0.955) 98.6(0.965) 98.7(0.967)
95.4(0.9) 98(0.952) 98.4(0.96) 98.7(0.967)
91.1(0.809) 93.8(0.867) 93.9(0.867) 94.3(0.879
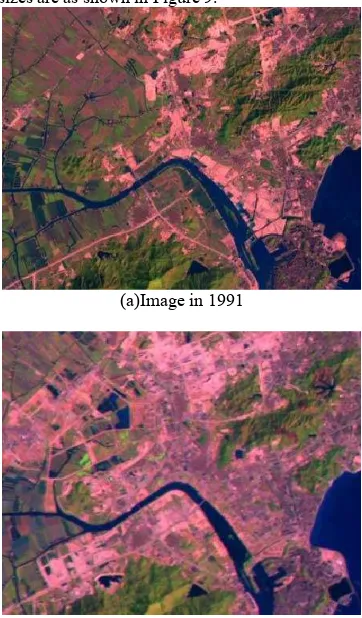
overall accuracy and Kappa coefficient under different parameters and different block sizes are as shown in Table 3. Another two bi-temporal TM images of 1991 and 1996 in Shenzhen are adopted. precise geometrical correction and normalized radiometric correction are needed. Compare the change detection results, using RBF kernel function, and selecting blocks with the size of 3*3,5*5 respectively. When v = 0.2 and J= 0.1. Change difference results of different block sizes are as shown in Figure 9.
(a)Image in 1991
(b)Image in 1996
(c) results with blocks of 3*3
which will increase operation time obviously, and is not good for change detection. Overall small blocks such as 3*3or 5*5 are better.
5 CONCLUSION
This paper proposes an algorithm that detects change by comparing the PD of the feature vector of bi-temporal images. The PD comparison is expressed as kernel functions, and change is detected using similarity measuring with kernel functions. PD is compared by defined kernel functions without immediate PD estimation. The results of experiments and theoretical analysis show that this algorithm is free of model; it can deal with any complex situation; it has no real PD estimation and PD comparison is achieved indirectly; it can process multidimensional data and multi-scale data; and is fit for the images with rich texture, the detection results have good visual effects.
ACKNOWLEDGEMENTS
The research is supported by National Key Basic Research and Development Program of China (2012CB719900), Supported by National Natural Science Foundation of China (61001187).
REFERENCES
WOODCOCK, C.E., MACOMBER, S.A., PAX-LENNEY, M. and COHEN, W.B., 2001, Monitoring large areas for forest change using Landsat: generalization across space-time and Landsat sensors, Remote sensing of Environment, 78: 194-203.
COPPIN, P. and BAUER, M., 1994, Processing of multitemporal Landsat TM imagery to optimize extraction of forest cover change features. IEEE Transactions on Geoscience and Remote Sensing, 32: 918-927.
MUCHONEY, D.M. and HAACK, B.N., 1994, Change detection for monitoring forest defoliation, Photogrammetric Engineering and Remote Sensing, 60(10): 1243– 1251.
PILON, P.G., HOWARTH, P.J. and BULLOCK, R.A., 1988, An enhanced classification approach to change detection in semi-arid environments. Photogrammetric Engineering and Remote Sensing, 54(12): 1709–1716. RIDD, M.K. and LIU J.J, 1998, A comparison of four
algorithms for change detection in an urban environment, Remote Sensing of Environment, 65(2): 95-100.
ROY, P.S., RANGANATH, B.K., DIWAKAR, P.G., VOHRA, T.P.S., BHAN, S.K., SINGH, I.J. and PANDIAN, V.C., 1991, Tropical forest mapping and monitoring using remote sensing, International Journal of Remote Sensing, 12(11): 2205– 2225.
SADER, S.A., POWELL, G.V.N., and RAPPOLE, J.H., 1991, Migratory bird habitat monitoring through remote sensing, International Journal of Remote Sensing, 12(3): 363–372.
VOGELMANN, J.E., 1988, Detection of forest change in the green mountains of Vermont using multispectral scanner data, International Journal of Remote Sensing, 9(7): 1187- 1200.
DU P.J., LIU S., LIU P., TAN K. & CHENG L., 2014, Sub-pixel change detection for urban land-cover analysis via multi-temporal remote sensing images, Geo-spatial Information Science, 17(1):26-38.
BOVLO, F. and BRUZZONE, L., 2007, A theoretical framework for unsupervised change detection based on change vector analysis in the polar domain, IEEE Transactions on Geoscience and Remote Sensing, 45(1): 218-235.
NEMMOUR, H., CHIBANI Y., 2006, Multiple support vector machines for land cover change detection: An application for mapping urban extensions. International Society for Photogrammetry and Remote Sensing , 61(2): 125-133.
LU, D., MAUSEL, P., BRONDIZIO, E., MORAN, E., 2004, Change detection techniques. International Journal of Remote Sensing, 25(12): 2365-2407.
RICHARD, J.R., ANDRA, S., Al-KOFAHI, O., ROYSAM, B., 2005, Image Change Detection Algorithms:A systematic Survey, IEEE TRANSACTIONS ON IMAGE PROCESSING, 14(3): 294-307.
SCHOLKOPF, B., PLATT J.C., SHAWE-TAYLOR, J., SMOLA, A.J., 2001, Estimating the Support of a High-dimensional Distribution. Neural Computation, 13(7): 1443-1471.
SUI, H.G., ZHOU, Q.M., GONG, J.Y, MA, G.R., 2008, Processing of multi-temporal data and change detection, Advances in Photogrammetry, Remote Sensing and Spatial Information Sciences: 2008 International Society for Photogrammetry and Remote Sensing Congress Book, Edited by Zhilin Li, Jun Chen and Emmanuel Baltsavias, 227-247.
SCHOLKOPF, B., MIKA, S., BURGES, C.J.C., KNIRSCH, P., MULLER, K.R., RATSCH, G., SMOLA, A.J., 1999, Input Space versus Feature Space in Kernel-Based Methods. IEEE TRANSACTIONS ON NEURAL NETWORKS, 10(5): 1000-1017.
POTIN, D . VANHEEGHE, P. DUFLOS, E. DAVY, M., 2006, An Abrupt Change Detection Algorithm for Buried Landmines Localization, IEEE TRANSACTIONS ON GEOSCIENCE AND REMOTE SENSING, 44(2): 260-272.
DESOBRY, F. DAVY, M. DONCARLI, C., 2005, An Online Kernel Change Detction Algorithm. IEEE TRANSACTIONS ON SIGNAL PROCESSING.53(8): 2961-2974.