EVALUATION OF RELATIVE GEOMETRIC ACCURACY OF TERRASAR-X BY PIXEL
MATCHING METHODOLOGY
T. Nonaka a, T. Asaka b, K. Iwashita a
a
Dept. of Sustainable Engineering, College of Industrial Technology, Nihon University, 1-2-1, Izumi-cho, Narashino, Chiba, Japan – (nonaka.takashi, iwashita.keishi)@nihon-u.ac.jp
b
Dept. of Civil Engineering, College of Industrial Technology, Nihon University, 1-2-1, Izumi-cho, Narashino, Chiba, Japan – (asaka.tomohito)@nihon-u.ac.jp
VII/ThS 7
KEY WORDS: Remote sensing, SAR, Geo-location accuracy, Pixel matching
ABSTRACT:
Recently, high-resolution commercial SAR satellites with several meters of resolutions are widely utilized for various applications and disaster monitoring is one of the commonly applied areas. The information about the flooding situation and ground displacement was rapidly announced to the public after the Great East Japan Earthquake 2011. One of the studies reported the displacement in Tohoku region by the pixel matching methodology using both pre- and post- event TerraSAR-X data, and the validated accuracy was about 30 cm at the GEONET reference points. In order to discuss the spatial distribution of the displacement, we need to evaluate the relative accuracy of the displacement in addition to the absolute accuracy. In the previous studies, our study team evaluated the absolute 2D geo-location accuracy of the TerraSAR-X ortho-rectified EEC product for both flat and mountain areas. Therefore, the purpose of the current study was to evaluate the spatial and temporal relative geo-location accuracies of the product by considering the displacement of the fixed point as the relative geo-location accuracy. Firstly, by utilizing TerraSAR-X StripMap dataset, the pixel matching method for estimating the displacement with sub-pixel level was developed. Secondly, the validity of the method was confirmed by comparing with GEONET data. We confirmed that the accuracy of the displacement for X and Y direction was in agreement with the previous studies. Subsequently, the methodology was applied to 20 pairs of data set for areas of Tokyo Ota-ku and Kawasaki-shi, and the displacement of each pair was evaluated. It was revealed that the time series displacement rate had the seasonal trend and seemed to be related to atmospheric delay.
1. INTRODUCTION
The high-resolution Synthetic Aperture Radar (SAR) satellites with several meters resolution for the commercial usages are in operation for the past several years, and the information that we obtain from the images are different due to the specification of the sensors. Focusing on the wavelength, for example, we can select various wavelength sensors, such as TerraSAR-X (X-band SAR with 3.1 cm wavelength), Radarsat-2 (C-(X-band SAR with 5.6 cm wavelength), and ALOS PALSAR-2 (L-band SAR with 23.6 cm wavelength). Some studies combined those different types of sensors to obtain more variable information (Baghdadi et al., 2009; Dong et al., 2011). The application areas of SAR are also widespread, including stability analysis of individual structure (Tapete et al., 2012), mining applications (Colesanti et al., 2005), subsidence monitoring (Amelung et al., 1999), forest mapping (Shimada et al., 2014), etc.
One of the most expected application areas is disaster monitoring. For instance, many researchers used SAR data for their studies for the Great East Japan Earthquake 2011, which occurred on March 11, 2011, and estimated the flooded area (Park et al., 2013), damaged buildings (Gokon and Koshimura, 2012), and ground displacement (Yague-Martinez et al., 2012). Interferometric synthetic-aperture radar (InSAR) is a well-established technique to estimate the centimetre order displacement using phase information (Gabriel et al., 1989), though the displacement is saturated when the gradient of the displacement exceeds half a fringe per pixel. InSAR may not always be able to observe deformation depending on vegetation
and temporal decorrelation. Moreover, the displacement provides only one component of the vector (slant range direction). The pixel matching, on the contrary, models the displacement field by translation derived from the local cross-correlation peaks, and it is an alternative for estimating displacement with sub-pixel to pixel orders using the intensity information. The disadvantage of the methodology with respect to DInSAR is about the lower accuracy, however the accuracy is sufficient for a wide range of applications. The method is well known for flow of ice within ice sheet (Giles et al., 2009). Authors evaluated displacements from the pair of pre- and post- event SAR images in the Great East Japan Earthquake (Liu et al., 2013). Furthermore, we proposed a methodology for detecting the three-dimensional (3-D) displacements from several pairs of TerraSAR-X intensity images acquired from the different orbits (Liu et al., 2015). The methodology focused on the displacement of non-damaged buildings with strong radar backscatter, and several meters displacement was obtained from the images with about 30 cm accuracy.
However, it is also necessary to evaluate the relative geo-location accuracy to discuss the spatial variation of the displacement from the output. Many studies evaluated the absolute geometric accuracy of TerraSAR-X, and it is less than 10 cm in the latest ones (Eineder et al., 2011). Authors also have studied these subjects, and revealed about the absolute geo-location accuracy of the ortho-rectified EEC product of TerraSAR-X in the both flat and mountain area by the difference method (Nonaka and Okajima, 2013, Nonaka and Tsukahara, 2015). The purpose of this study was to evaluate the relative 2D geo-location pointing accuracy of TerraSAR-X from * Corresponding author
21 images acquired from same acquisition conditions, and the geo-location feature of both spatial and temporal variations were revealed.
2. STUDY SITE AND UTILIZED DATA 2.1 Study site
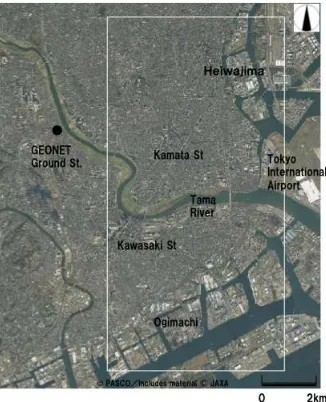
The study site was located around Tokyo Ota-ku and Kawasaki-shi region with 6 km for west-east, and 12 km for south-north Heiwajima and Ogimachi. The International Airport in the east edge is one of the two primary airports that serve the metropolitan Tokyo area in Japan. It is located in Ota-ku, Tokyo, and 14 km south of Tokyo station. Tama-river flows from west to east around the central of the study site, and north side of river is Tokyo-to, though the other side is Kanagawa Prefecture. Many buildings both residential and commercial factories are so crowded in the city, and include Kamata and Kawasaki railway stations.
Figure 1. Study area in Tokyo Ota-ku and Kawasaki-shi. White frame shows the analysed area. GEONET ground station is
about several kilometers west of study area
2.2 Utilized data
2.2.1 TerraSAR-X: TerraSAR-X series, TerraSAR-X and TanDEM-X, are the German radar satellites launched in June 2007, and June 2010, respectively. Both satellites carry X-band (9.65 GHz) SAR sensors, and operate in several different imaging modes (Fritz and Eineder, 2013). In SpotLight mode, a spatial resolution of up to 1 m can be achieved. StripMap mode allows acquisition with 3 m resolution, though ScanSAR with 18 m. Furthermore, the current extension of the capabilities being implemented as a Staring SpotLight mode with improved azimuth resolution. The released Wide ScanSAR mode has the swath width of 200 to 270 km, depending on the varying incidence angles. The polarization is also selected from single or dual (HH, VV, HH/VV, HH/HV, VV/VH). One of the missions of TerraSAR-X series is accomplishing a global digital elevation model (DEM) with absolute height error of 10 m, and a relative height error of 2 m, respectively (Krieger et al., 2007).
The acquisition condition is shown in Table 1; we utilized 21 TerraSAR-X images, chosen for approximately 15 months, from June 22, 2010 to September 5, 2011. Standard StripMap mode of 3 m spatial resolution and the right looking descending orbit of 42.8 degree of incidence angle was utilized. This allows measurements of the local shifts between master and slave with an accuracy of several centimetres (Eineder et al., 2011). This article defines coordinate X as west-east (and Y as south-north) direction and negative displacement for X means the transmission direction, from east to west. The product type was Enhanced Ellipsoid Corrected (EEC) at the Processing Level 1B, and the image distortion was compensated by high-resolution 10 m mesh DEM generated by Geospatial Information Authority (GSI) of Japan (GSI, 2014), instead of standard SRTM DEM to correct the distortion accurately in this study. The product was projected to a WGS 84 reference ellipsoid with a resampled square pixel size of 1.25 m. Although the previous study showed that the absolute geo-location accuracy caused by DEM errors were not neglected (Nonaka et al., 2008), they were discarded in our time series analysis due to all images with the same incidence angle. acquisition dates year month date
2010
Table 1. Acquisition parameters of utilized 21 TerraSAR-X data
2.2.2 GEONET data: GSI has established approximately 1,200 GPS ground control stations, called GEONET (GNSS Earth Observation Network System) throughout Japan. Real-time observation of crustal displacement is possible by continuous observations at the stations, where radio waves from the GPS satellites are constantly received, and ground displacement has been monitored by GEONET since 1993 (Sagiya, 2004). The distance between two neighboring stations is greater than 20 km, although GEONET is one of the densest GPS networks in the world. Figure 2 shows the absolute displacement to a reference date (June 22, 2010) observed in Kawasaki GEONET ground station, about several kilometers west of study area (Figure 1). Each plot corresponds to the acquisition date of 20 TerraSAR-X data (except a reference date). It shows that the displacement was almost 0 cm before the end of 2010, however 1 cm for west direction was observed on January 6, 2011. And more than 20 cm for east direction and 5 cm for north direction were observed on March 13, 2011 just after the earthquake. Even after the earthquake, more than 10 cm continuous displacement was observed for east direction for half a year.
Figure 2. Absolute displacement from June 22, 2010 observed at GEONET Kawasaki ground station. The 20 plots from July 3, 2010 to September 5, 2011 correspond to the acquisition date of
TerraSAR-X data
3. METHODOLOGY
This study evaluated the relative geo-location accuracy by pixel matching methodology detecting sub-pixel level displacement. Firstly, the methodology of the general pixel matching method (Tobita et al., 1999) was customized to the analysis for TerraSAR-X (section 3.1). The accuracy of the displacement was evaluated referred as the GEONET data in Kawasaki for the preparation of the analysis (section 3.2), and the validity of the method was confirmed. Then the relative geo-location accuracy of TerraSAR-X data was evaluated by several approaches separately, spatial variation of the displacement and temporal variation. The first approach focused on the difference of the displacement between several points acquired from each sub-area in the same pair of images (section 4.1). The second approach was estimated the average displacement for each pair of images, and the temporal variation of the displacement was evaluated (section 4.2).
3.1 Displacement estimation methodology
Pixel matching (offset tracking) is an image processing technique that was applied to estimate displacement in both X and Y directions. Figure 3 shows the flow of the method used in this study (Hiramatsu and Nonaka, 2012). It works by cross-correlation of two images of square of radar backscatter intensity and 128 pixels in both the X and Y directions. Successful application of the method is highly dependent on accurate image coregistration to avoid systematic errors. Therefore, in order to minimize the mis-matching, optimized threshold of the average DN value, correlation coefficients, and displacement was set when we customized the method. We then defined the status of the matching for 4 classification categories of “Detect”, “Lost”, “Miss-detect”, and “Bad Template”. When the correlation coefficient was less than 0.7, it was regarded as “Lost”. In the next stage, “Detect” was defined as a representative of which shift was less than 2 pixels, otherwise “Miss-detect”. In case the average DN values inside a sub-area of TerraSAR-X 8 bit unsigned data was less than 100, we discarded it as “Bad Template”.
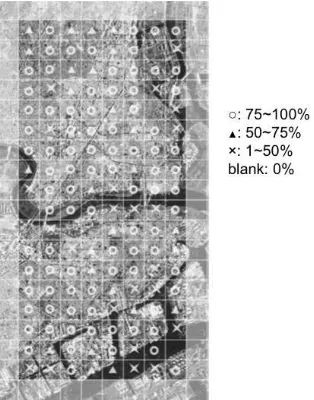
We used pairs of images, master and slave. The master was fixed to the data acquired on June 22, 2010, and slave were the others. Firstly cross correlation was applied on 200 sub-areas distributed over the images (Figure 4, 10 cells for X direction
and 20 cells for Y), and the pixel with maximum intensity was automatically selected for each sub-area from master image. Then, we clipped a certain window size (with a maximum intensity pixel at a center), and found that the matching point of corresponding slave images had maximum correlation coefficient. The method adopting large window size (128 x 128 pixel) of correlation windows to decreases the number of bad offset data (Figure 5). Secondly, the offset was estimated as sub-pixel level. Square of DN values for 8 x 8-pixels clipped with the representative pixel of each sub-area, located at a center of each correlation window, was calculated for both master and slave images. After that, 16 times Fast Fourier Transform (FFT) over-sampling was applied to estimate the displacement of sub-pixel resolution for each sub-area, and providing minimum detectable offset (MDO) with 0.0625 (1/16) pixels (corresponding to about 8 cm for the image of 1.25 m pixel spacing of TerraSAR-X). Finally, we produced maps of X and Y displacements for entire image combined with that of the each sub-area.
Figure 6 shows the composition of the 4 classification categories for each pair of images (Hiramatsu and Nonaka, 2012). The vertical axis means the acquisition date of the slave image. There were no sub-areas classified as “Miss Detect”. Several sub-areas including Tama river were classified as “Lost” for the most of pairs (see Figure 4 showing the ratio of “Detect” for each sub-area). The detection rate (defined as the ratio of “Detect”) for most of the pairs was more than 50 %, especially it was more than 80 % with the pair that had interval of less than 3 months. It clearly showed that the detection rate was less than 30 % for the pair of just after the earthquake (March 13, 2011), however it was recovered for the pair of next data acquisition. Also the value of November 23, 2010 was too small, less than 30%. Therefore, these two data were excluded from the analysis in chapter 4 due to the low detection rate.
Figure 3. Procedure of pixel matching methodology to estimate the displacement with sub-pixel unit from the pair of
TerraSAR-X images
Figure 4. 200 sub-areas divided in the study site. The mark shows the ratio of “Detect” for 20 pairs of data for each
sub-area
Figure 5. Example of the cross-correlation field and 16 times over-sampling
Figure 6. The composition of 4 classification categories; “Detect”, “Lost”, “Miss Detect” and “Bad Template”, for each pair of TerraSAR-X image. Vertical axis is the acquisition date
of the slave images
3.2 Displacement accuracy estimation
Before the evaluation of the geo-location accuracy, the validity of the methodology was examined. Table 2 shows the accuracy of the displacement for X and Y direction comparing between estimation and GEONET data in Kawasaki station (Nonaka and Hiramatsu, 2013). The estimation by cross-correlation was conducted at the GEONET station. The comparison was made for 20 pairs of data sets. This table shows that the root mean square errors (RMSE) were 21 cm for X direction and 9 cm for Y direction, respectively. These values of errors were almost agreed with the previous study (Liu and Yamazaki, 2013). RMSE was correspond to about 20 % of pixel spacing (=1.25 m) for X, and 10 % for Y. Considering the X direction is almost same as range direction, the fact that RMSE of range direction was 3 times MOD (=8 cm) agreed to the previous study (Yague-Martinez et al., 2012).
X Y
Average -14 cm 1.0 cm
Standard Deviation 15 cm 8.8 cm
RMSE 21 cm 8.8 cm
Table 2. Difference of the displacement around GEONET Kawasaki ground station between the estimation and
observation
4. RESULTS
4.1 Spatial characteristics of the relative geo-location accuracy
This section evaluated the relative geo-location accuracy of TerraSAR-X from the spatial distribution of the displacement of each pair of the image. The displacement value was derived from the cells classified as “Detect”. Table 3 shows the deviation of the displacement for both X and Y direction, respectively. The analysis was conducted all 18 pairs of the data when the slave (except November 23, 2010 and March 13, 2011) was shifted. The values of actual GEONET observed displacement (Figure 2) need not be considered because this section did not deal with the absolute value of the displacement, but the spatial distribution. The result shows that the average spatial deviation of the displacement was small both for X and Y, and less than 10 cm. The 1-2 cm of the standard deviation (variation of the deviation depending on the slave image) was quite small.
Figure 7 shows the relationships between the detection rate and the spatial deviation of the displacement. Each plot shows the deviation for each slave image. Though the analysis was conducted only for 18 points. As a result, the significant negative relation was found only for Y direction (r=0.43), and it means that the higher the detection rate is, the smaller the deviation of the displacement. The estimated displacement deviation was 2.9 cm in 100% of the detection rate, and the value was smaller than the minimum detectable offset of 8 cm. The threshold of the correlation coefficient (setting 0.70 in this study) determines the detection rate as well as the pixels of each sub-area whether the calculation of the displacement is made or not. Therefore the relative geo-location accuracy was possible to be controlled as we change the threshold.
On the contrary, the deviation was fluctuating, and the significant negative relation was not found for X direction. One of the causes is the difficulty of the accurate matching due to the abundant saturated intensity pixels in the crowded business 0.0 20.0 40.0 60.0 80.0 100.0
Jul. 3 Jul. 14 Aug. 16 Aug. 27 Sep. 7 Sep. 18 Nov. 1 Nov. 23 Dec. 15 Dec. 26 Jan. 6 Jan. 17 Mar. 2 Mar. 13 Mar. 24 Jul. 12 Jul. 23 Aug. 13 Aug. 25 Sep. 5
Detect Lost Miss Detect Bad Template
Ratio (%) 2010
2011
districts and residential quarters in studied Tokyo Ota-ku and Kawasaki-shi areas. It is necessary to conduct the pixel matching in other types of cities including less crowded areas. Further discussion of the characteristics of the relative accuracy for X direction is necessary after the detailed statistical analysis in future studies.
X Y
Average 10 cm 4.5 cm
Standard Deviation 1.8 cm 0.6 cm
Table 3. Statistics of the spatial deviation of the displacement calculated from the each sub-area of the all pair of images
Figure 7. Relationships between the detection rate and the deviation of the displacement. Each plot shows the spatial
deviation of the displacement for each slave image
4.2 Temporal characteristics of the relative geo-location accuracy
This section shows the relative geo-location accuracy of TerraSAR-X from the temporal distribution of the displacement from all pairs of images. It is noted that the evaluation is not strict because the selected matching points and detection rate are different by the pairs. The spatial average displacement value was utilized for the temporal analysis in this section because the spatial deviation of the displacement was fairly small (less than 10 cm) both for X and Y (Section 4.1).
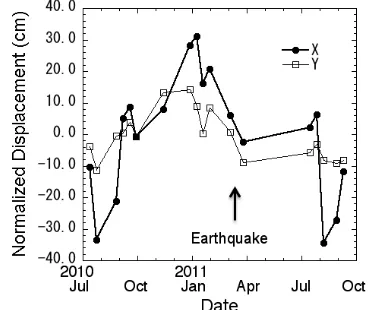
Figure 8 shows the normalized displacement of X and Y direction for each pair of image. The horizontal axis means the acquisition date of the slave image. The normalized displacement was calculated by removing the effects of the actual displacement observed at the GEONET Kawasaki station (estimation minus the GEONET value). According to the graph, the maximum value was 34 cm for X direction, and 19 cm for Y direction, and RMSE was 13 cm for X and 8 cm for Y, respectively. It was little better than the absolute geo-location accuracy (Table 3).
The result also shows that the sign of X displacement was changed from minus to plus around September 18, 2010, and plus to minus around July 12, 2011. This systematic trend was found when master image was fixed to June 22, however it was not seen in case that the master was changed in the nearest acquisition date. It means the acquisition date of the slave image seems to affect the sign when master was fixed, that is plus in the acquisition in winter and minus in summer. In the previous studies, atmospheric path delay (Cong et al., 2012) and solid
earth tide (Eineder et al., 2011) effects are taken into account to obtain the ground displacement. Considering the acquisition condition of descending orbit and right looking direction, the displacement direction corresponds to the longer distance of slant range in summer, and shorter in winter. Therefore the atmospheric path delay of microwave is one of the possible factors of the temporal variation of the relative geo-location errors. The previous study evaluated that the value was about several centimeters for slant range direction at the test site Venice (Cong et al., 2012), and our result in Tokyo was more than the previous study when we assume the atmospheric effects.
Figure 8. The temporal variation of the normalized average displacement of the study site when the slave image is changed
5. CONCLUSIONS
This study evaluated the relative geo-location accuracy of the TerraSAR-X ortho-rectified EEC product by the pixel matching methodology using the pairs of intensity images. Because the study sites of Tokyo and Kanagawa Prefecture had many residential and commercial factories, the scatterers with strong backscattering were easy to extract from the images. According to the analysis using 20 pairs of images, it was revealed that the spatial deviation of the displacement was less than 10 cm for both X and Y direction, and the temporal variation was larger than spatial one. In the previous study, the absolute geo-location accuracy of the TerraSAR-X was evaluated, and it was worse in the mountain area due to the accuracy of DEM. The relative accuracy estimated in this study indicates the geo-location accuracy quantitatively independent of the DEM error.
The results suggest that the spatial deviation of the displacement observed in the earthquake, for example, more than 10 cm (corresponds to minimum detectable offset), derived from the pixel matching methodology was significant. On the other hand, though the accuracy of the estimated displacement was about 20 cm, we noted that the seasonal trends in the analysis of the displacement derived from different pair of images. This paper highlighted the case study conducted in Tokyo metropolitan areas, and the intensities of some extracted pixels were saturated. We need to apply the adopted methodology to other cities also, and further quantitative analysis is necessary to discuss the deviation of the displacement.
ACKNOWLEDGEMENTS
The work was a part of joint research of TerraSAR-X application for disaster monitoring between PASCO CORPORATION, Chiba University, and Nihon University. The
Deviation of the displacement (cm)
D
e
te
ct
io
n
R
a
te
authors are greatly thankful to Prof. Fumio Yamazaki and Dr. Wen Liu of Chiba University and Dr. Krishna Kumar Mishra, and Mr. Toshifumi Hiramatsu of PASCO CORPORATION.
REFERENCES
Amelung, F., Galloway, D., Bell, J., Zebler, H., and Laczniak, J., 1999. Sensing the ups and downs of Las Vegas: InSAR reveals structural control of land subsidence and aquifer-system deformation, Geology, 27 (6), pp. 483-486.
Baghdadi, N., Boyer, N., Todoroff, P., Mahmond, E., Agnes, B., 2011. Potential of SAR sensors TerraSAR-X, ASAR/ENVISAT and PALSAR/ALOS for monitoring sugarcane on Reunion island, Remote Sensing of Environment, 113 (8), pp. 1724-1738.
Colesanti, C., Le Mouelic, S., Bennani, M., Raucoules, D., Carnec, C., and Ferretti A., 2005. Detection of mining related ground instabilities using the permanent scatterers technique – a case study in the east of France -, International Journal of Remote Sensing, 26 (1), pp. 201-207.
Cong, X., Balss, U., Eineder, M., and Fritz, T., 2012. Imaging geodesy –Centimeter-level ranging accuracy with TerraSAR-X: an update, IEEE Transactions on Geoscience and Remote Sensing, 9 (5), pp. 948-952.
Dong, Y., Li, Q., Dou, A., and Wang, X., 2011. Extracting damages caused by the 2008 Ms 8.0 Wenchen earthquake from SAR remote sensing data, Journal of Asian Earth Science, 40, pp. 907-914.
Eineder, M., Minet, C., Steigenberger, P., Cong, X., and Fritz, T., 2011. Imaging geodesy- toward centimeter-level ranging accuracy with TerraSAR-X. IEEE Transactions on Geoscience and Remote Sensing, 49 (2), pp. 661-671.
Fritz, T., and Eineder, M., 2013. TerraSAR-X Ground Segment, Basic Product Specification Document (TX-GS-DD-3302), Issue 1.9, pp. 126.
Gabriel, A., Goldstein, R., and Zebker, H., 1989. Mapping small elevation changes over large areas: Differential radar interfereometry, Journal of Geophysical Research, 94 Part B7, pp. 9183-9191.
Giles, A., Massom, R., and Warner R., 2009. A method for sub-pixel scale feature-tracking using Radarsat images applied to the Martz Glacier Tongue, East Antarctica, Remote Sensing of Environment, 113, 1691-1699.
Gokon, H., and Koshimura, S., 2012. Mapping of building damage of the 2011 Tohoku earthquake tsunami in Miyagi prefecture, Coastal Engineering Journal, 54 (1), 1250006 (12pages).
GSI, 2014. Fundamental Geospatial Data (Digital elevation model), http://fgd.gsi.go.jp/download (10 Dec. 2015)
Hiramatsu, T,. and Nonaka, T., 2012. Evaluation of the geometric characteristics for TerraSAR-X multi-temporal images, Proceedings 53rd Autumn Conference of the Remote Sensing Society of Japan, pp. 125-126.
Krieger, G., Moreira, A., Fiedler, H., Hajnsek, I., Werner, M., Younis, M., and Zink, M., “TanDEM-X”: A satellite formation
for high resolution SAR interfereometry, IEEE Transactions on Geoscience and Remote Sensing, 45 (11), pp. 3317-3341.
Liu, W., Yamazaki, F., Matsuoka, M., Nonaka, T., and Sasagawa, T., 2015. Estimation of Three-dimensional Crustal Movements in the 2011 Tohoku-Oki, Japan Earthquake from TerraSAR-X Intensity Images, Natural Hazards and Earth System Sciences, 15, pp. 637-645.
Liu, W., and Yamazaki, F., 2013. Detection of crustal movement from TerraSAR-X intensity images for the 2011 Tohoku, Japan earthquake, IEEE Transactions on Geoscience and Remote SensingLetters, 10 (1), pp. 199-203.
Nonaka, T., Ishizuka, Y., Yamane, N., Shibayama, T., Takagishi, S., and Sasagawa, T., 2008. Evaluation of the geometric accuracy of TerraSAR-X, Proceedings of The International Archives of The Photogrammetry, Remote Sensing and Spatial Information Sciences, Beijing China, Vol. XXXVII, Part B7, pp. 135-140.
Nonaka, T., and Hiramatsu, T., 2013. Mapping displacement around Tokyo International Airport after the Great East Japan Earthquake 2011 derived from TerraSAR-X imageries,
Proceedings of The 4th Asia-Pacific Conference on Synthetic Aperture Radar, Tsukuba Japan, pp. 442-445.
Nonaka, T., and Okajima, Y., 2013. Geometric feature evaluation of the high-resolution data of TerraSAR-X series,
Journal of Applied Survey Technology, 24, pp.17-27.
Nonaka, T., and Tsukahara, K., 2015. Application of the geometric accuracy estimation model of the terrain corrected data to TerraSAR-X data, Journal of the Japan Society of Photogrammetry and Remote Sensing, 53 (6), pp. 242-249.
Park, S-E., Yamaguchi, Y., and Kim, D., 2013. Polarimetric SAR remote sensing of the 2011 Tohoku earthquake using ALOS/PALSAR, Remote Sensing of Environment, 132 (15), pp. 212-220.
Sagiya, T., 2004. A decade of GEONET: 1994-2003- The continuous GPS observation in Japan and its impact on earthquake studies-, Earth, Planets and Space, 56 (8), pp. xxix-xli.
Shimada, M., Itoh, T., Motooka, T., Watanabe, M., Shiraishi, T., Thapa, R., and Lucas, R., 2014. New global forest/non-forest maps from ALOS PALSAR data (2007-2010), Remote Sensing of Environment, 155, pp. 13-31.
Tapete, D., Fanti, R., Cecchi, R., Petrangeli, P., and Casagli, N., 2012. Satellite radar interfereometry for monitoring and early-stage warning of structural instability in archaeology sites,
Journal of Geophysics and Engineering, 9 (4), pp. S10-S25.
Tobita, M., Fujiwara. S., Murakami, M., Nakagawa, H., and Rosen, P. A., 1999. Accurate offset estimation between two SLC images for SAR interferometry,Journal of the Geodetic
Society of Japan, 45 (4), pp.297-314.
Yague-Martinez, N., Eineder, M., Cong, X. Y., and Minet, C., 2012. Ground displacement measurement by TerraSAR-X image correlation: The 2011 Tohoku-Oki Earthquake, IEEE Transactions on Geoscience and Remote SensingLetters, 9 (4), pp. 539-543.