M – 16 SIMULTANEOUS EQUATIONS MODELLING USING 2SLS AND 3SLS METHODS
FOR FISHERMEN TERM OF TRADE OF INDONESIA
Widyawan Candra Yunianto1, I Made Sumertajaya2 Department of Statistics of Bogor Agricultural University (IPB)
Email: [email protected]
Abstract
After being set as one of national target, Fishermen Term of Trade (NTN) has become a vital indicator for fisherman's welfare. For years, NTN is calculated based on the price of goods and services both in terms of production, costs and household consumption. While cost of consumption is based on actual data which was collected every month, the production refers to the volume of the base year, so it is less accurate in describing the actual condition. At the other side, dealing with State Budget planning, government needs to know how macroeconomic assumptions affect fisherman welfare. Therefore, the purpose of this study is to find a comprehensive model that simultaneously links the production side and economic indicator to predict NTN. Another focus is to investigate which estimation method is better, between Two Stage Least Squares (2SLS), as a single equation approach, and Three Stage Least Squares (3SLS), as a system approach. The study of Indonesian data from January 2008 – December 2012 shows that there are significant simultaneous relationships among production, macro assumption and NTN. The 3SLS gives better parameter estimates since it has less Mean Square Error (MSE) with R-sq=62.75%. But, in order to fit the NTN, the 2SLS gives a better prediction.
Keywords: fishermen terms of trade, simultaneous model, 2SLS, 3SLS
Introduction
Recently, the government focuses more on the welfare of fisherman. The improvement of NTN, which is one of the proxy indicators to see the level of welfare of fishermen, started in 2014, in Article 38 of Law No. 23 Year 2013 on the State Budget for Fiscal Year 2014 and Article 32 of Law No. 27 Year 2014 on State Budget for Fiscal Year 2015, is explicitly mentioned as one of the goals of national development and economic growth. This means that an improvement NTN determines the values of macroeconomic assumptions, which in turn affects the posture of the the government budget.
NTN, which is a component of Farmers Terms of Trade (NTP), is obtained from the comparison of the prices index received by fishermen (It) and the prices index paid by fishermen (Ib). If NTN in an area is above a hundred, it means that fishermen have a surplus. Production prices increased faster than the increase in the price of consumption. Fishing income increased faster than expenses. Or it could be said that the higher NTN achieved by a region, the prosperity of the fisherman is increasing and vice versa. NTN is calculated based on the price of goods and services both in terms of production, costs and household consumption that are collected every month, while the volume of production refers to the volume of the base year, so it is less appropriate to describe the actual condition. Therefore it is necessary to involve the production volume periodically (monthly) to see the actual welfare.
NTN new indexing method by incorporating elements of quantity indices in the form of production index and the index of monthly consumption, so that NTN is defined as the index of revenue of the index of expense value, is still constrained with a problem of a collective
1
Post Graduate student of Bogor Agricultural University 2
agreement on spending, the availability of data and analysis (Bappenas, 2013). This prompted researchers to link NTN with various factors, especially in terms of production, and relate it to the indicators of macroeconomic assumptions that lead to make policy simulations for development planning.
The availability of NTN monthly data series that had been compiled since 2008 is still not long enough to be assessed using time series analysis. Thus, setting a simultaneous NTN models based on natural factors that influence production that utilizes several economic indicators can be an appropriate alternative. In the case of simultaneous equations model, there is two-way relationship between the dependent and the independent variables. Besides. the dependent variable in an equation can also act as an independent variable in the other equation. So there is a doubt which one really is the dependent variables or independent variables. The use of Ordinary Least Square (OLS) in the estimation of the parameters in the context of simultaneous equations is not appropriate, because there is an assumption that is violated: no correlation between the explanatory variables with the stochastic error. If it is forced to continue using the OLS method, the results will provide biased and inconsistent estimators.
Several estimation methods can be used to overcome this problem. Estimation can use a single equation method and system approaches. In the system of simultaneous equations model, each individual equation may be statistically very good but the whole model fail to explain the historical data. Instead, it is possible that an individual equations of the model are statistically very bad, but when the model is tested against historical data, it reflects the time series data accurately. As emphasized by Pindyck and Rubinfeld (as cited in Nadapdap, 1990, p.9), even if all the individual equations fit the data statistically good, there is no guarantee that the model will be able to imitate real data sets well . To that end, in order to obtain the best simultaneous model, it need to compare different methods of estimation. In this study is the models being compared are the Two Stage Least Square (2SLS) for a single equation method and Three Stage Least Square (3SLS) for the system methods.
Then the concern of this study is to answer questions about (1) what is the economic model to explain the relations of production and macroeconomic assumptions to fishermen terms of trade, (2) how to estimate parameters of the model with a single equation approach (2SLS) and the systems approach (3SLS), and (3) which method produces better forecasts?
NTN best models involving simultaneous production of fish from time to time and various macro assumptions could be an alternative approach to predict the value of the NTN that is more representative of the actual welfare of fishermen, which is certainly beneficial for the stakeholders in the planning and preparation of the Budget.
Research Method
Fishermen Terms of Trade (NTN)
NTN is a component of Farmers Terms of Trade (NTP), so the formula and the interpretation are the same. NTN measurement is expressed in the form of an index as follows:
= × 100 (1)
IT and IB respectively is the index of prices received by fishermen and index of prices paid by fishermen. IT and IB are measured by BPS-Statistics Indonesia by modifying the Laspeyres index as follows:
=
∑
( ) ( )
∑ × 100 (2)
where: = Price in the n-th month of the i-th commodity, ( ) = Price in the (n-1)th month
of the i-th commodity,
( ) = Relative Price of the i-th commodity, =Price in base year of the i-th commodity, = quantity in base year of the i-th commodity, and m=number of commodity included
indicators. Sofia (2010) mentions in her study that the production of fishing is affected by the fuel price, the sale price of fish, the season shifting, and weather conditions. Dwi (2012) emphasizes the external factors that affect the catches of fishermen are wind speed, wave, sunshine, and temperature. Bappenas (2013, p.17) in the scheme mentions many factors that affect household income and consumption patterns of farmers / fishermen. Selling price and wage rates affect revenue and price movement of goods affect consumption patterns. Generally, price movements are indicated by the inflation rate. Simulation by OECD-FAO in 2008 also shows how significant the effect of fuel prices on the price of agricultural products (Colman, 2009, p.13).
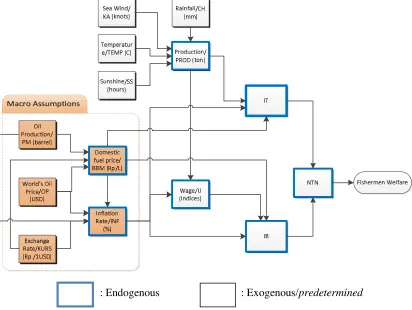
According to those matters, simultaneous model structure that is built is as follows:
[image:3.595.96.508.214.524.2]: Endogenous : Exogenous/predetermined
Figure 1. Simultaneous Model Structure
The data used in this research is secondary data from BPS, BMKG, Directorate General of Fisheries, Ministry of Energy, Bank Indonesia, and the US Energy Information Administration (USEIA). Due to data limitations of NTN, the data series was started from January 2008 to December 2012. The data on domestic fuel prices (represented by gasoline price) is the price as measured at the rural level. Meanwhile, inflation data used is the rate of inflation from month to month (mtm).
Based on the above scheme, formed six structural equation outside NTN, with six endogenous variables (G), and six exogenous variables / predetermined (K), namely:
1. Production of fishing: = ( , , , ) +
2. Domestic fuel prices (gasoline): = ( , , ) +
3. Inflation rate: = ( ) +
4. Wages of fishing (expressed by wage index) : = ( , , ) +
5. The exchange rate component of fishing revenue shown by the index of prices received by
fishermen: = ( , , ) +
6. The exchange rate component indicated by the fishermen payment paid index fishermen:
NTN in this case serves as an identity, but not linear. The equations are then identified based on the order conditions and rank conditions to determine whether the parameters can be estimated from their reduced form (Seddighi, 2000). Furthermore, the parameters of the model will be estimated by a single equation methods 2SLS and 3SLS system method. To get the best model, an analysis of the Mean Square Error (MSE) and R-sq is conducted to both models. The accuracy for predicting NTN is also used a consideration which method is better. Analysis are performed with SAS program assistance through SYSLIN procedure.
Result
The identification results show that the six structural equations are overidentified, because they have the number of predetermined variables excluded from the equation is more than the number of endogenous variables included in the equation minus one, and the rank of the matrix which is constructed from the coefficients of all the variables excluded from the equation, but included in the other equation in the model equals to the number of equations
[image:4.595.90.509.284.758.2]minus one (rank (Δ) = G-1). Therefore, estimation method that can be used is 2SLS and 3 SLS.
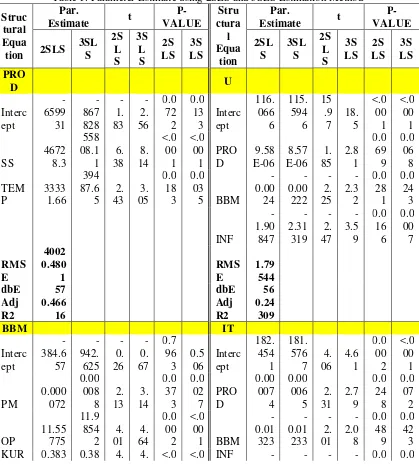
Table 1. Parameter Estimate using 2SLS and 3SLS Estimation Method
Struc tural Equa
tion
Par.
Estimate t
P-VALUE Stru ctura l Equa tion Par.
Estimate t
P-VALUE 2SLS 3SL
S 2S L S 3S L S 2S LS 3S LS 2SL S 3SL S 2S L S 3S LS 2S LS 3S LS PRO
D U
Interc ept -6599 31 -867 828 -1. 83 -2. 56 0.0 72 2 0.0 13 3 Interc ept 116. 066 6 115. 594 6 15 .9 7 18. 5 <.0 00 1 <.0 00 1 SS 4672 8.3 558 08.1 1 6. 38 8. 14 <.0 00 1 <.0 00 1 PRO D 9.58 E-06 8.57 E-06 1. 85 2.8 1 0.0 69 9 0.0 06 8 TEM P 3333 1.66 394 87.6 5 2. 43 3. 05 0.0 18 3 0.0 03
5 BBM -0.00 24 -0.00 222 -2. 25 -2.3 2 0.0 28 1 0.0 24 3 INF -1.90 847 -2.31 319 -2. 47 -3.5 9 0.0 16 6 0.0 00 7 RMS E 4002 0.480 1 RMS E 1.79 544
dbE 57 dbE 56
Adj R2 0.466 16 Adj R2 0.24 309
BBM IT
Interc ept -384.6 57 -942. 625 -0. 26 -0. 67 0.7 96 3 0.5 06 Interc ept 182. 454 1 181. 576 7 4. 06 4.6 1 0.0 00 2 <.0 00 1 PM 0.000 072 0.00 008 8 2. 13 3. 14 0.0 37 3 0.0 02 7 PRO D 0.00 007 4 0.00 006 5 2. 31 2.7 9 0.0 24 8 0.0 07 2 OP 11.55 775 11.9 854 2 4. 01 4. 64 0.0 00 2 <.0 00
1 BBM -0.01 323 -0.01 233 -2. 01 -2.0 8 0.0 48 9 0.0 42 3
S 182 853 4
69 86 00
1 00 1 10.3 075 12.3 189 2. 16 2.9 9 35 4 04 2 RMS E 353.9 3554 RMS E 11.1 009 2
dbE 56 dbE 56
Adj R2 0.269 25 Adj R2 0.22 981
INF IB
Interc ept -5.085 65 -5.07 32 -3. 75 -3. 96 0.0 00 4 0.0 00 2 Interc ept -388. 59 -389. 465 -7. 53 -31. 56 <.0 00 1 <.0 00 1 OP 0.009 192 0.00 888 6 3. 43 3. 56 0.0 01 1 0.0 00
8 INF
3.52 441 6 4.40 663 3 2. 27 4.2 1 0.0 26 8 <.0 00 1 PM 1.67E -07 1.68 E-07 3. 79 4. 05 0.0 00 4 0.0 00
2 BBM 0.00 470 4 0.00 442 1 2. 26 2.7
0.0 27 7 0.0 09 2 U 4.52 142 9 4.54 297 9 10 .9 1 79. 56 <.0 00 1 <.0 00 1 RMS E 0.467 44 RMS E 3.02 711
dbE 57 dbE 56
Adj R2 0.225 15 Adj R2 0.73 721 In general, Table 1 shows that the 2SLS and 3SLS methods produce the same estimations in terms of the significant variables. All the value of the F statistic in equation also shows significant value. The values of t-statistic generated by 3SLS are always higher than 2SLS. Due to its higher t-ratio, by assuming that the t-ratio is consistent statistics to be used to hypothesis testing, we believed, in this case, that the 3SLS estimates are preferable because it is more efficient.
SAS output shows that overall, the method 3SLS able to explain the system with R-sq = 62.75% and MSE of 31 256. Given 2SLS a single equation estimation, then to look at the overall MSE, it can be approximated by finding the sum of squared errors of the whole equation, and then dividing by the total degrees of freedom of error. With a total of 338 degrees of freedom of error and JKG = 91,300,435,911, resulting MSE = 270119632.9. From MSE and this t-ratio, we can easily say that 3SLS statistically better than 2SLS to describe relationships between variables in the system.
For the fishing production, the estimation is as follows:
= −867828+ 55808.11 + 39487.65 (3)
Duration of sunshine and temperatures give a positive impact to the production. The longer the sunshine, the production of fishing tends to increase. While the rainfall did not have a significant influence, so it does not enter into the equation.
Domestic fuel prices, which in this case is represented by the price of gasoline is influenced by the amount of oil production, world’s oil prices, and the exchange rate against the USD. As indicated by the equation:
= −942.625 + 0.000088 + 11.98542 + 0.388534 (4)
Indonesia is still an oil net importer country, where oil production alone is not sufficient to meet domestic fuel needs.
World oil price and oil production also have an unidirectional relationship with inflation. If other factors are constant, then any increase in 1 USD in world oil price, the inflation rate will increase by 0.009%, as shown by the equation:
= −5.0732 + ( 1.68 −07) + 0.008886 (5)
The amount of fish production, fuel prices, and inflation then jointly affect the value wage index:
= 115.5946 −2.31319 + ( 8.57 −06) −0.00222 (6)
Assuming other factors constant, then an increase in the number of fish catched will also cause an increase in wage. This is contrary to the rate of inflation and fuel prices.
Revenue components of fishermen are also significantly positively influenced by the production of fish, and negatively by the price of fuel and the inflation rate. While, the components that must be paid by fishermen are align with fuel prices, inflation, and wages. As stated by:
= 181.5767 + 0.000065 −0.01233 −12.3189 (7)
= −389.465 + 0.004421 + 4.542979 + 4.406633 (8)
The negative values of coefficient of fuel prices and inflation in the IT equation, but positive in the IB equation indicate that an increase in the income of fishermen as a result of the rising prices (product) is still lower than the increase in consumption and production costs to be incurred by fishermen.
Domestic fuel price, inflation, oil production, world’s oil price, and the exchange rate are macro assumptions in the state budget planning. Through simultaneous equations mentioned above, it can be predicted how the movement of IT and IB if the macro assumptions were altered. IT and IB of this movement will then determine NTN as an indicator of the welfare of fishermen who come to our attention.
The next concern in this study is; it is not always the case that a statistically good model is always able to follow the historic data. In this case, the 3SLS method that has been shown as a better one, will not necessarily give better predictions than 2SLS in terms of reflecting the historical data.
Through the simultaneous equations of each method, then the values of the predicted NTN (NTNCAP= ) are calculated. Forecasting accuracy in this study is measured by the root mean square percentage error (RMSPE):
= ∑ (9)
and Mean Absolute Percentage Error (MAPE)
= ∑ × 100% (10)
Both of these measures showed a quite surprising in fitting NTN. Simultaneous equations which estimated using 3SLS generate value RMSPE = 0.114187449 and MAPE = 8.73%. Meanwhile equations estimated by 2SLS produce a slightly smaller size, i.e. RMSPE = 0.114014872 and MAPE = 8:52%. This means that the equation by 2SLS a little better in predicting the value of the NTN. Because of the relatively small value of RMSPE , with MAPE below 10 percent mean that the predictions of the two methods is quite good.
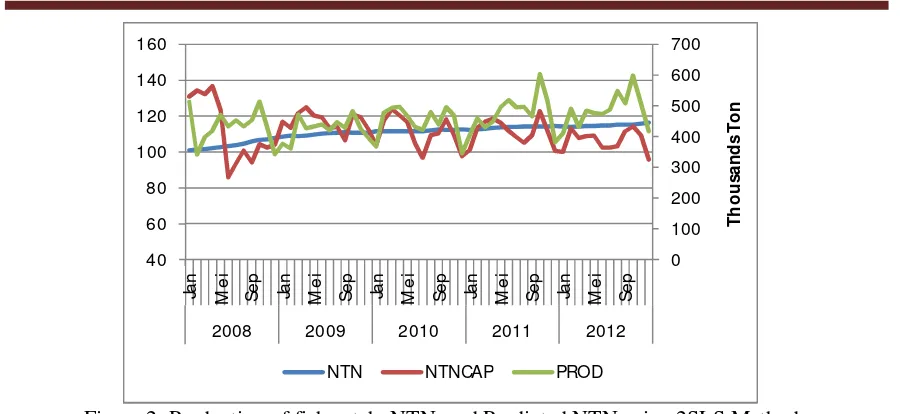
Figure 2. Production of fish catch, NTN, and Predicted NTN using 2SLS Method
Figure 3. Production of fish catch, NTN, and Predicted NTN using 3SLS Method
Figure 2 and figure 3 show that the values of predicted NTN move follows the fishery production, in contrast to the actual values of the NTN that are relatively insensitive to changes in the value of production. When the fish production increases, the expected welfare of fishermen at that time also increased, which is illustrated by the increase in NTN.
However, the simultaneous use of these models still need to be very cautious given the heterogenity that can be explained by the model is still quite small (R-sq = 62.75%). The equations estimated by 3SLS are good to explain the relationship between the production side, macro assumptions and the index of prices received and paid by fishermen. However, the equation estimated by 2SLS in this case is superior in predicting NTN.
Discusssion
Pindyck and Rubinfeld (as cited in Nadapdap, 1990, p.11) suggests that the difficulty in all systems estimation techniques is that the individual parameter estimates are sensitive to the specification of the entire system models. Serious errors in the specification of the equation may affect the estimation of all the parameters in the model equations. So the decision to use the system estimation requires a trade-off between the gains in efficiency and potential cost of specification error.
0 100 200 300 400 500 600 700
40 60 80 100 120 140 160
Ja
n
M
e
i
S
e
p
Ja
n
M
e
i
S
e
p
Ja
n
M
e
i
S
e
p
Ja
n
M
e
i
S
e
p
Ja
n
M
e
i
S
e
p
2008 2009 2010 2011 2012
T
h
o
u
s
a
n
d
s
T
o
n
NTN NTNCAP PROD
0 100 200 300 400 500 600 700
40 60 80 100 120 140 160
Ja
n
M
e
i
S
e
p
Ja
n
M
e
i
S
e
p
Ja
n
M
e
i
S
e
p
Ja
n
M
e
i
S
e
p
Ja
n
M
e
i
S
e
p
2008 2009 2010 2011 2012
T
h
o
u
s
a
n
d
s
T
o
n
[image:7.595.135.459.302.490.2]The less high of R-sq in this study may due to the incomplete model specification. Then, the selection of the best model depends heavily on the initial purpose of the modeling, whether to focus on the effect and relationship among variables or more concerned with forecasting for the future. Again, often there is a trade off between significance of the model and accuracy of prediction.
Conclusion and Suggestion Conclusion
Based on the research, it can be concluded that:
1. There is a significant simultaneous relationship among fishing production side, macroeconomy indicators, and fishermen terms.
2. The economic model that is better in connecting the production and macroeconomic assumptions with NTN is as indicated by the simultaneous equations that are estimated by 3SLS method.
3. The method of estimation using 3SLS has a better goodness of fit, so it is more suitable to describe the influence among variables. While Estimation with 2SLS produces a better equation in predicting NTN.
Suggestion
It is necessary to improve the specification of the model in order to obtain a more comprehensive relationship and produce a higher goodness of fit.
Bibliography
Colman, D. (2009). Agriculture’s Terms of Trade: Issues and Implications. Presidential Address prepared for presentation at the27th Conference of the International Association of Agricultural Economists, Beijing, China. Retrieved from http:// ageconsearch.umn.edu/bitstream/53200/2/Colman%20FINAL.pdf
Dwi. (2012). Pengaruh Angin dan Gelombang terhadap Hasil Tangkapan Laut di Selat Jawa. Retrieved from http://dwiperikanan.blogspot.com/2012/11/pengaruh-angin-dan-gelombang-terhadap.html
Elyerviana, A. (2011). Variabilitas Spasial dan Temporal Kecepatan Arus dan Angin Serta Kaitannya dengan Hasil Tangkapan di Perairan Laut Flores Menggunakan Data Tahun 2009 (Thesis). Hasanuddin University, Indonesia.
Gujarati, D. N. (2004). Basic Econometrics (4th Ed.). New York: The McGraw−Hill Companies.
Nadapdap, B. (1990). Studi Simulasi Model Persamaan Simultan untuk Makroeconomi Dengan Beberapa Metode Pendugaan (Masters Thesis). Bogor Agricultural University (IPB), Indonesia.
National Development Planning Agency. (2013). Analisis Nilai Tukar Petani (NTP) Sebagai Bahan Penyusunan RJMN Tahun 2015-2019. Jakarta, Indonesia: Bappenas
Seddighi, H. R., Lawler, K.A., Kalos, A.V. (2000). Econometrics A Practical Approach. London: Routledge.
Sofia, L. A. (2010). Production Factors Analysis of Gillnet Fisheries in Tanah Laut District. Ziraa’ah, 28(2), 99-108.
State Budget 2014 Act 2013 s. 38.d (IDN)