A Contemporary Accounting Approach in Detecting Potential Red Flag and Performance of Extreme Sport Apparel Company
Yuniarti Hidayah Suyoso Putra
Fakultas Ekonomi UIN Maulana Malik Ibrahim Malang Jalan Gajayana No.5 Malang
No Telephon: 081334119895; email:[email protected]
Abstrak
Penelitian ini bertujuan untuk mendeteksi
potential red flag, menilai
kinerja keuangan dan operasional dari perusahaan pakaian olahraga
ekstrim dengan menggunakan pendekatan akuntansi kontemporer dan
memberikan wawasan untuk mengobservasi profitabilitas perusahaan.
Penelitian berfokus pada Billabong International Ltd sebagai salah satu
merek terkemuka dan telah membentuk ceruk pasar di bidang surfing dan
pakaian olahraga ekstrim. Produknya telah dijual di lebih dari 90 negara
dan sasaran anak muda dalam pengembangan bisnisnya.
Hasil analisis menunjukkan bahwa Billabong diklasifikasikan
sebagai perusahaan yang menguntungkan. Terlihat dari peningkatan
profitabilitas dengan ROE (20,22%) > biaya ekuitas (8,16%) dan ROA
(13,41%)>WACC(6,86%).Perusahaan
juga
telah
mampu
mempertahankan pertumbuhan yang berkelanjutan. Namun, ada beberapa
area yang perlu dipertimbangkan seperti kurang efisiennya pengelolaan
piutang dan memiliki
potential red flagyang mungkin berkontribusi
terhadap distorsi informasi akuntansi. Sehingga, dibutuhkan beberapa
penyesuaian.
Kata Kunci: Pendekatan Akuntansi Kontemporer,
potential red flag,
Kinerja
INTRODUCTION
Founded in 1973 by Gordon and Rena Merchant at Burleigh Heads, Gold Coast-Australia, Billabong (BBG) has grown become an international holding company. BBG employs over 1,000 people and involves in the design, production and distribution of surf and board sports’ apparel and accessories for male, female, and youth market under the Billabong, Element, Honoloa, Kustom and Von Zipper brands
1,200 lines in Europe. The company promotes its product range through high profile athletes and involves in various events around the world
As one of the leading brand which focuses on extreme sport apparel with various leading brands, Billabong faces tight competition head to head with Quiksilver and Rip Curl in expanding the market. Therefore, it is very remarkable to investigate how Billabong positioned in the competition by detecting potential red flag, assessing financial performance and operation through utilise a contemporary accounting approach and give insight to observe the profitability of the companys.
METHODOLOGY Data
Billabong financial statements for financial year 2001 to 2005 will be the main interest in this research. Data of financial statements are collected from Connect 4 and Aspect Fin Analysis database. Meanwhile, 292 days daily share price and market index are obtained from ASX/S&P All Ordinaries and Yahoo Finance in order to calculate share price return, market return and beta of company. A market model is used in calculating Beta Company. Other relevant data are obtained from company’s website, Factiva and other related resources.
Analysis
Analysis through a contemporary accounting approach comprises four major parts, which include analysis of business strategies, industry analysis, accounting analysis, and financial analysis. Business strategy analysis covers strategic managerial planning, the company’s share return analysis relative to market return (292 days), capital structure and ownership.
RESULTS AND DISCUSSIONS Business Strategy Analysis
The major objectives of conducting business strategy analysis are identifying key profit drivers, business risks, and potential development of the company (Palepu, Healy, and Bernard, 2000). Therefore, the following section will give detail explanation of BBG business strategy analysis by comparing with industry.
Company Policies and Strategy
BBG implemented tax consolidation since 1st July 2002 that affects to the
recognition of tax consolidated group and deferred tax amounts associated to transactions, events and balances. Furthermore, the amounts receivable or payable with the tax-consolidated entities are recognized separately as tax-related amounts receivable or payable. According to BBG Financial Report (2005), expenses and revenues arising under tax sharing arrangements are recognized as a component of income tax expense (revenue). The company also decided to adopt International Financial Accounting Standards (IFRS) after 1stJanuary 2005. Consequently, BBG will
be required to restate its comparative financial statements to amounts which refecting the implementation of IFRS to that comparative period. Thus, the first impact of adoption will be revealed in the half-year financial report ending 31 December 2005 and 30 June 2006 (BBG Financial report, 2005).
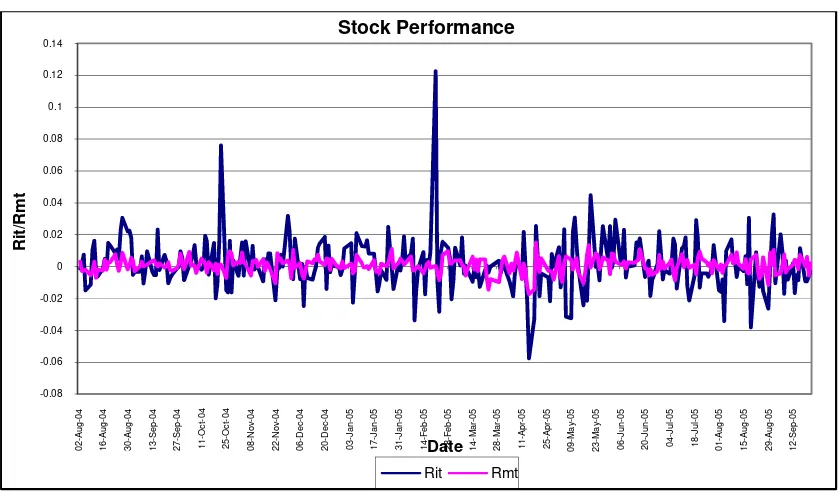
Stock Performance
The following figure describes BBG stock performance relatives to market index for the event period of 292 days. The calculation is based on return on company’s share price (Rit) and return on market index (Rmt). The analysis of the company’s stock price movement relatives to market is aimed to give a quick highlight about the company’s performance.
Figure 1. Stock performance relatives to market index for the last 292 days
Based on the observation presented in figure 1, BBG share price has a tendency to move upward indicated that the company performs better than the market for the last 292 days. Thus, the investors might consider this favourable information to make decision whether to continue invest in Billabong or not.
Furthermore, beta of the company is also calculating by employing the market model. Beta is the best risk indicators for company, which measures how sensitive a stock’s return to the return of the market (Elton, Gruber, Brown, and Goetzmann, 2003). By calculating beta, the risk characteristics of an individual stock can be analysed through its price volatility, then compared with the volatility of the entire stock market (in the same industry). Considering volatility is associated with risk,
292 days share price data, beta of the company is 0.83. It means that if market moves 1, BBG share price will move 0.83 in the same direction with the market.
Capital structure
If we have a look at BBG’s capital structure for five years, it seems that the company more rely on internal funding rather than employing debt in their operation. As we can see from table 1, it shows low composition of debt to equity. Roughly, total equity is in the range of 64% to 79% during 2001 to 2005.
Table 1. Composition of BBG Capital Structure
2001 2002 2003 2004 2005
Total Debt 21% 24% 33% 36% 32%
Total Equity 79% 76% 67% 64% 68%
Low composition of debt to equity indicates that the company can be classified as riskless company. However, it should become a major consideration in the future since it will be hard for the company just depend on the internal funding if they want to expand its operations.
Based on top 20 shareholders, as the founder of Billabong, Gordon Merchant (No. 2) Pty Ltd holds the biggest shares in the company (20.54%), followed by National Nominees Limited (10.91%), and Westpac Custodian Nominees Limited (10.41%).
Analysis
Industry analysis is aimed to identify Billabong position among the industry in the same sector.
Nature of the industry
estimation, the youth market age between 12 and 24 will contribute to the growth rate for the industry in the range of 10%-12% a year (Business Boom for Surf Firms, 2002).
IBIS reported that the demand in clothing retailing industry is affected by several factors such as the change in real household disposable income, consumer confidence and attitudes, brand recognition, changes in fashion, price of clothing relatives to other goods and season or weather condition. Furthermore, the competition in this industry is driven by the large number of retail stores operating in this industry, price, range of clothing, quality, brands and labels, service and location (
IBIS World, 2005)
. Those factors will affect the company in setting up the business strategy in order to survive in the competition.In Australia, clothing-retailing industry generated revenue of $9.2 billion in 2003-2004 and contributed $2.12 billion to the Australian economy. This fact represented 4.2% of retail sector revenue and 0.27% of total GDP (
IBIS World, 2005)
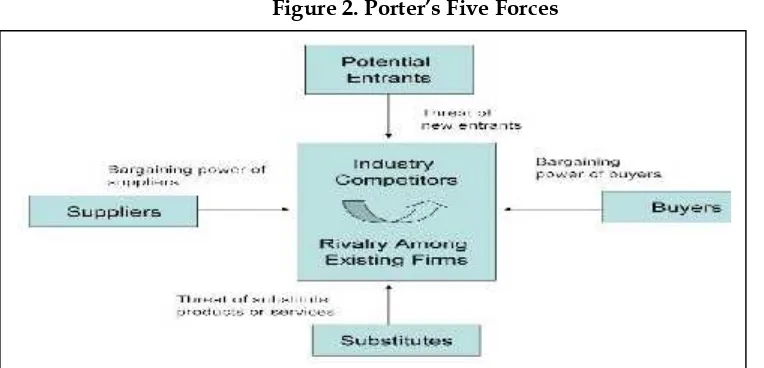
.Five Forces According to Porter
According to Porter (1980) there are five forces to consider when we analysed the industry. Those five forces consist of rivalry among existing firms, threat of new entrants, threat of substitute products, bargaining power of buyers, bargaining power of suppliers as described in figure 2.
First force is rivalry among existing firms.Rivalry among existing firms is low since the competition in this sector mainly based price, range of clothing, style of clothing, quality, brand and also large number of retail stores operating in this sector. Customers have a lot of choice due to diversity of the products, price or brand. Predominantly players of clothing-retailing industry in Australia are small to medium players such as Just Group, Sussan Corporation, Millers Retail Limited and Pretty Girl Fashion, which collectively accounted for 18.9 % of industry revenue in 2003-2004 (
IBIS World, 2005)
.Source: http://www.libraries.psu.edu/business/images/fiveforces.jpg
Second Force is threat of new entrance.Barriers to enter the industry are low regarding the cost of capital in establishing the new stores or outlets are relatively low. Low industry concentration since small to medium players only contribute 18.9% market shares, this situation brings an opportunity for the new entrance to enter the market. For larger market participant’s barriers to entry are high but for smaller independent operator's barriers to entry are low.
Moreover,thereis market segmentation in clothing-retail industry that gives a chance for the players to acquire niche market. The segmentation could be based on gender specific, product or demographic distribution. Based on product, for example Bras'N'Things specialize in underwear and sleepwear, Growing Concern specializes in maternity wear, Just Jeans and Jeanswest specialize in jeans, Fletcher Jones primarily sells business clothing, Rip Curl and Billabong sell surfwear, the Tie Rack sells ties, R M Williams sells bush gear and other stores such as Sportsco specialize in sporting clothing (
IBIS World, 2005)
.Third force is threat of substitute products. There is a higher threat of substitute products in this industry such as from department stores. Nowadays, department stores are sold a various ranges of products include clothes retailing, which enables the customers to do one stop shopping.
Fourth force is bargaining power of buyers. For this sector industry, buyers have high bargaining power. It is because buyers have a lot of choices based on price, quality, brand or range of clothing. Thus, it challenges the companies to provide products, which can compete in the market.
Based on industry analysis, we conclude that clothing-retailing industry can be classifiedas less risky business. Consequently, it is expected to obtain lower profit margin even though it has high opportunity to enter the market.
Accounting Analysis
purpose of accounting analysis is to evaluate the degree at which a firm’s accounting captures its underlying business reality (
Palepu, Healy, and Bernard,
2000)
. To do this analysis, we use 5 years financial reports of the company from year 2001 to 2005.Key Accounting Policies
As highlighted in the business analysis, the main activity of Billabong is producing and selling its products. Therefore, one key determinant factor for this firm is the inventory management. Figure 3 shows the inventory level of Billabong scaled with its total asset. It can be seen that, over a period of 5 years, Billabong has been able to manage its inventory level to a stable level of 11% averagely.
From the industry analysis, we know that the main target of Billabong is the youth market. Therefore, another key accounting policy for Billabong is the intangible asset, i.e. trade names. For young people, whether the item is branded or not, is an important consideration that influences them in buying products. Young people will choose to buy products that have a good brand name.
Figure 3. Billabong's Inventory level over 5-years period
Figure 4 illustrates the proportion of Billabong’s trade names figure itself increase over time and it comprises of more than 50% of its total asset. This indicates that Billabong has been able to address the importance of its intangible asset.
0.00 0.02 0.04 0.06 0.08 0.10 0.12 0.14
2001 2002 2003 2004 2005
Figure 4. Billabong's Trade-names and Trade-names/Total Asset
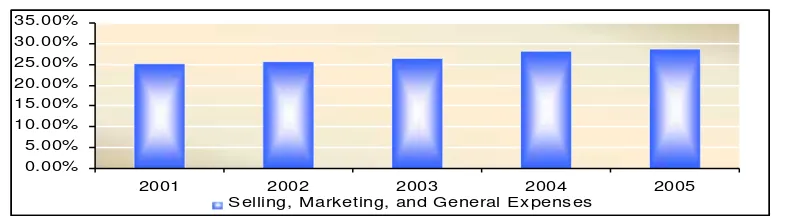
Since a good reputation is one key success factor for Billabong, marketing and general expense should be allocated sufficiently to address this issue. The company should take the importance of promotion into account. Figure 5 illustrates that over a 5-year period Billabong allocate approximately a quarter of its revenue as selling, marketing and general expense. The figure of selling, marketing, and general expense is scaled to its total revenue. This suggests that Billabong has allocated relatively enough funds to be able to promote its brand. Regularly sponsoring surfing and other sport competition is one way for Billabong to promote its brand.
Figure 5. Billabong's Selling, Marketing and General Expenses
Accounting Strategy & Quality of Disclosure
In the analysis of the financial statements of Billabong, generally the company presents relatively reliable information. As has been outlined in their independent audit report, the company presented true and fair view in communicating its performance. In its financial report, there is adequate information that explained its current performance. As an international company that operates through multiple business segments, Billabong reports have provided enough discussion for those segments.
Key accounting policies such as depreciation or inventory method adopted by Billabong also appropriate with the industry norms. There is no significant different that may raise concern for us.
Several changes have been made by Billabong in its accounting policy, which are all changes are disclosed in the financial reports. Footnotes have been used quite adequately in explaining key accounting policies and assumptions. Accounting policies that had been changed include the implementation of tax consolidation legislation, changing in the tax rate, changing the sales recognition and reclassification of liabilities for employee benefits.
Tax rate has changed in 2002 from 34% to 30% that resulted in a higher net profit after tax compare to previous few year. In addition, Billabong and its wholly owned Australian subsidiaries have implemented tax consolidation legislation and have changed its retail stores sales recognition policy from net basis to gross basis as at 1 July 2002. Also, there is a reclassification of the liability for employees benefit from provisions account to interest bearing liabilities and other creditor since 2003 and the changing of funding method during the same year. All changes in the accounting policies are disclosed in their report together with the adjusted number of those accounts that have been affected by the changes.
Potential Red Flags
Occasionally, management of a company might distort the quality of its accounting information (called earning management) to generate better outlook. To check on this issue, Billabong’s accounting information is plotted to find out the potential problematic areas. Figure 6, 7, 8, and 9 show the trend of various accounts that might potentially be the problematic areas.
Figure 6 above shows how the Billabong’s net profit after tax and operating cash flow over 5-year period. From the figure, it can be seen there is a period i.e. 2003, when net profit after tax and net cash flow from operating tax were deviated significantly. This deviation clearly shows a potential problematic area that need to be further investigated.
Figure 7. Billabong’s Income Tax and Net Profit after Tax
Figure 7 indicates Billabong’s income tax and net profit after tax. There is no significant gap in the trend for those accounts. Thus, it is not the area of our concern.
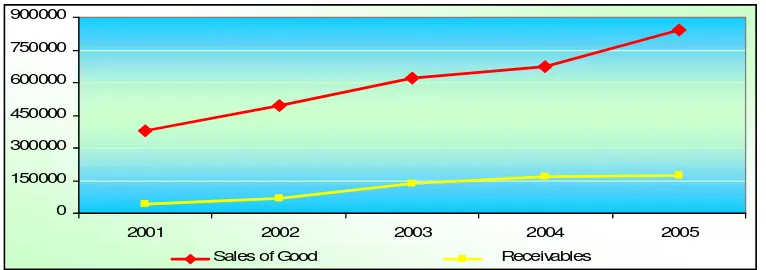
Figure 8. Billabong's Sales and Receivable
Figure 8 shows Billabong sales and receivable. It can be seen that the significant increase in sales is not followed with the same trend in the receivable, which concerns of management efficiencies.
Further analysis of management efficiency is
presented in financial ratio section
Net cash inflow from operating activities Net profit
Meanwhile, figure 9 shows Billabong provision and receivable. As indicated in the figure, during 2005, there could be a potential red flag in those accounts. The figure shows that in 2005, an increase in receivable is not followed by an increase in provision.
Figure 9. Billabong's Receivable and Provisions
Undo Accounting Distortions
After examining potential red flags areas, we identify two areas that need to be adjusted. Those areas are the net income-net operating cash flow and receivable and provisions of Billabong.
Overstated Receivables
As has been mentioned in the previous section, there was a big gap in the net profit after tax and net operating cash flow during 2003. We found that the gap is caused by the changing in the funding method from Debtors Factoring Facility to bank term debt.
In 2003, funds owed from the factoring company for debtors have been factored, but they have not been fully drawn in amount $43 million. This $43 million were disclosed by Billabong in the Balance Sheet as other debtors in its receivable.
0.0% 50.0% 100.0% 150.0% 200.0% 250.0% 300.0%
2001 2002 2003 2004 2005
drawings under the factoring facility, Cash flow from Operations was lower for the year.
See cash flow analysis section,
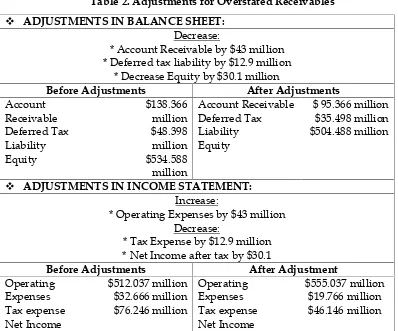
if the factoring facility had been fully drawn, as it was in 2002, Cash flow from Operations would be $49.9 million (i.e. $43.0 million higher than the $6.9 million reported). Adjustment for this is presented in the following table 2.Table 2. Adjustments for Overstated Receivables ADJUSTMENTS IN BALANCE SHEET:
Decrease:
* Account Receivable by $43 million * Deferred tax liability by $12.9 million
* Decrease Equity by $30.1 million
Before Adjustments After Adjustments
* Operating Expenses by $43 million Decrease:
* Tax Expense by $12.9 million * Net Income after tax by $30.1
Before Adjustments After Adjustment
Underestimated Provision for Doubtful Debt
From previous section, there is a potential red flag area in the receivable and provision. Normally, both accounts will increase and decrease in the same manner. However, from the figure 9 in previous section, we found that in 2005, there was an increase in the Account receivable but the provision was relatively stable. We adjust the figure by estimating the percentage of provision in 2005. We did the estimation by averaging out the percentage of Billabong provision from year 2001 to 2004. We came up with estimation provision of 8.2% of the receivables. Adjustment for this is presented in the following table 3.
Table 3. Adjustment for Underestimated Provision for Doubtful Debt ADJUSTMENTS IN BALANCE SHEET:
Decreased:
* Account Receivable by $2.642 million * Deferred tax liability by $0.793 million
* Equity by $1.845 million
* Net Income after tax by $1.845 million
Figure below illustrates the Account Receivables and provision before and after adjustment.
Figure 11. Billabong's Account Receivable before and after Adjustment
From the Accounting analysis, we can conclude that BBG has presented relatively reliable information in disclosing their performance. Nonetheless, in this analysis, we identify 2 areas that need to be adjusted before we further use it in analysing its financial ratios.
Financial ratio analysis
After analysis the reliability of BBG’s accounting information, financial ratio will be employed to further assess the company’s performance. There are four major parts of financial ratio analysis i.e. profitability, financial leverage, working capital, sustainable growth rate. We assess those financial ratios based on time series and cross sectional analysis.
Profitability
In analysing Billabong’s profitability, we choose the two most important and popular ratios, which are ROE and ROA.
Table 4. BBG’s ROE and ROA
2001 2002 2003 2004 2005
ROE 8.16% 11.52% 14.13% 15.64% 20.22%
ROA 6.47% 8.90% 9.48% 10.00% 13.41% Cost of equity = 8.16%; WACC = 6.86%
Source:
http://www.aspectfinancial.com.au.ezproxy.lib.monash.edu.au/af/company/annualratios?ASXCod
e=BBG&xtm-licensee=finanalysis
From table we can find both ROE and ROA have increased significantly from 2001 to 2005. Those figures have been doubled from 8.16% for ROE and 6.47% for ROA in 2001 to 20.22% and 13.41% in 2005 respectively. Both ratios, ROE and ROA, provide indicators of how well the company use the funds from investors.
As a benchmark, we compare ROE with cost of equity and ROA with WACC in 2005. Based on the comparison we conclude that Billabong is profitable since cost of equity (8.16%) < ROE (20.22%) and WACC (6.86%) < ROA (13.41%).
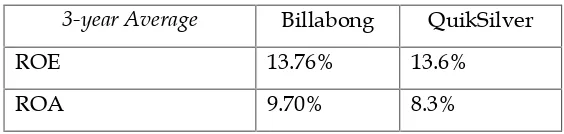
Furthermore, if we compare Billabong with Quiksilver, Billabong performs slightly better than Quiksilver based on 3 years analysis.
Table 5. ROE & ROA—Cross sectional analysis 3-year Average Billabong QuikSilver
ROE 13.76% 13.6%
ROA 9.70% 8.3%
Financial leverage
Financial leverage analysis is divided into two parts, which include short term liquidity and long term liquidity.
Short term liquidity:
Short-term liquidity is employed to measure the company’s ability to repay its current liabilities. In this case, current ratio and cash ratio are used to analyse company performance.
Table 6. BBG current ratio and cash ratio
2001 2002 2003 2004 2005
Source:
http://www.aspectfinancial.com.au.ezproxy.lib.monash.edu.au/af/company/annualrati
os?ASXCode=BBG&xtm-licensee=finanalysis
Table 6 indicates that over the last five years, Billabong’s current ratio has been relatively stable. The figure gives a good information to the creditors, because for every dollar of current liabilities can be covered by two dollars of current assets.
Meanwhile, cash ratio shows different trend. There was a slight decrease in the ratio from 2001 (50.90%) to 2005 (41.46%), with the lowest figure is in 2003 (38.88%). The reason for that is the company incurred a lot of dividend payment during the year, which affect our company cash flow (See cash flow analysis in the next section). However, the figures show that Billabong still has comfortable position in term of liquidity. Therefore, based on those ratios analysis we believe that Billabong has healthy short-term liquidity.
Table 7. Current ratio and cash ratio-Cross sectional Analysis
3-year Average Billabong QuikSilver
Current Ratio 2.58 2.6
Cash Ratio 42.45% 15.19%
From cross sectional analysis in table 7, Billabong and Quiksilver have almost the same figures for current ratio which indicate both companies have similar capability to cover its liabilities. Meanwhile, Billabong’s cash ratio is higher than Quiksilver demonstrated that the company has a high ability to cover its liabilities from liquid assets.
Long term liquidity
Long-term liquidity ratio is employed in analysing company’s ability to meet its long-term obligation. Debt to equity ratio and interest coverage ratio are used to measure our company long-term liquidity.
Table 8. D/E ratio and interest coverage ratio
2001 2002 2003 2004 2005
D/E ratio 0.26 0.29 0.41 0.53 0.51
Source:
http://www.aspectfinancial.com.au.ezproxy.lib.monash.edu.au/af/company/annualr
atios?ASXCode=BBG&xtm-licensee=finanalysis
Table 8 shows that D/E ratio has doubled from 2001 (0.26) to 2005 (0.51). It indicates that Billabong has taken an opportunity to use external funding to expand the business. Billabong interest coverage ratios are also moved up significantly over five years. It shows that Billabong has generated enough net income to cover its interest expense.
In comparison with Quiksilver, Billabong has been demonstrated better capability to meet its long-term liability (see table 9).
Table 9. D/E ratio and interest coverage ratio-Cross sectional analysis
3-year Average Billabong QuikSilver
D/E Ratio 0.41 0.25
Interest Coverage Ratio 17.97 13.31
Working capital ratio
Working capital ratios are used to analyse the how efficient the company manage its working capital. For our analysis, we use account receivable and inventory turnover to assess the management efficiency.
Table 10. BBG’s account receivable and inventory turnover
2001 2002 2003 2004 2005
A/C receivable turnover 9.57 9.14 7.57 5.56 6.07
Inventory turnover 3.76 4.08 4.31 3.75 3.78
Source:
http://www.aspectfinancial.com.au.ezproxy.lib.monash.edu.au/af/company/annualratios?
ASXCode=BBG&xtm-licensee=finanalysis
collecting its account receivable. Nonetheless, inventory turnover for both companies are almost the same.
Table 11. A/C receivable and inventory turnover-Cross sectional analysis 3-year Average Billabong QuikSilver
A/R Turnover 7.42 4.6
Inventory Turnover 4.05 4.1
Sustainable growth rate
Sustainable growth rate (SGR) is the rate at which the firm can grow while keeping its profitability and financial policy remain the same. Essentially, sustainable ratio is the aggregation of all ratios.
Table 12. BBG’s SGR
2001 2002 2003 2004 2005
SGR 3.13% 4.13% 5.35% 5.70% 7.26%
Table 12 suggests that Billabong has grown rapidly during the last five years. The ratio was increase from 3.13% in 2001 to 7.26% in 2005. However, according to the mean-reverting model, at certain point of time, we will expect that this rapid growth will be back to its mean.
Cash Flow Analysis Misclassifications
The analysis of Billabong cash flow statement is primarily aimed at investigating the firm’s cash flow from operating activities including free cash flow. Meanwhile, analysis of financing policies will be also examined. All of the above analysis will supplement the previous ratio analysis in examining Billabong’s operating activities, investment management, and financial risks.
Furthermore, cash flow from operation in 2003 was lower than previous years because the fund from factoring facilities ($43 million) had not been recorded. We adjusted the figure by adding $43 million in the net cash inflow from operation in 2003. Table below shows the cash flow from operations and financing before and after adjustment.
Table 13. Cash Flow-Adjustments
BEFORE ADJUSTMENT 2001 2002 2003 2004 2005 Net Cash Inflow from
Operation*
33,201 47,342 6,926 66,615 116,362
Net cash from financing 251,107 (3,259) 918 (18,163) (81,129)
AFTER ADJUSTMENT 2001 2002 2003 2004 2005
Net Cash Inflow from Operation
32,540 46,907 49,596 66,125 115,620
Net cash from financing** 251,768 (2,824) 1,249 (17,673) (80,378)
Note: *Net cash flow from operation includes the interest received. Meanwhile ** net cash
flow from financing has included the interest received
The Ability to Meet Obligations
The following chart is especially to analyze Billabong’s ability to meet its interest expenses and dividends with CFFO. The positive result in the table shows that the company can meet the obligations to pay interest expenses to debt holders and dividends to shareholders.
Table 14. The Ability of CFFO to pay interest expenses and dividends
($ In thousand) 2001 2002 2003 2004 2005
CFFO 32,540 46,907 49,595 66,125 115,620
Interest Exp. 6,591 8,705 7,389 5,700 5,896
After Interest exp. 25,949 38,203 42,206 60,425 109,725 Dividend paid 12,914 30,972 42,131 50,630 64,898 After paying Interest
+Dividends
13,035 7,231 75 9,795 44,827
issue was part of BBG’s Executive Share Plan, where each executive were required to enter into a Call Options Agreement. In 2004 particularly, the share issues were also aimed at financing the purchase of Element brand. Furthermore, Billabong paid up a lot of dividend during 2003 that cause cash flow after interest expense and dividend payment deteriorated.
Free Cash Flow
Another analysis technique used to assess BBG cash flow performance isfree cash flow (FCF). FCF is cash that are available for growth, debt payment, and dividends. This can be calculated by subtracting capital expenditure from cash flow form operation (CFFO). The calculation is tabled in the following.
Table 15. Free cash flow
2002 2003 2004 2005
Free Cash Flow to Debt and Equity 5,609 16,150 105,550 136,260 Free Cash Flow to Equity 108,069 151,201 134,436 166,623
BBG have had health free cash flow during 2001 and 2005. Positive FCF was reported during the period, which is a health sign, given an increasing trend. The results are satisfying and almost similar with the results from the analysis of CFFO. Overall, an adequate amount of cash will be available to whenever BBG needs it to fulfil all its financial commitments like serving debt, investing in growth and rewarding its shareholders.
Valuation
There are many models to value one company asset, in our report we choose discount cash flow (DCF) model to value our company. We have calculated free cash to equity, free cash flow to capital and cost of equity, and cost of capital in previous section in order to apply DCF model. As a result, we find that the value of equity of our company is 446 million and the value of capital of our company is 933 million.
Table 16. DCF Model based on NPV formula
2002 2003 2004 2005
Free Cash Flow to Debt and Equity
5,609 16,150 105,550 136,260
Free Cash Flow to Equity
Cost of equity 8.16% Value of the company
$445,772.55
Cost of capital 6.86% $933,223.55
CONCLUSION AND LIMITATION
Based on the analysis on the prior sections, we conclude that Billabong can be classified as a profitable company. From business strategy perspective, this company has established market segmentation in surf and extreme sport apparel and also a strong brand image, which enables to achieve high profitability. Financial ratio analysis also shows that Billabong has an upward trend of profitability. However, there are some certain areas needs to notice such as the company is less efficient in managing account receivable, and needs to adjust some accounts in term of accounting information reliability. Moreover, we estimate for the next 5 years, the company will keep continue the business in favourable direction based on forecasting analysis and sustainable growth rate.
All data regarding this project are limited to publicly available data. Moreover, since it is difficult to obtain data from comparable competitors, we restrict discussion by comparing Billabong with Quiksilver.
REFERENCES
BBG Financial report, 2005.
Business Boom for Surf Firms (26 March 2002),
http://news.bbc.co.uk/1/hi/business/1891961.stm, Date Accessed [12 August 2005].
Elton, J. E., Gruber, M.J., Brown, S. J., and Goetzmann, W. N. (2003), Modern Portfolio Theory and Investment Analysis, Sixth Edition, John Wiley & Sons Inc., The United State of America.
http://billabong.demo.atwww.com/section_one_a.html, Date accessed [10 October 2005]
http://www.aspectfinancial.com.au.ezproxy.lib.monash.edu.au/af/company/annu alratios?ASXCode=BBG&xtm-licensee=finanalysis
IBIS World, 2005. Clothing retailing industry analysis.
www.aspectfinancial.com.au.ezproxy.lib.monash.edu.au/af/company/mainview?A SXCode=BBG,Date Accessed [7/8/2005]
www.billabongcorporate.com/index.cfm, Date Accessed [7/8/2005]
(http://www.billabongcorporate.com/index.cfm).
(www.aspectfinancial.com.au.ezproxy.lib.monash.edu.au/af/company/mainview? ASXCode=BBG).